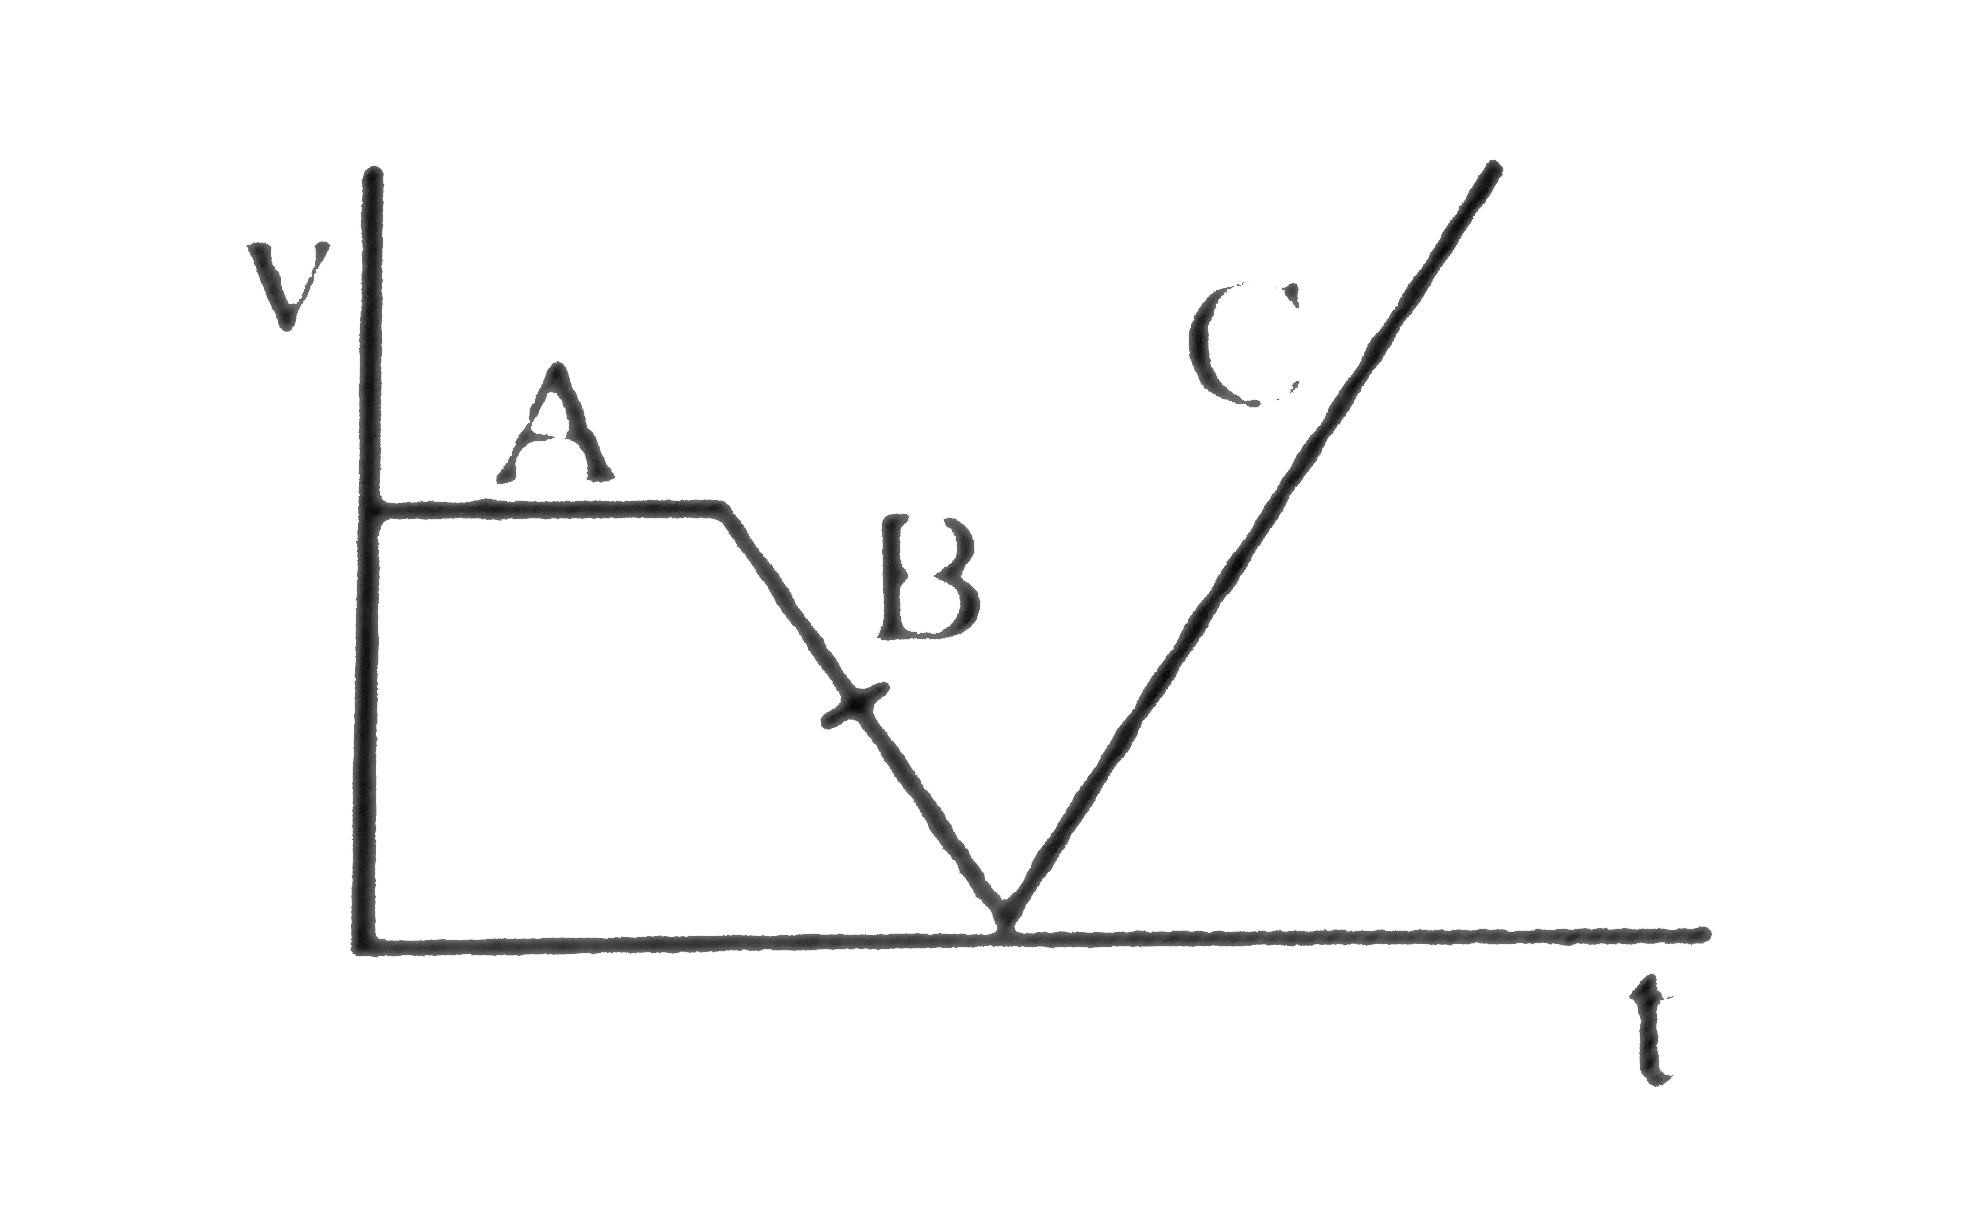
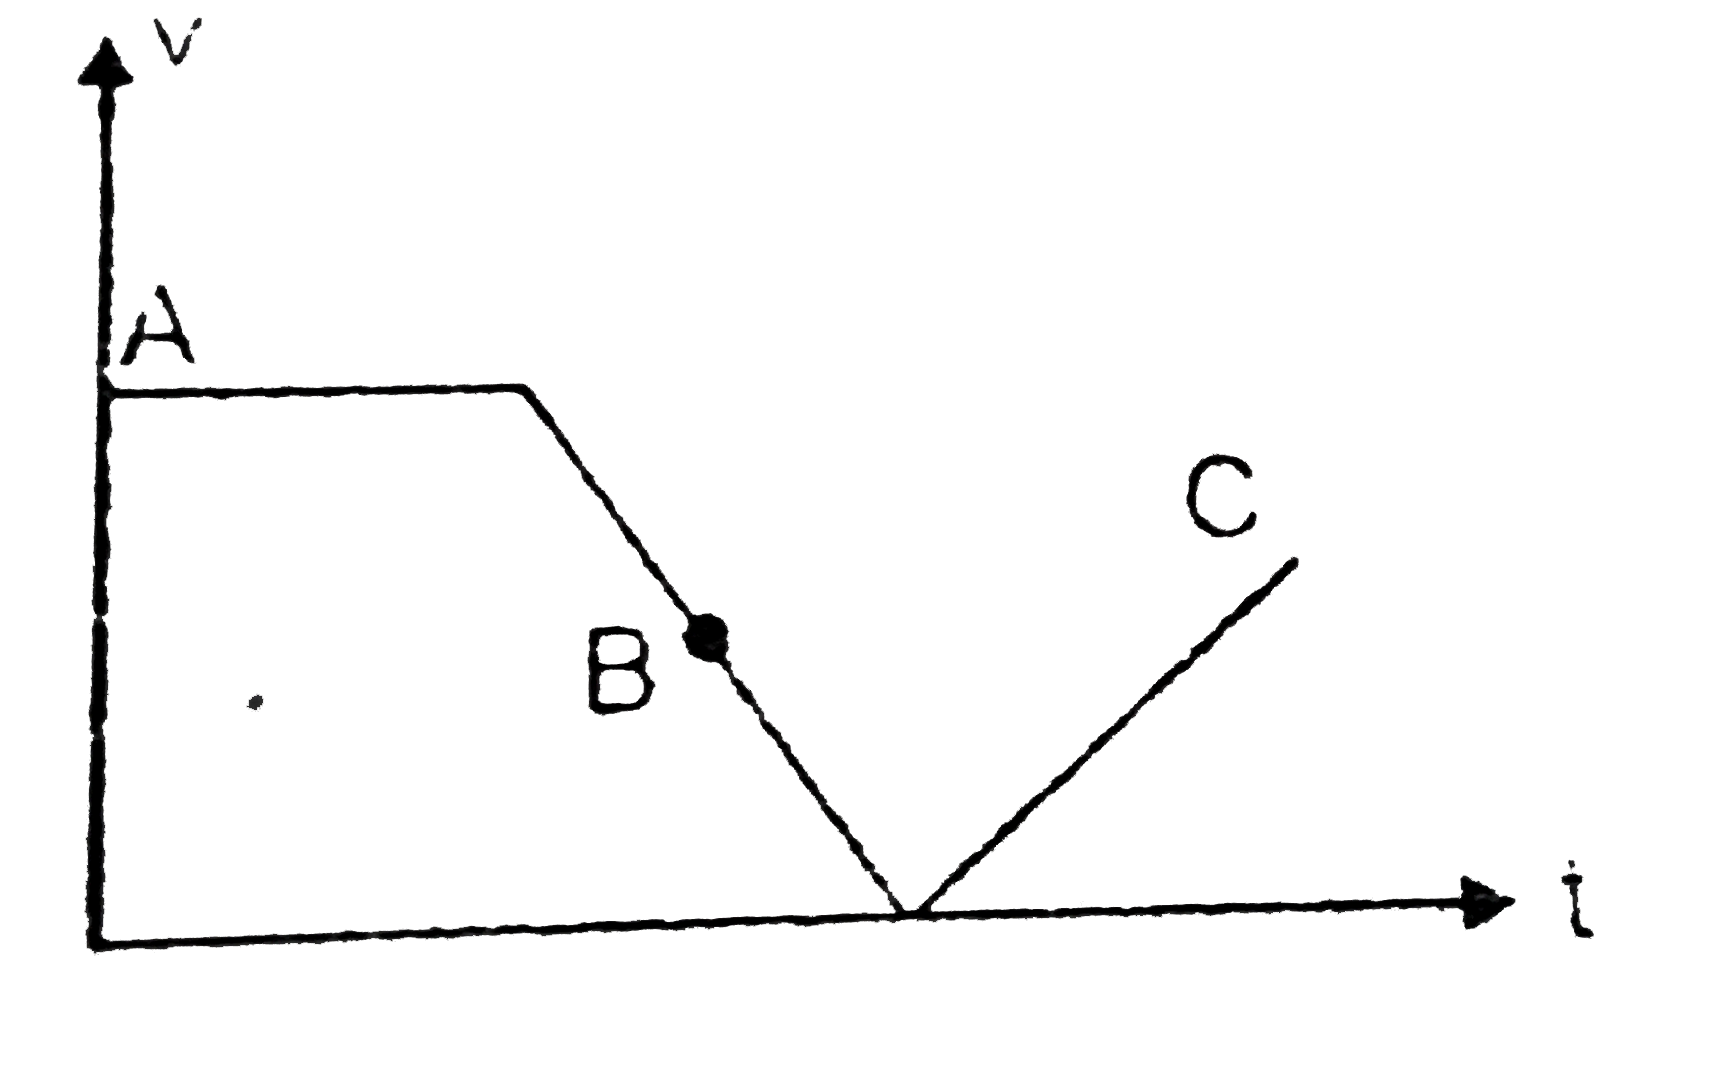
The velocity versus time curve of a moving point is shown in Fig.The retardation is (m/s^(2)
Step by step video solution for The velocity versus time curve of a moving point is shown in Fig.The retardation is (m/s^(2) by Physics experts to help you in doubts & scoring excellent marks in Class 12 exams.
Updated on:21/07/2023Similar Questions
Knowledge Check
The velocity time curve of a moving point is shown in Fig. Find the retardation of the particle for the porion CD.
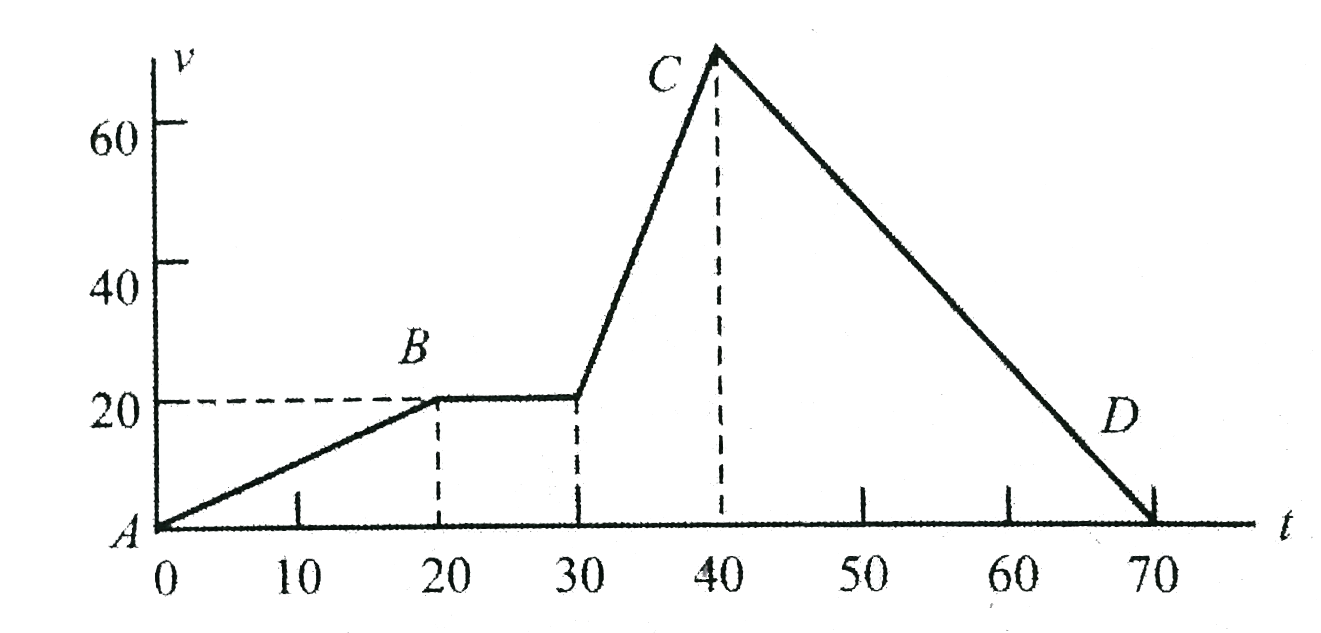 .A4ms−2B2ms−2C3ms−2D6ms−2
The velocity versus time graph of a body moving in a straight line is as shown in the figure below
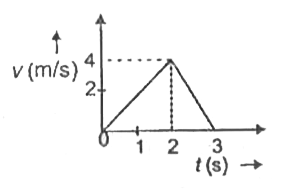 AThe distance covered by the body in 0 to 2s is 8mBThe acceleration of the body in 0 to 2s is 4ms−2CThe accelerationof the body in 2 to 3s is 4ms−2DThe distance moved by the body during 0 to 3 is 6 m
The velocity versus time graph of a body moving along a straight line is as shown in figure. The ratio of displacement and distance covered body in 5 second is :-
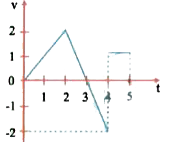 A2:3B3:5C1:1D1:5:5
Velocity versus displacement curve of a particle moving in straight line is shown in the figure from a point P, a line is drawn perpendicular to displacement axis and line PR is drawn normal to the curve at P. The instantaneous acceleration of the particle at point P is V(m/s) (2,0) R (3,0) S(m)
View SolutionThe velocity versus time graph of two particles moving along x-axis varies are shown in the following two plots. Then
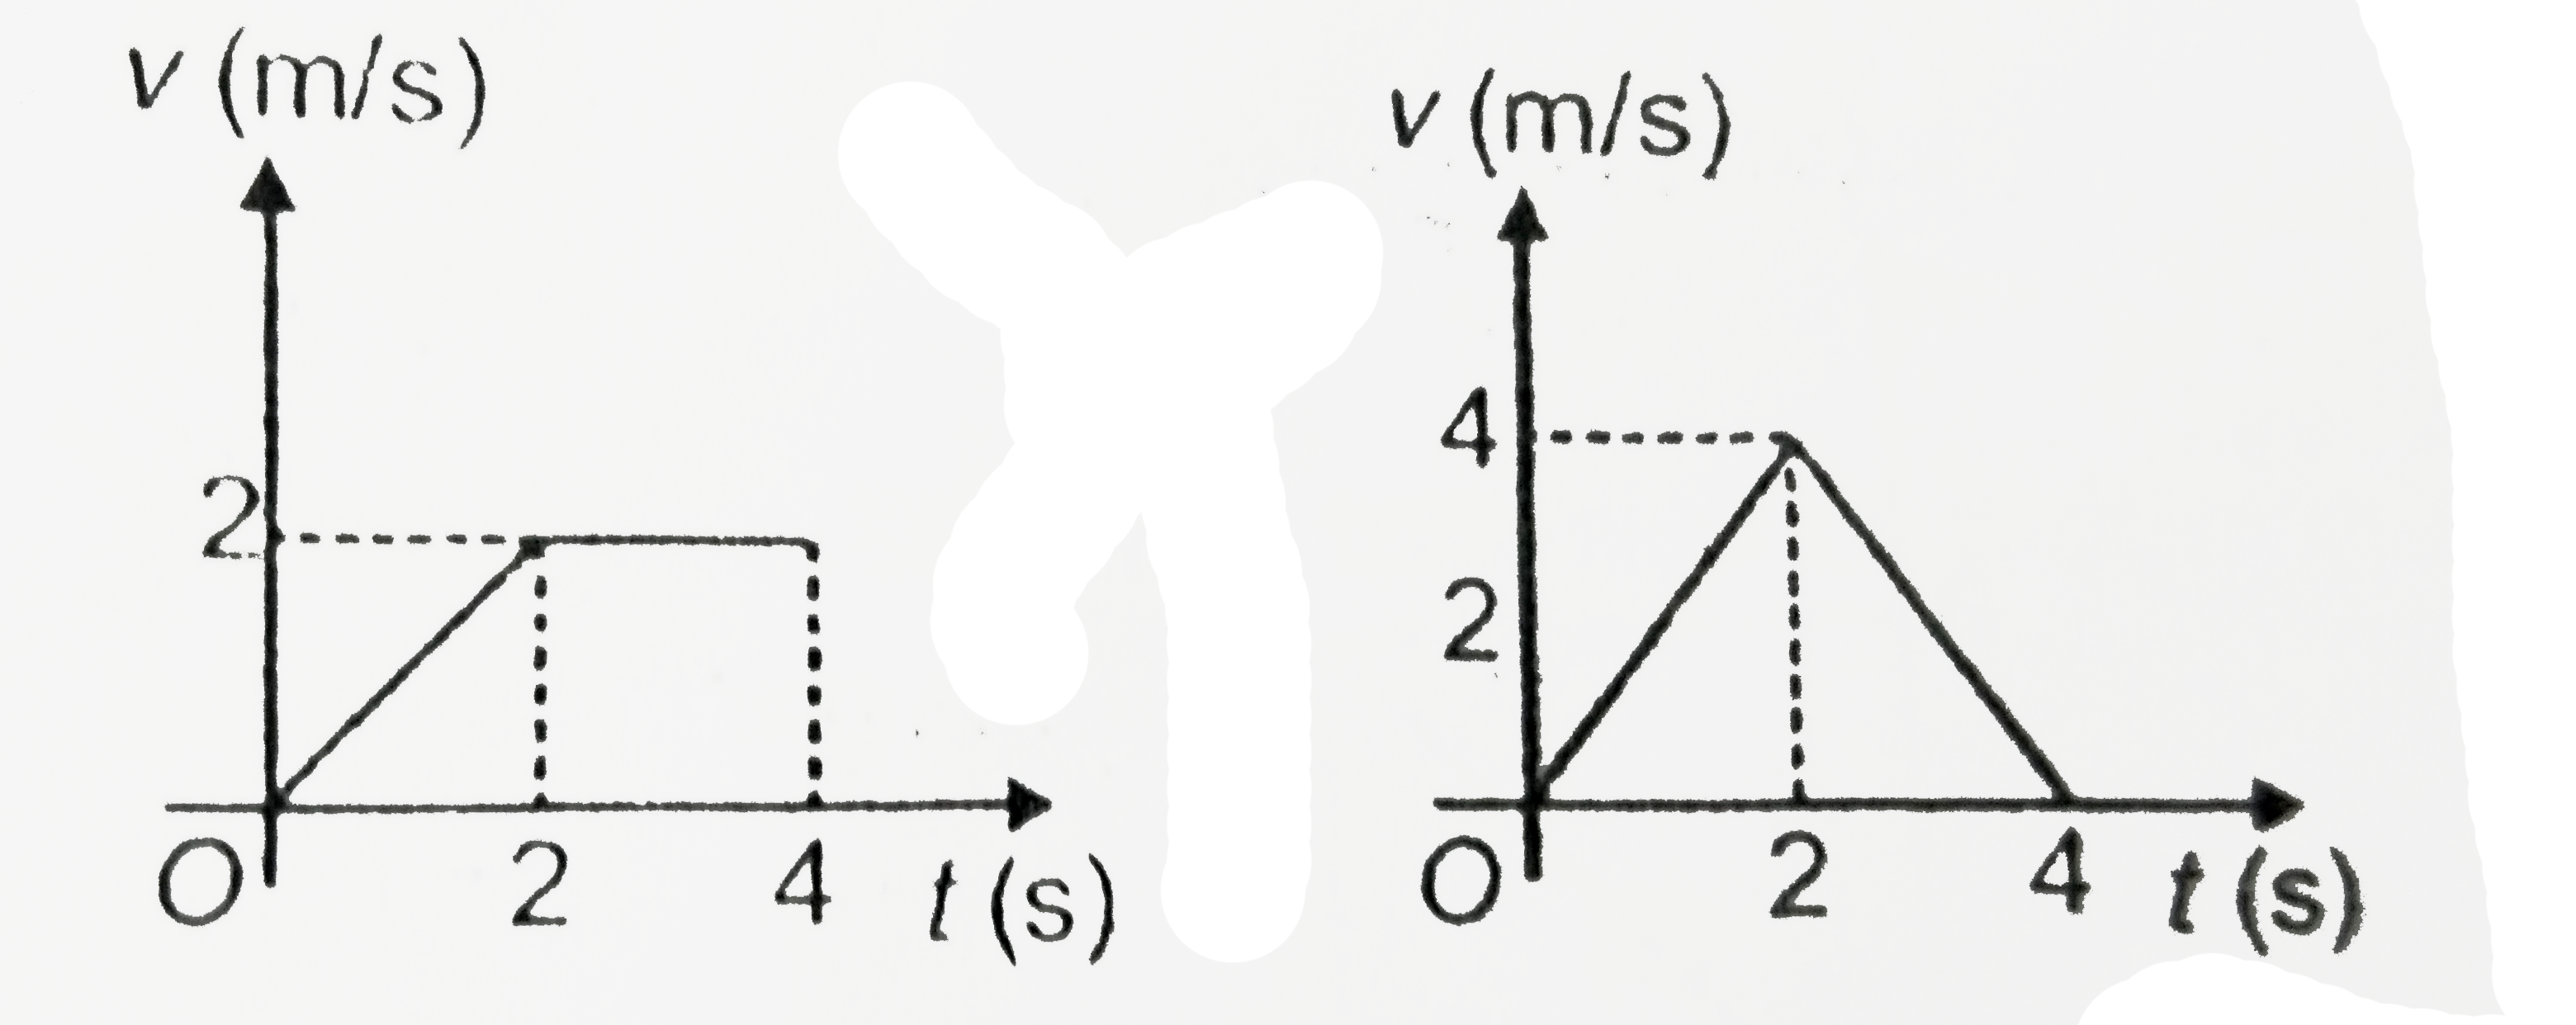
View SolutionThe velocity versus time of two particles moving along x-axis varies as shown in the following two plots. Then
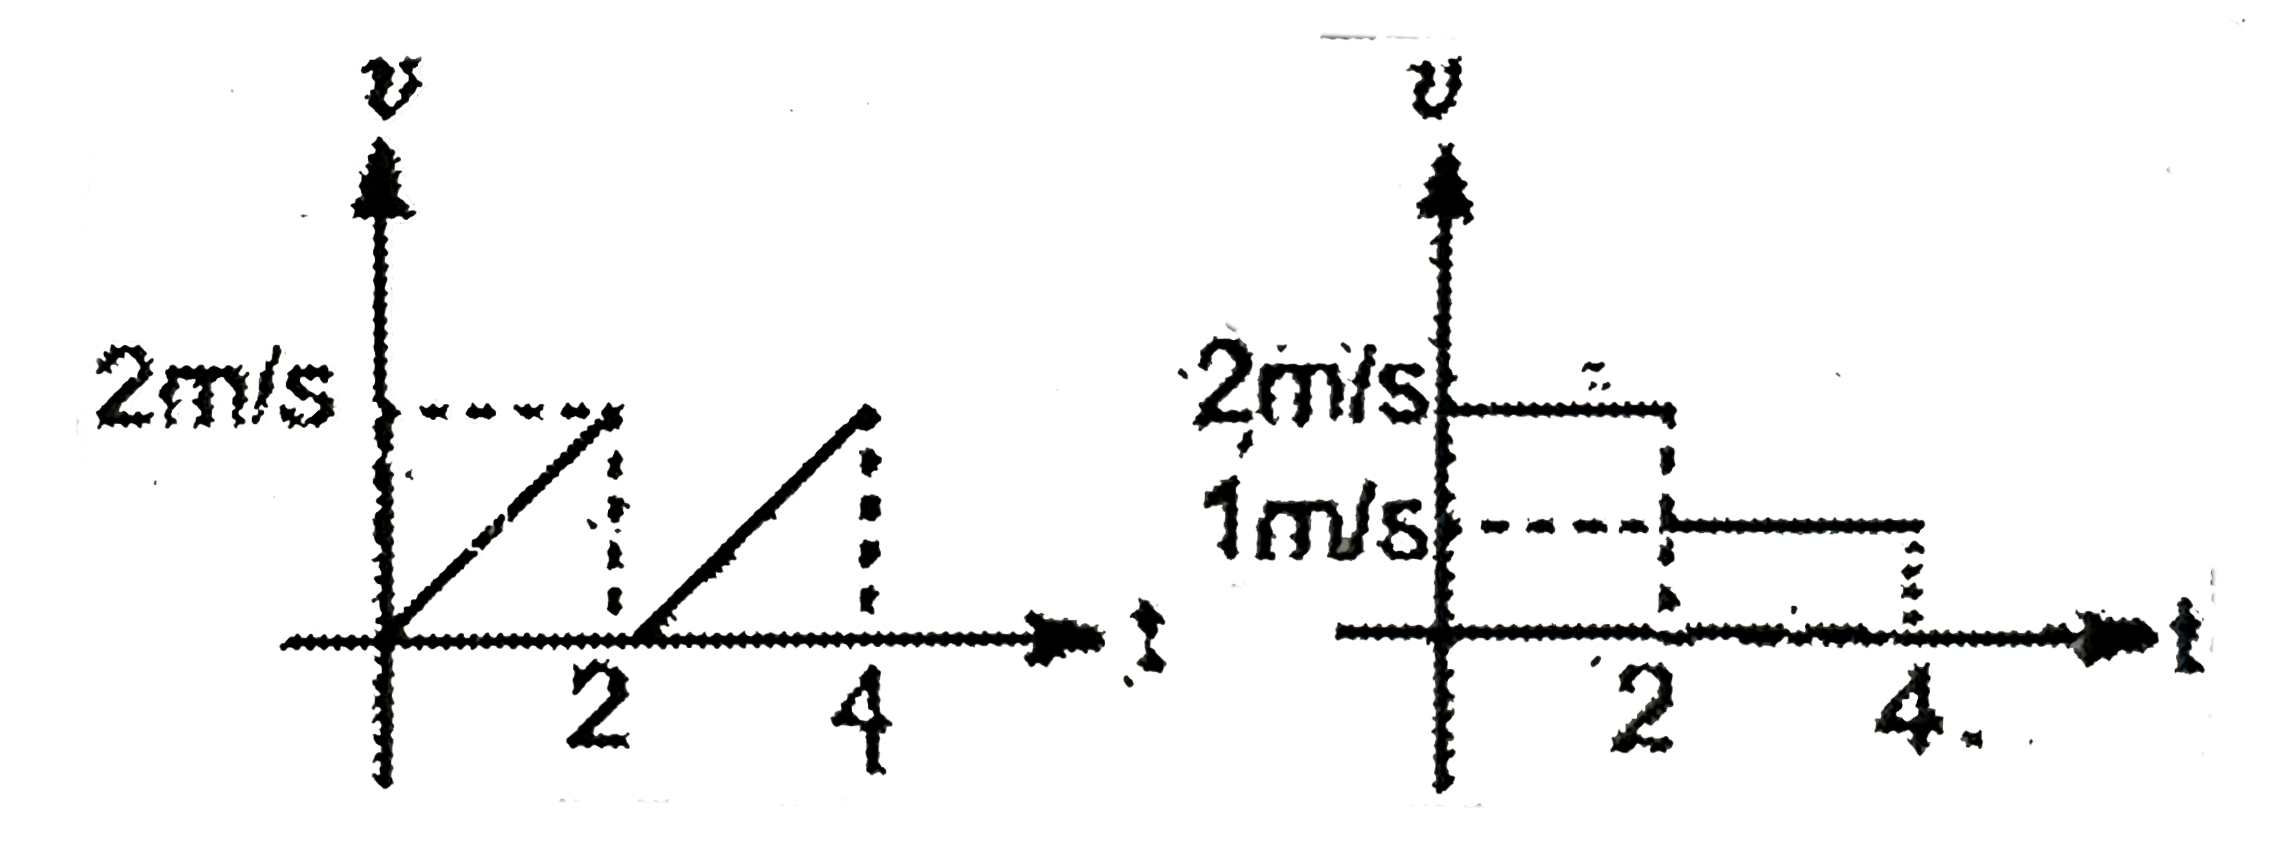
View SolutionThe velocity-time graph of a particle moving along a straight line is shown is Fig. The rate of acceleration and deceleration is constant and it is equal to 5ms−2. If the a average velocity during the motion is 20ms−1, Then
 .
.
The maximum velocity of the particle is
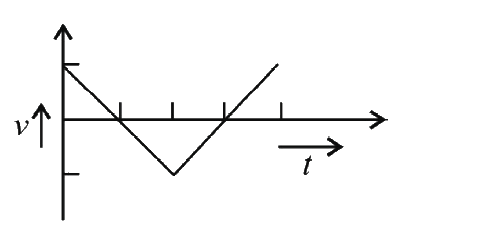
View SolutionThe graph in figure shows the velocity v versus time t for a body. Which of the graphs shown in figure represents the corresponding acceleration versus time graphs ?
View Solution
