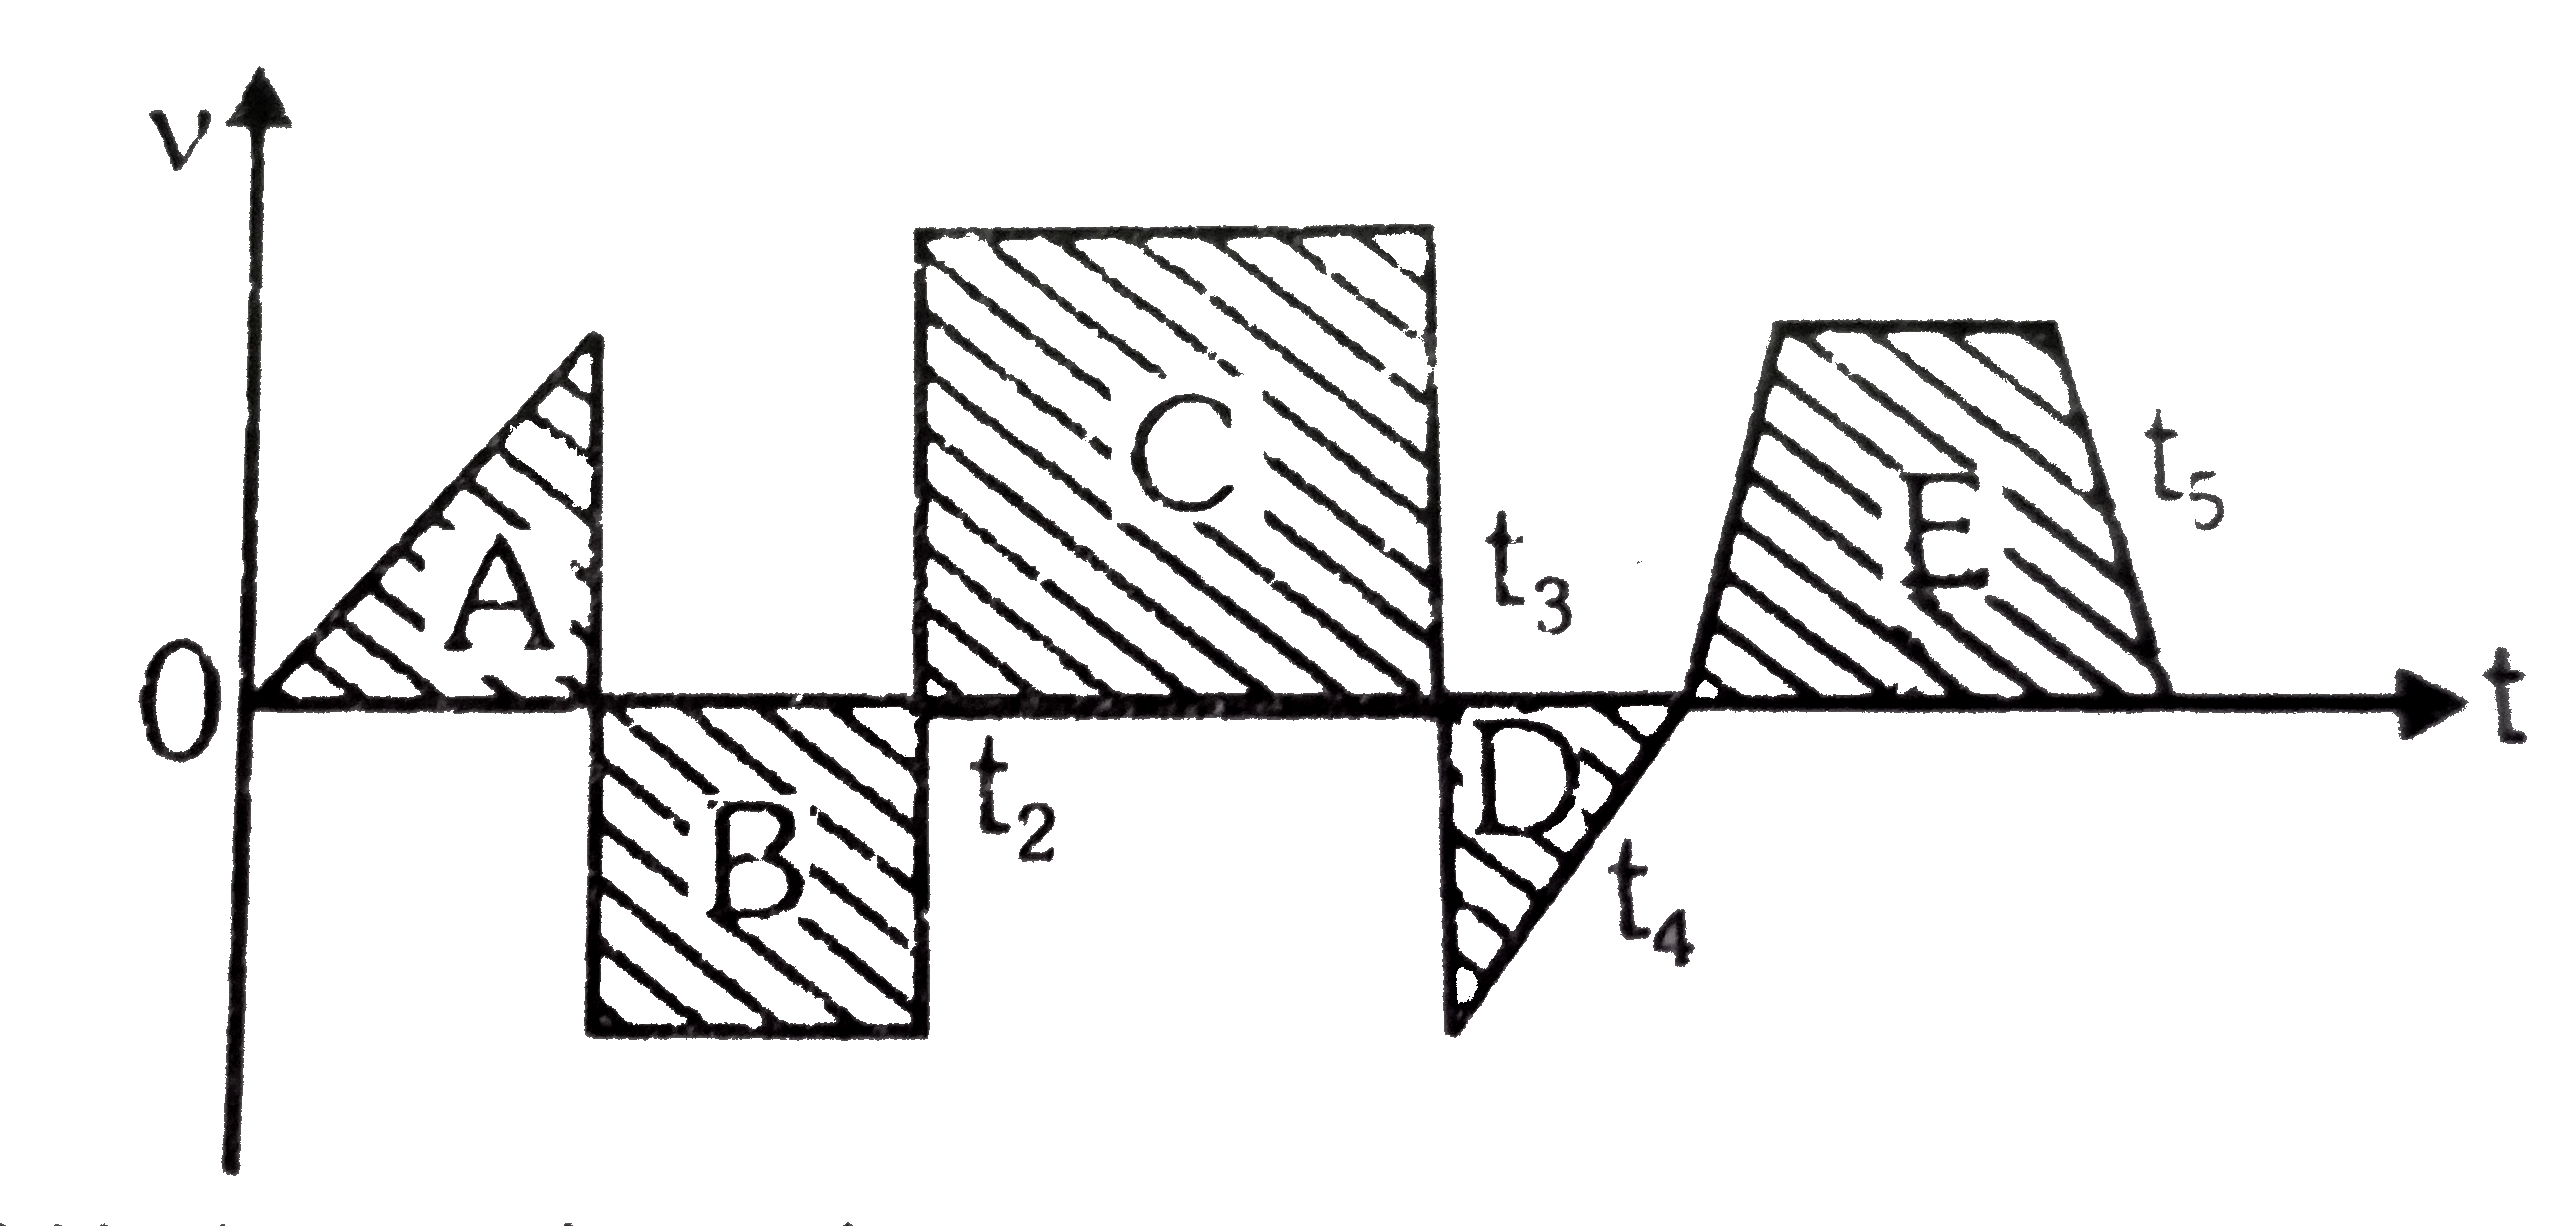
The velocity - time graph for linear motion of an object is as shown. Find
(a) The distance travelled and
(b) Displacement for the interval between 5 s and 40 s.
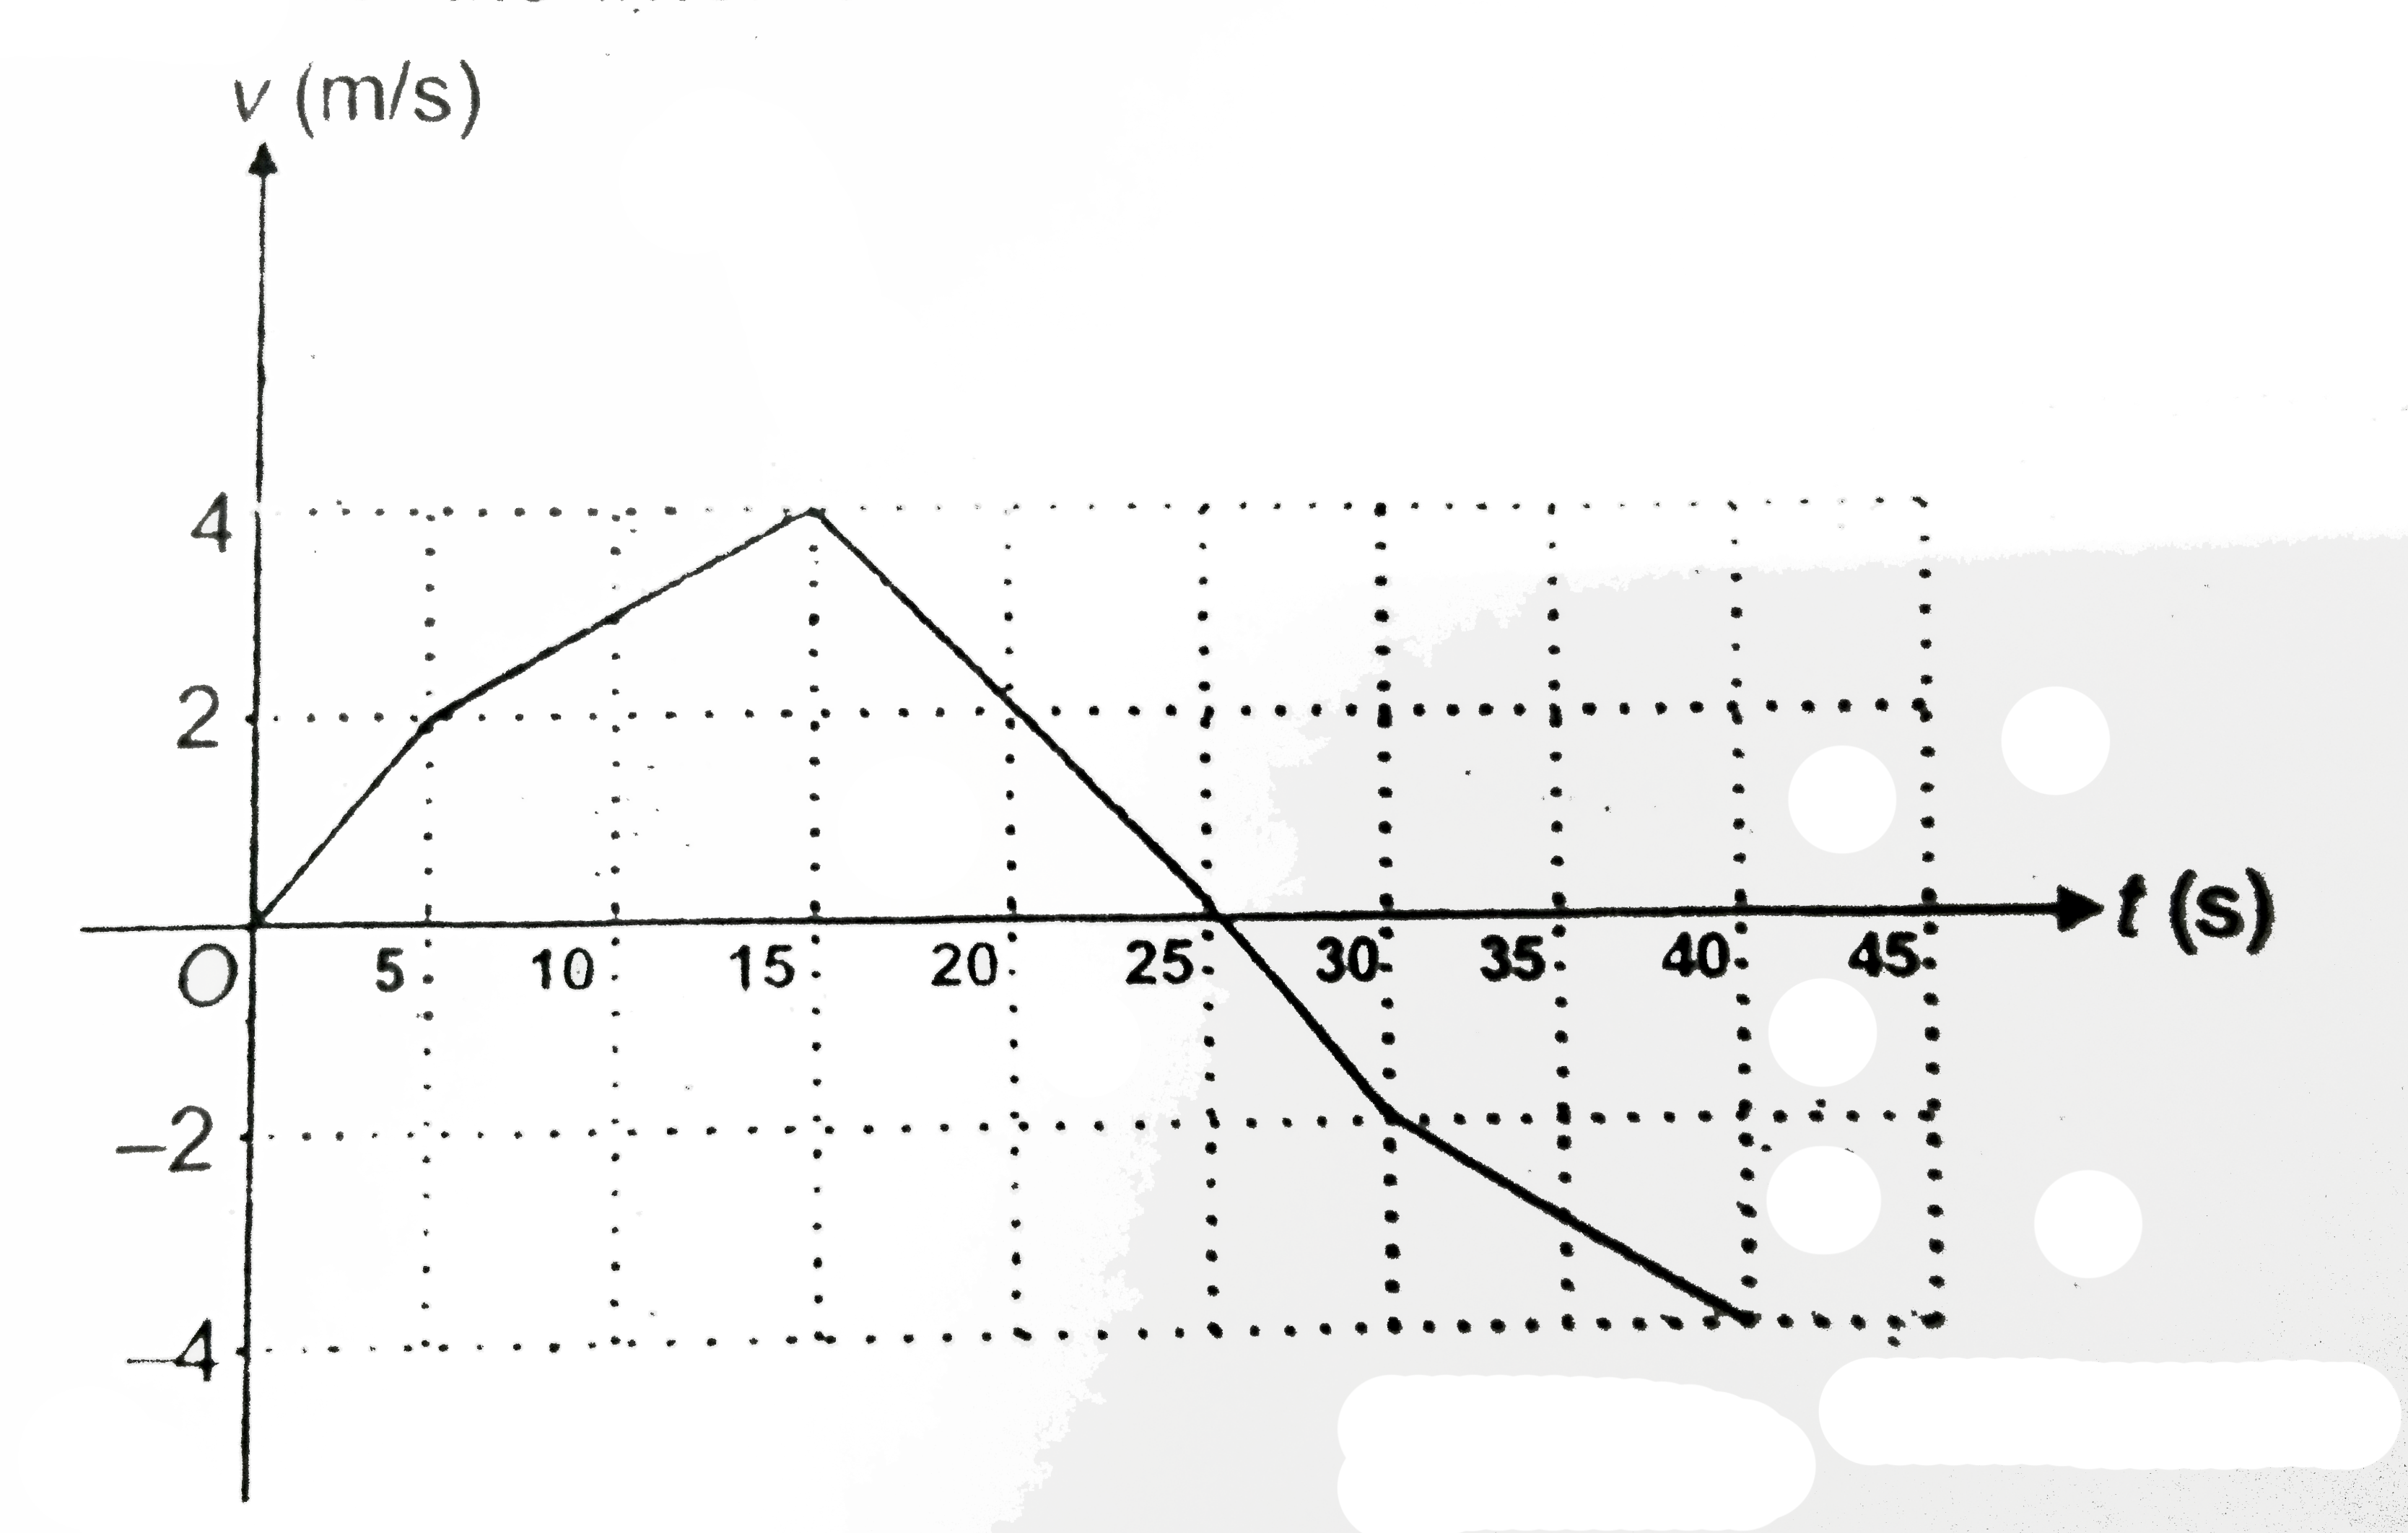
From velocity - time graph
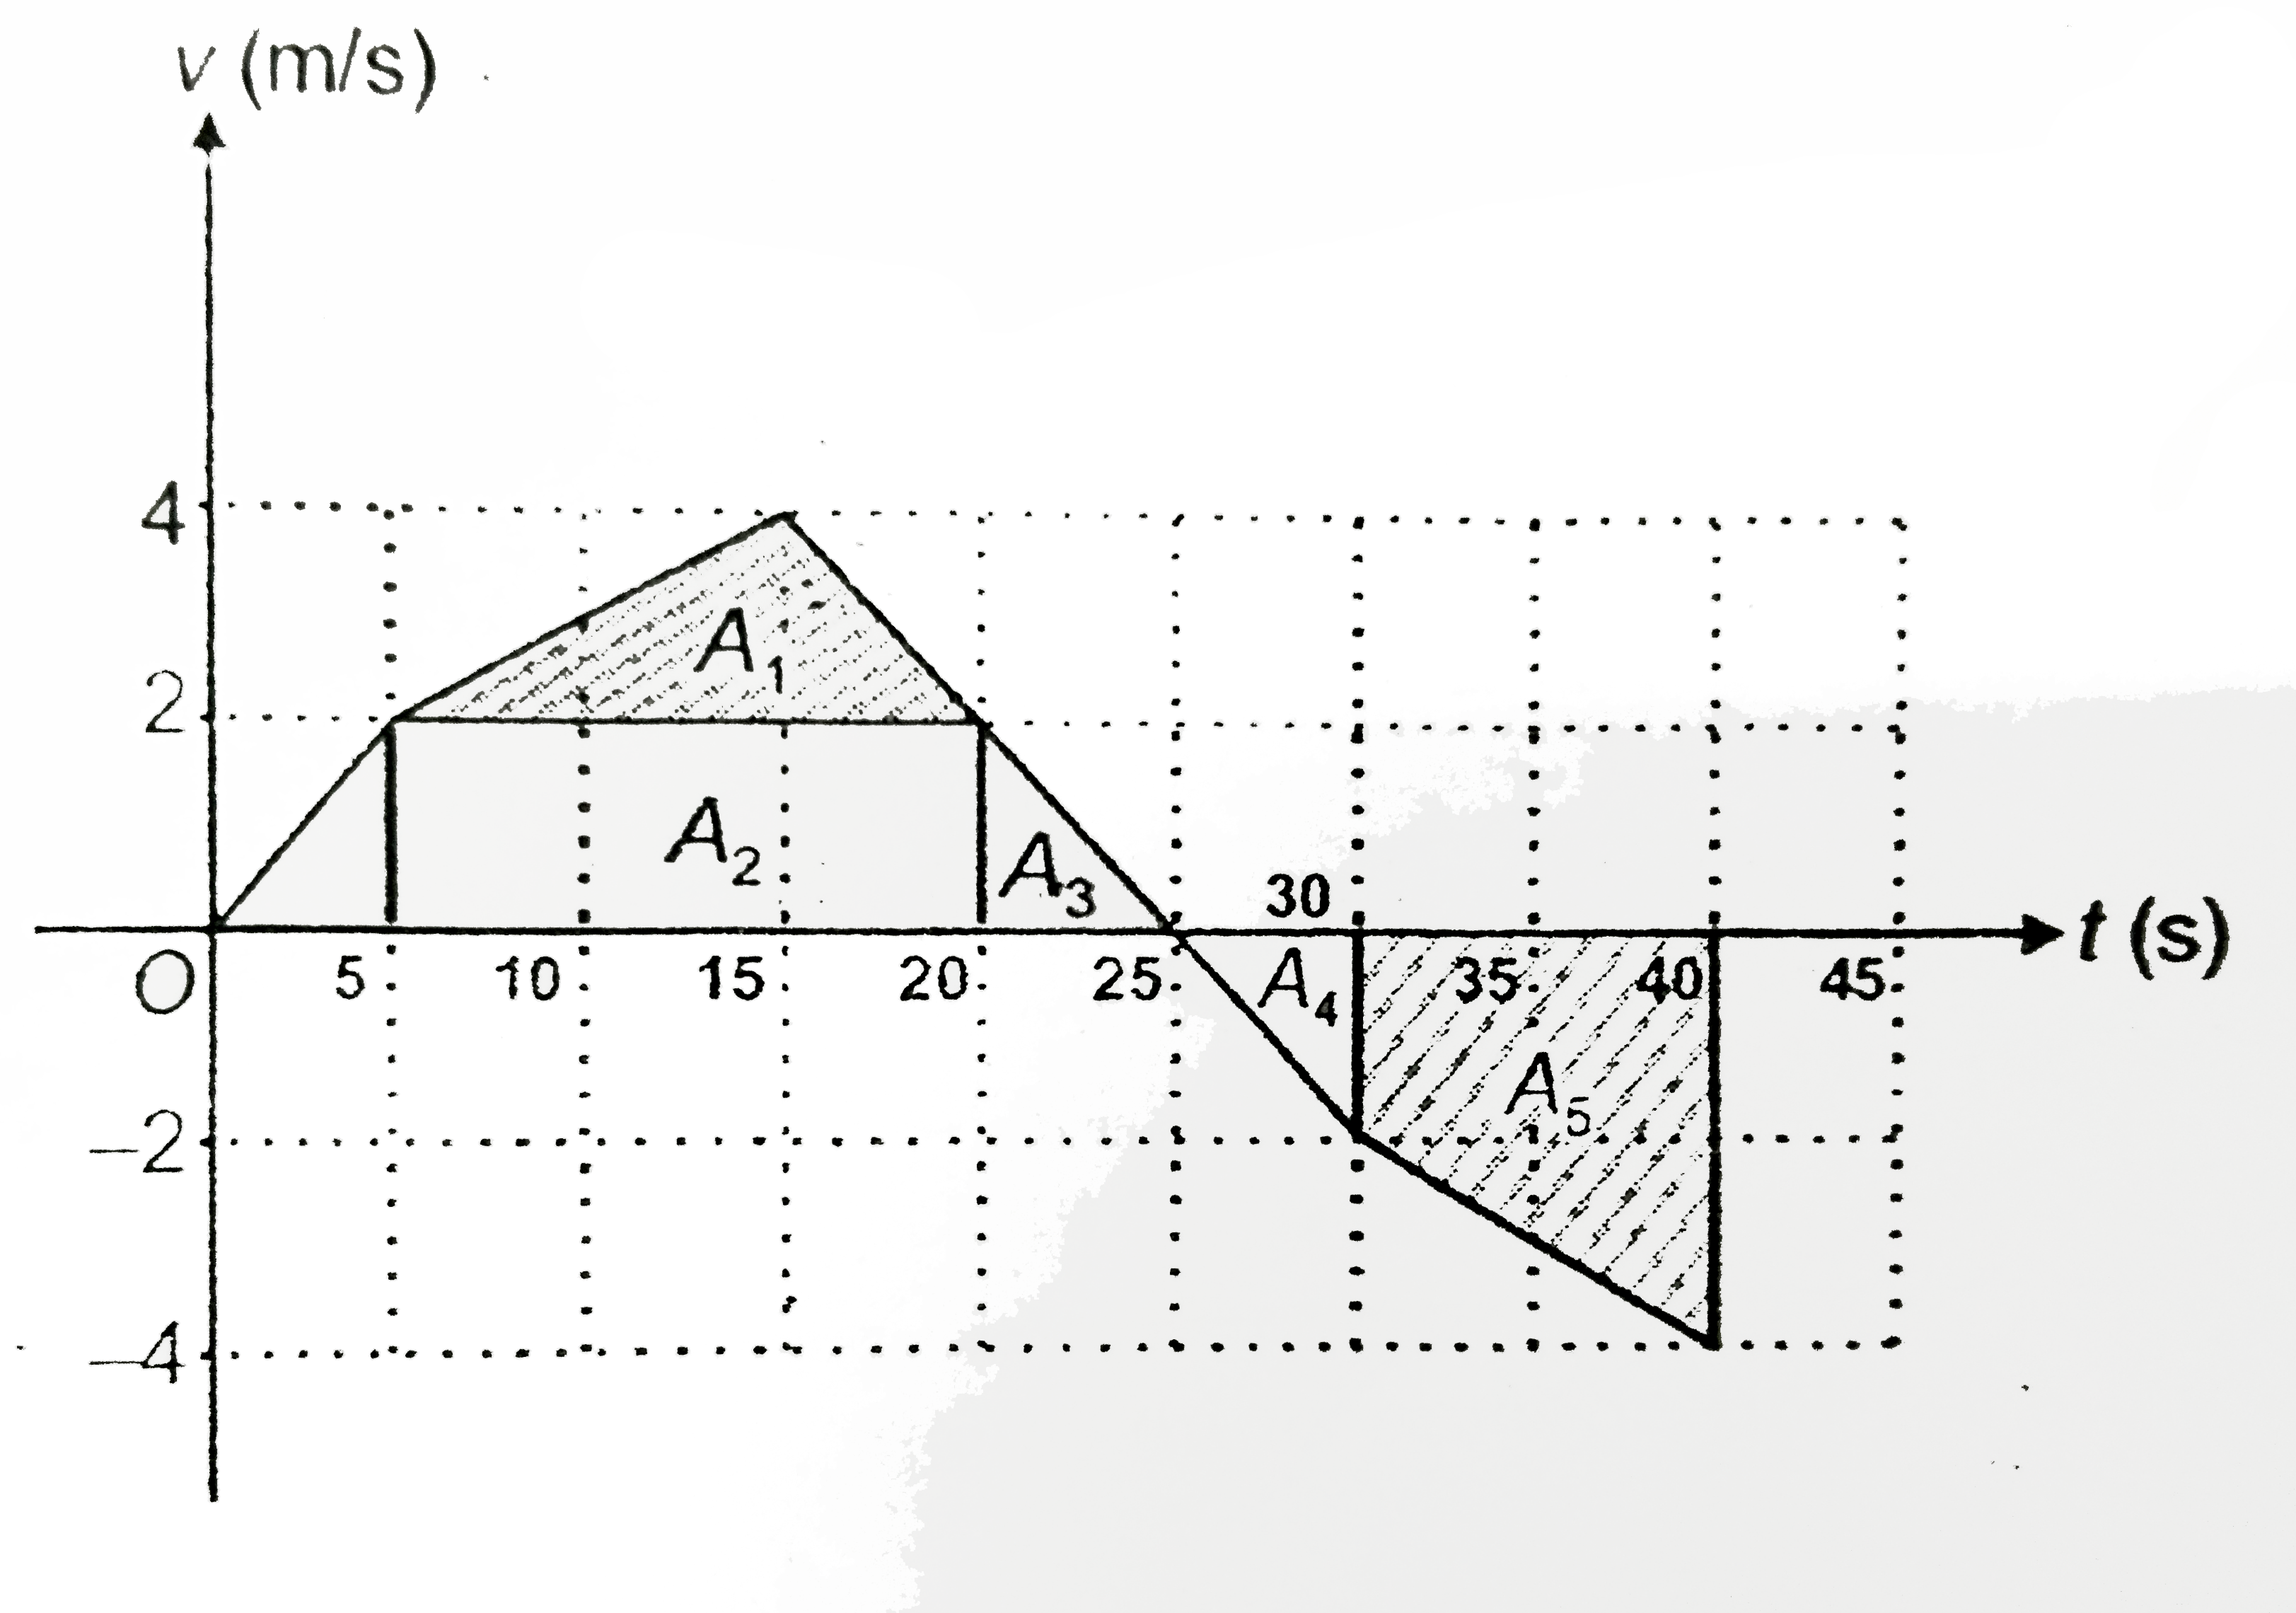
A1=12{20−5}×(4−2)=12×15×2=15m
A2=(20−5)×2=15×2=30m
A3=12×(25−20)×2=12×5×2=5m
A4=12×(30−25)×2=12×5×2=5m
A5=12{2+4}×{40−30}=12×6×10=30m
Total distance=(A1+A2+A3+A4+A5
=15m+30m+5m+5m+30m=85m
Total displacement=A1+A2+A3+(−A4)+(−A5)
=15m+30m+5m+(−5m)+(−30m)
=15m
Topper's Solved these Questions
- MOTION IN STRAIGHT LINEBOOK - AAKASH INSTITUTE ENGLISHCHAPTER - MOTION IN STRAIGHT LINEEXERCISE - Try Yourself
40 Videos
- MOTION IN STRAIGHT LINEBOOK - AAKASH INSTITUTE ENGLISHCHAPTER - MOTION IN STRAIGHT LINEEXERCISE - Assignment (SECTION - A)
50 Videos
- MOTION IN A STRAIGHT LINEBOOK - AAKASH INSTITUTE ENGLISHCHAPTER - MOTION IN A STRAIGHT LINEEXERCISE - ASSIGNMENT (SECTION - D)
15 Videos
- MOVING CHARGE AND MAGNESIUMBOOK - AAKASH INSTITUTE ENGLISHCHAPTER - MOVING CHARGE AND MAGNESIUMEXERCISE - SECTION D
16 Videos
Similar Questions
Knowledge Check
The velocity-time graph of a linear motion is shown below . The displacement from the origin after 8 seconds is
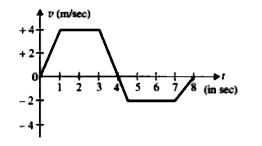 A18 mB6 mC8 mD16 m
The velocity-time graph of a linear motion is shown in figure. The displacement from the origin after 8 sec is :
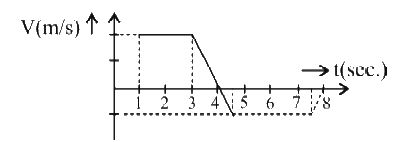
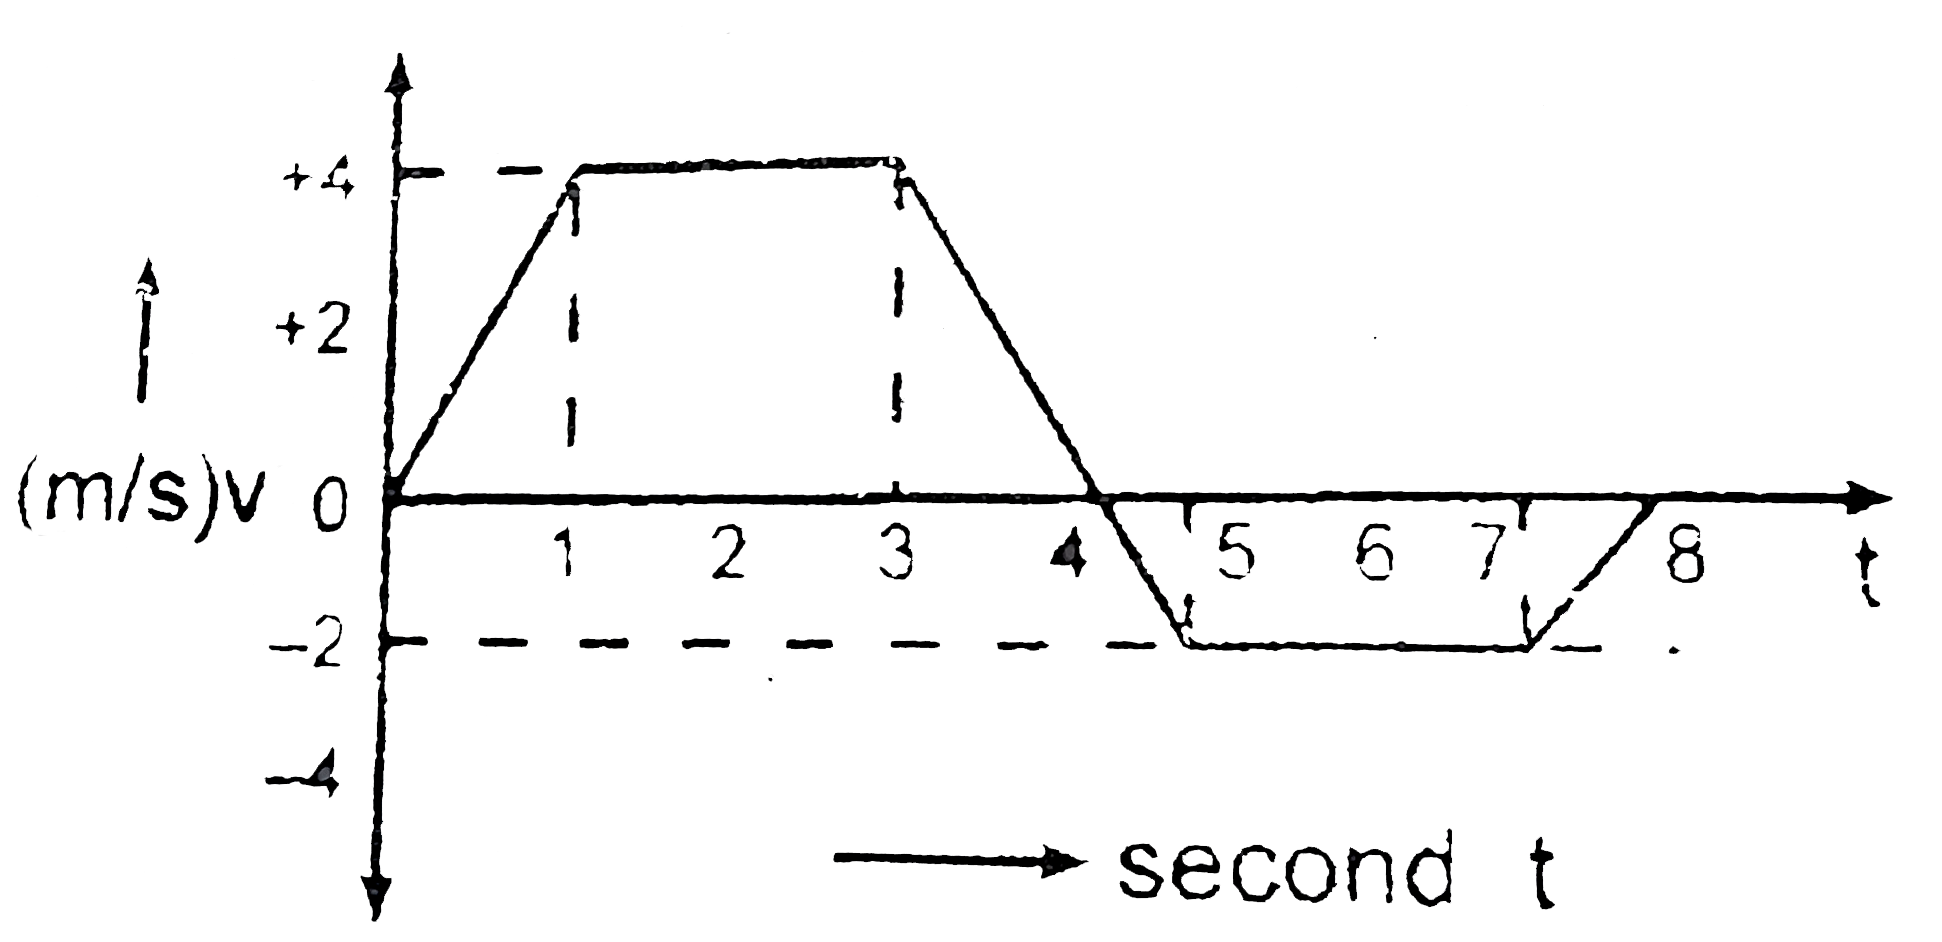
View SolutionThe velocity time graph of a linear motion is shown in the figure. The distance from the starting point after 8 seconds will be
 .
.
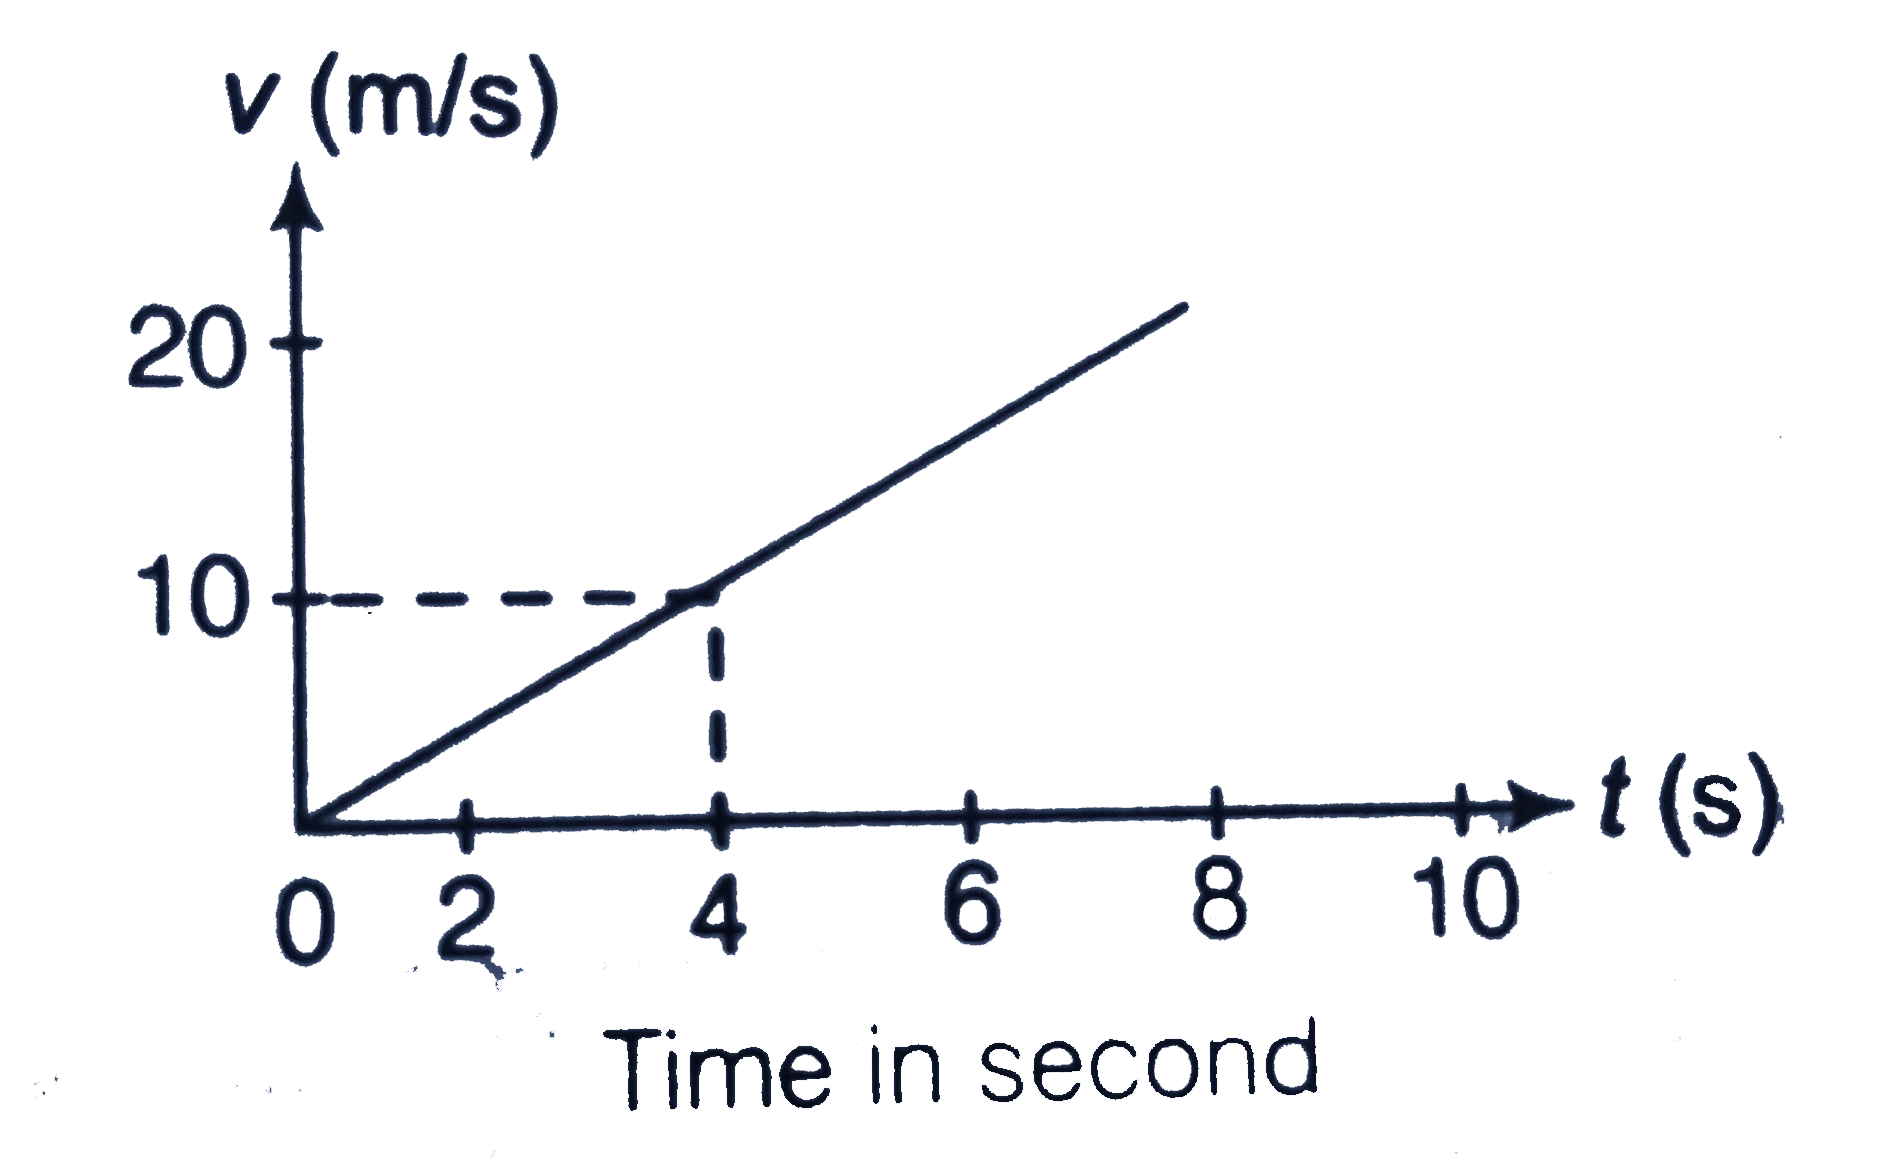
View SolutionThe velocity of a car as a function of time is shown in Fig. Find the distance travelled by the car in 8s and its acceleration.
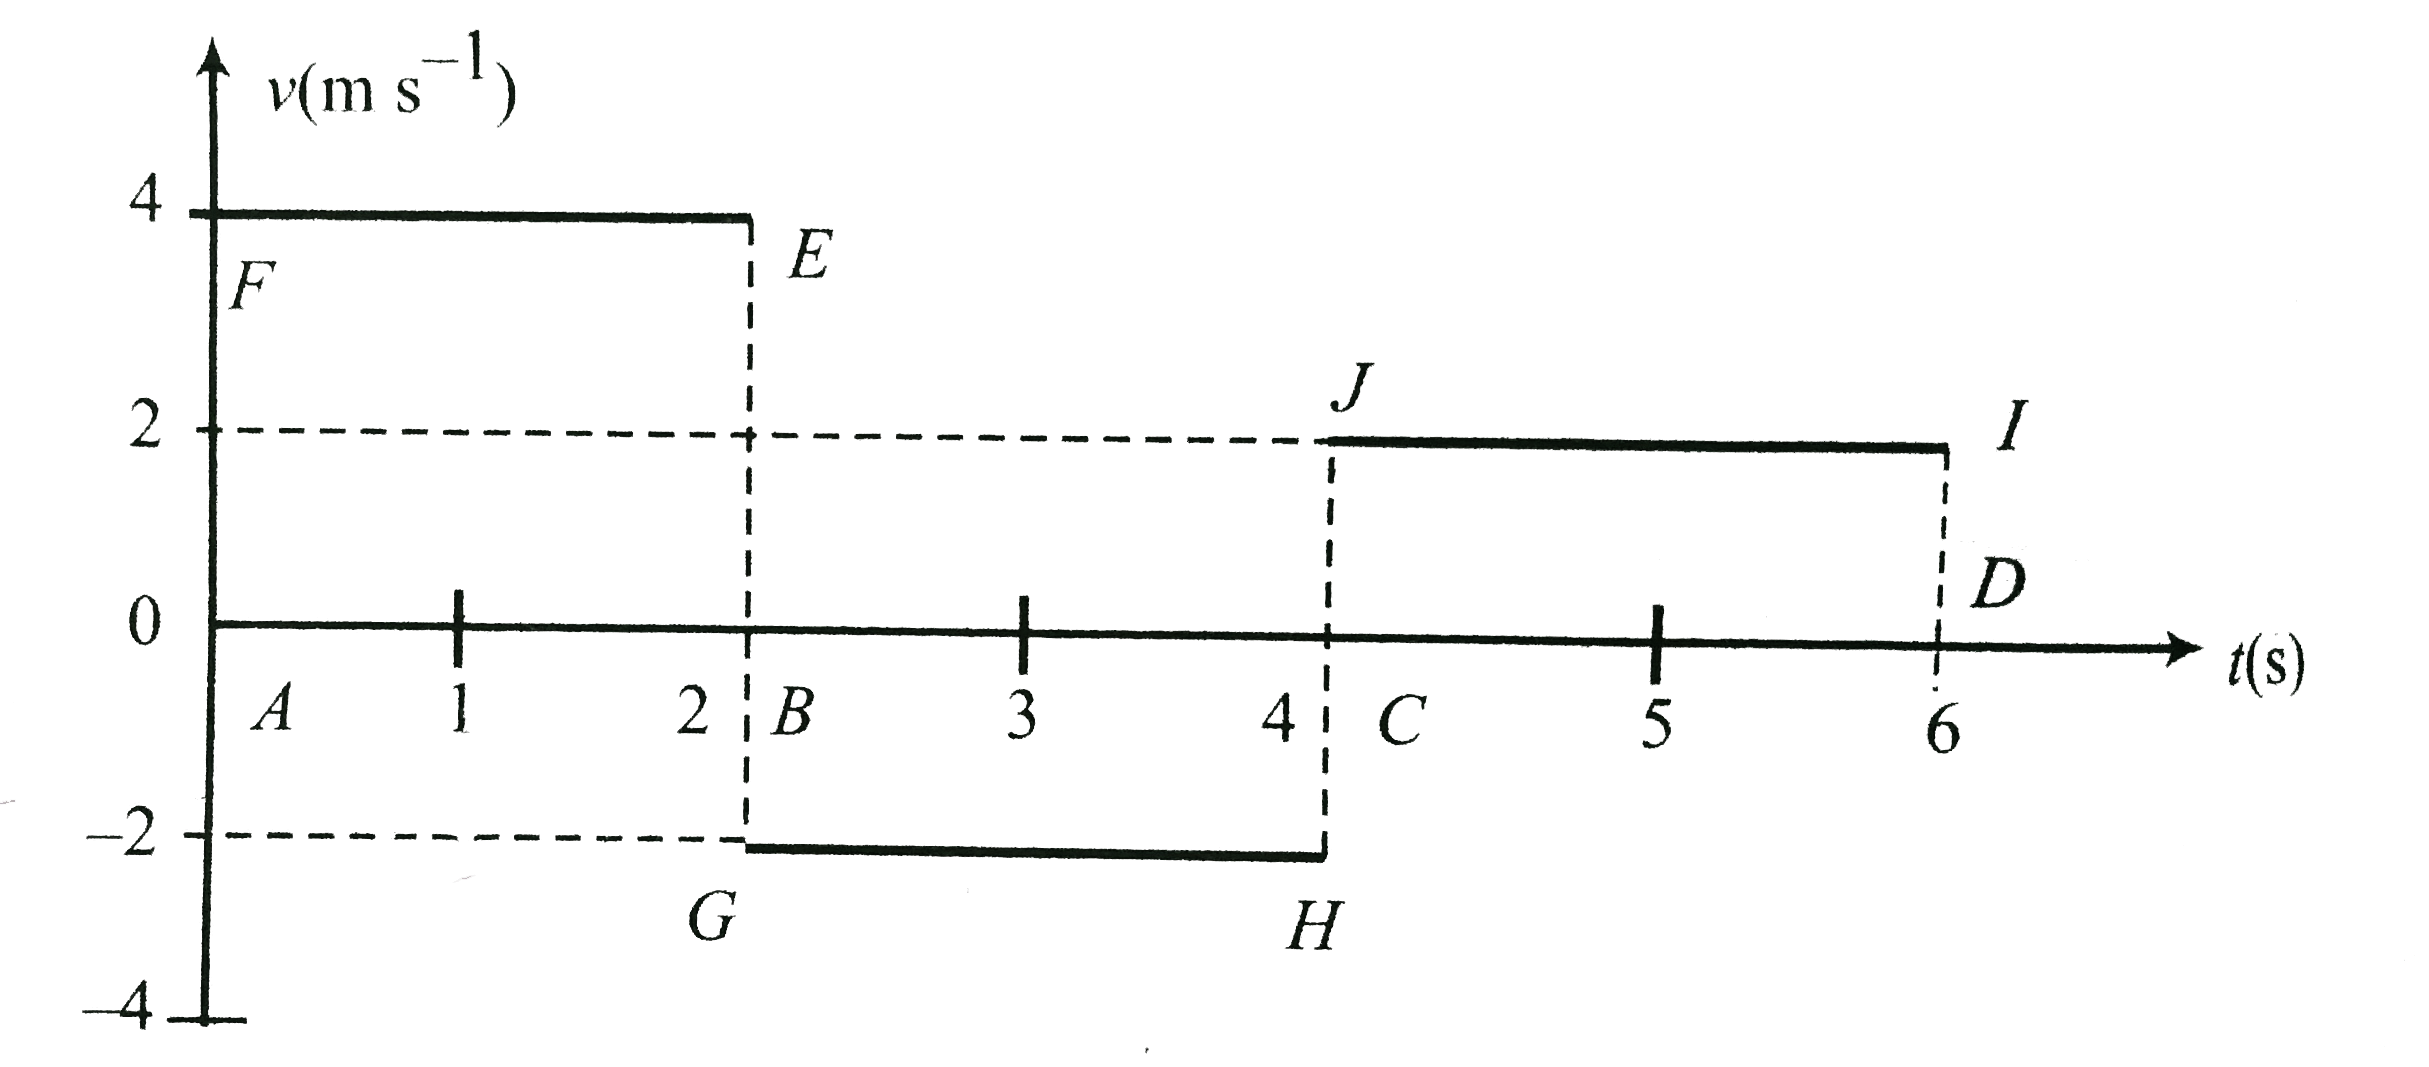
View SolutionThe velocity-time graph of a particle moving in a staight line is shown in the . Find the displacement and the distance trav elled by the particle in 6s.
 .
.
View SolutionA force-time graph for the motion of a body is shown in fig. change in linear momentum between 0 and 8 s is:-

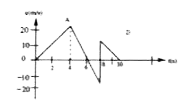
View SolutionThe velocity-time graph of a body moving in a straight line is shown in Fig. Find the displacement and distance travelled by the body in 10 sec.
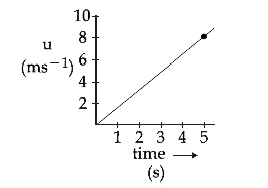
View SolutionThe speed verses time graph for a particle is shown in the figure. The distance travelled (in m) by the particle during the time interval t = 0 to t = 5 s will be __________
View Solution

