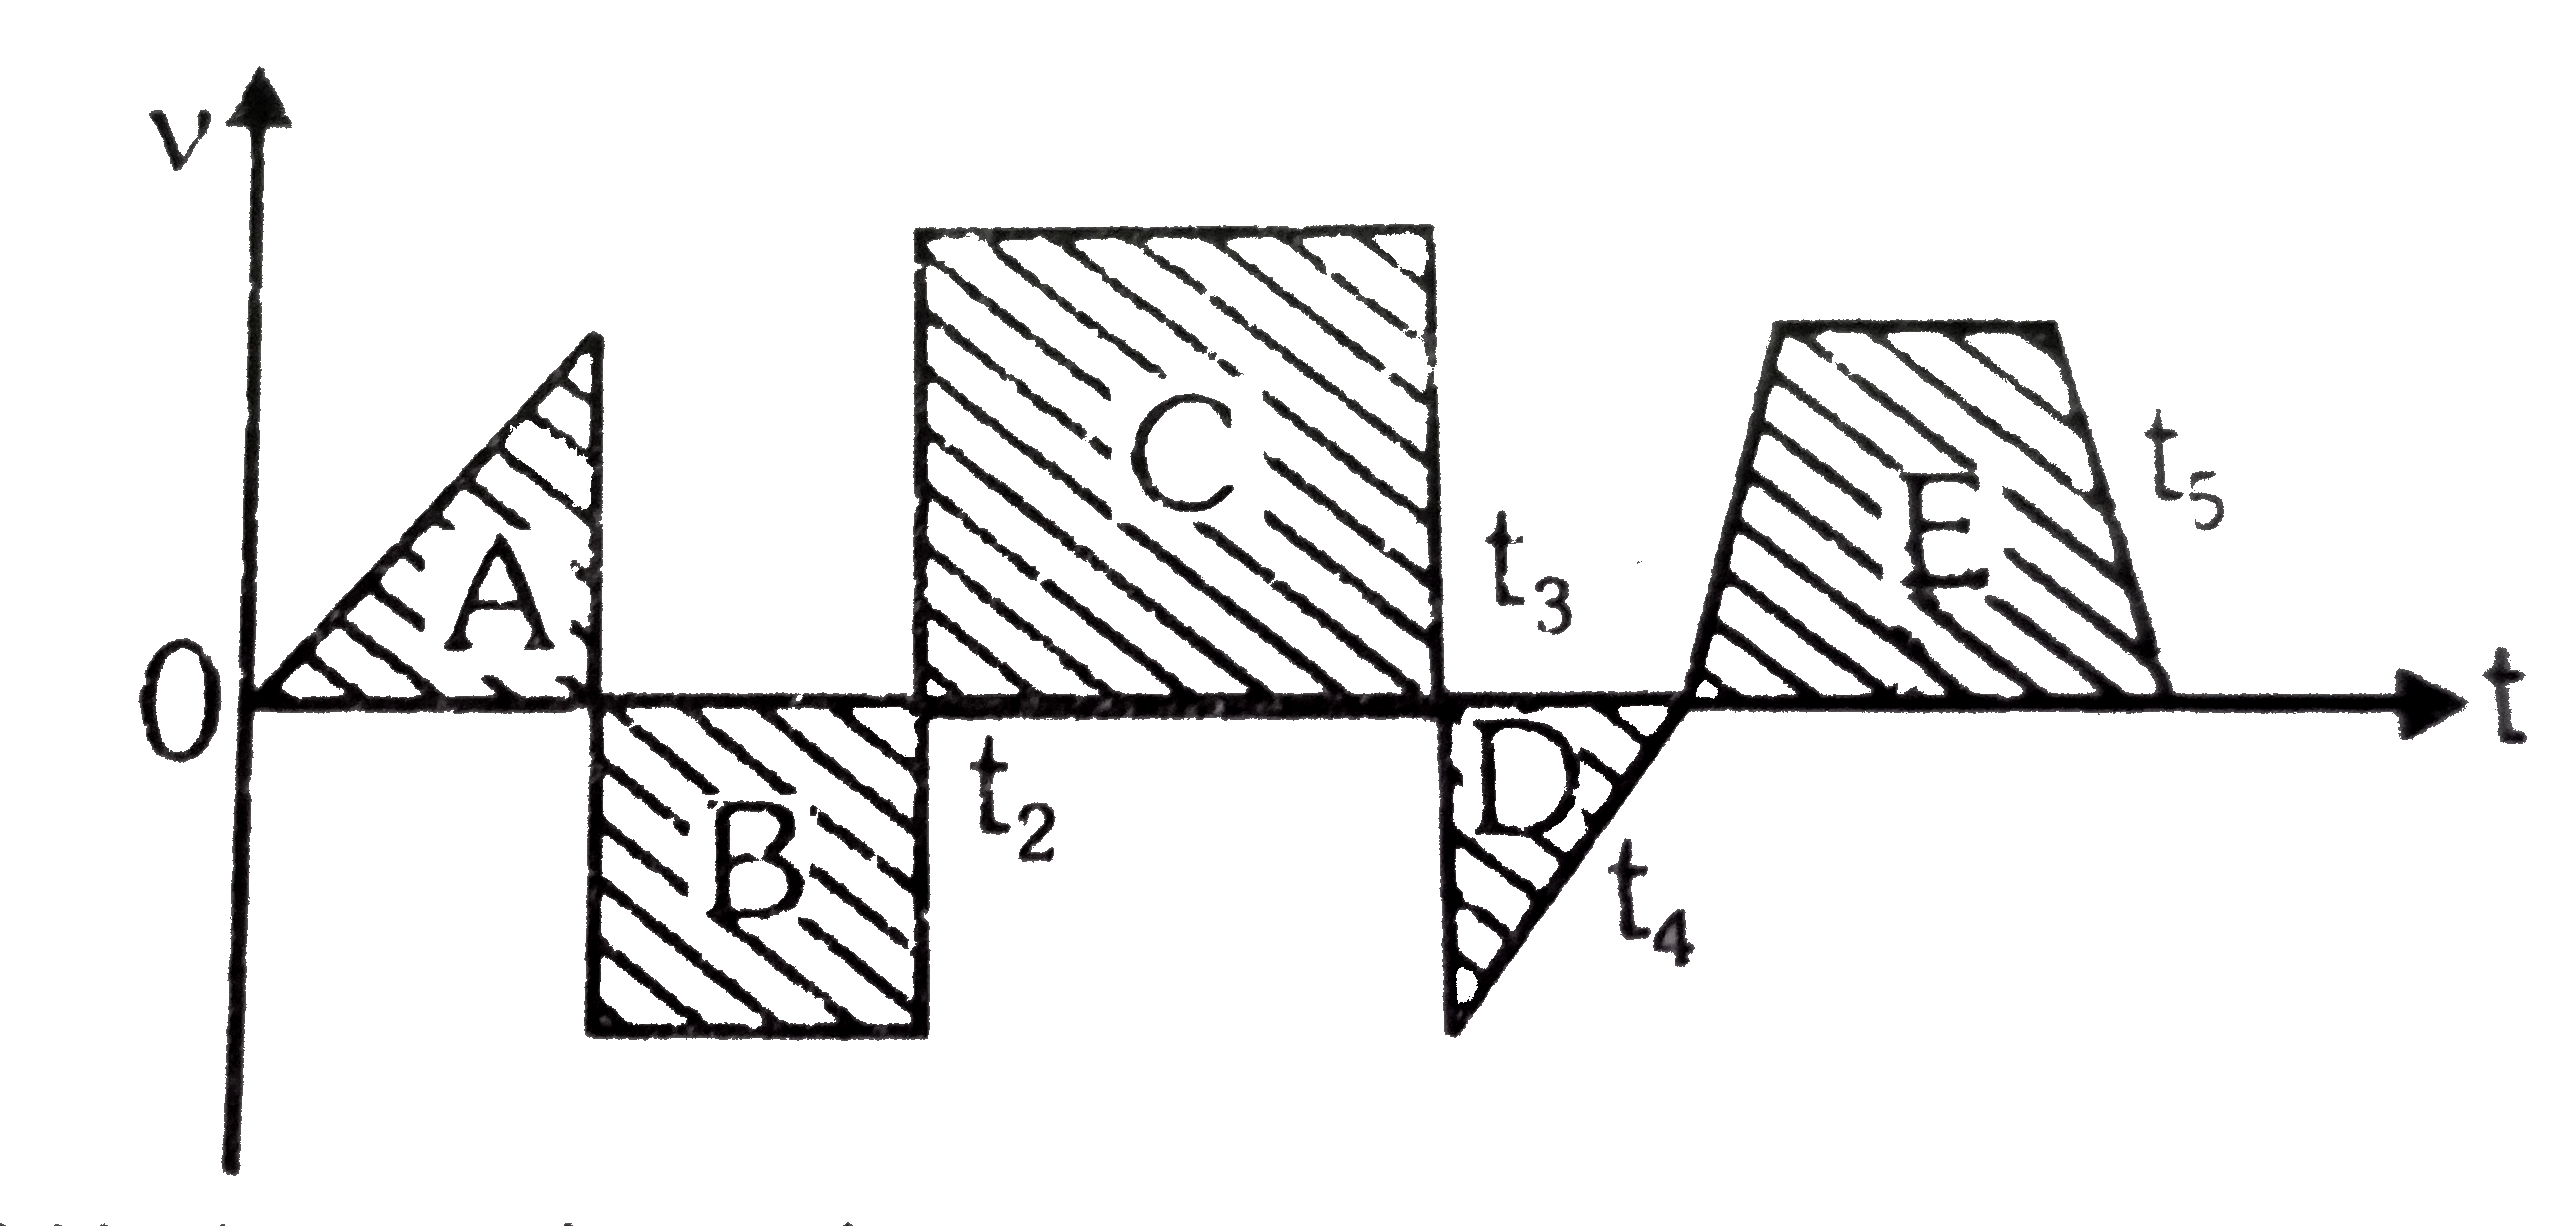
The velocity-time graph of an objects is as shown. The displacement during the interval 0 to t4 is
Statement-I is true, Statement-II is true, Statement-II is correct explanation for Statement-I
Statement-I is true, Statement-II is true, Statement-II is NOT a correct explanation for Statement-I
Statement-I is true, Statement-II is false
Statement-I is false, Statement-II is true.
The correct Answer is:C
Free fall implies that the particle moves only in presence of gravity.
Topper's Solved these Questions
- BOOK - ALLENCHAPTER - MOTION IN A PALNEEXERCISE - Comprehension#13videos
MOTION IN A PALNE
- BOOK - ALLENCHAPTER - MOTION IN A PALNEEXERCISE - Comprehension#25videos
MOTION IN A PALNE
- BOOK - ALLENCHAPTER - MOTION IN A PALNEEXERCISE - EXERCISE-036videos
MOTION IN A PALNE
- BOOK - ALLENCHAPTER - KINEMATICS-2DEXERCISE - Exercise (O-2)46videos
KINEMATICS-2D
- BOOK - ALLENCHAPTER - NEWTON'S LAWS OF MOTION & FRICTIONEXERCISE - EXERCISE (JA)4videos
NEWTON'S LAWS OF MOTION & FRICTION
Similar Questions
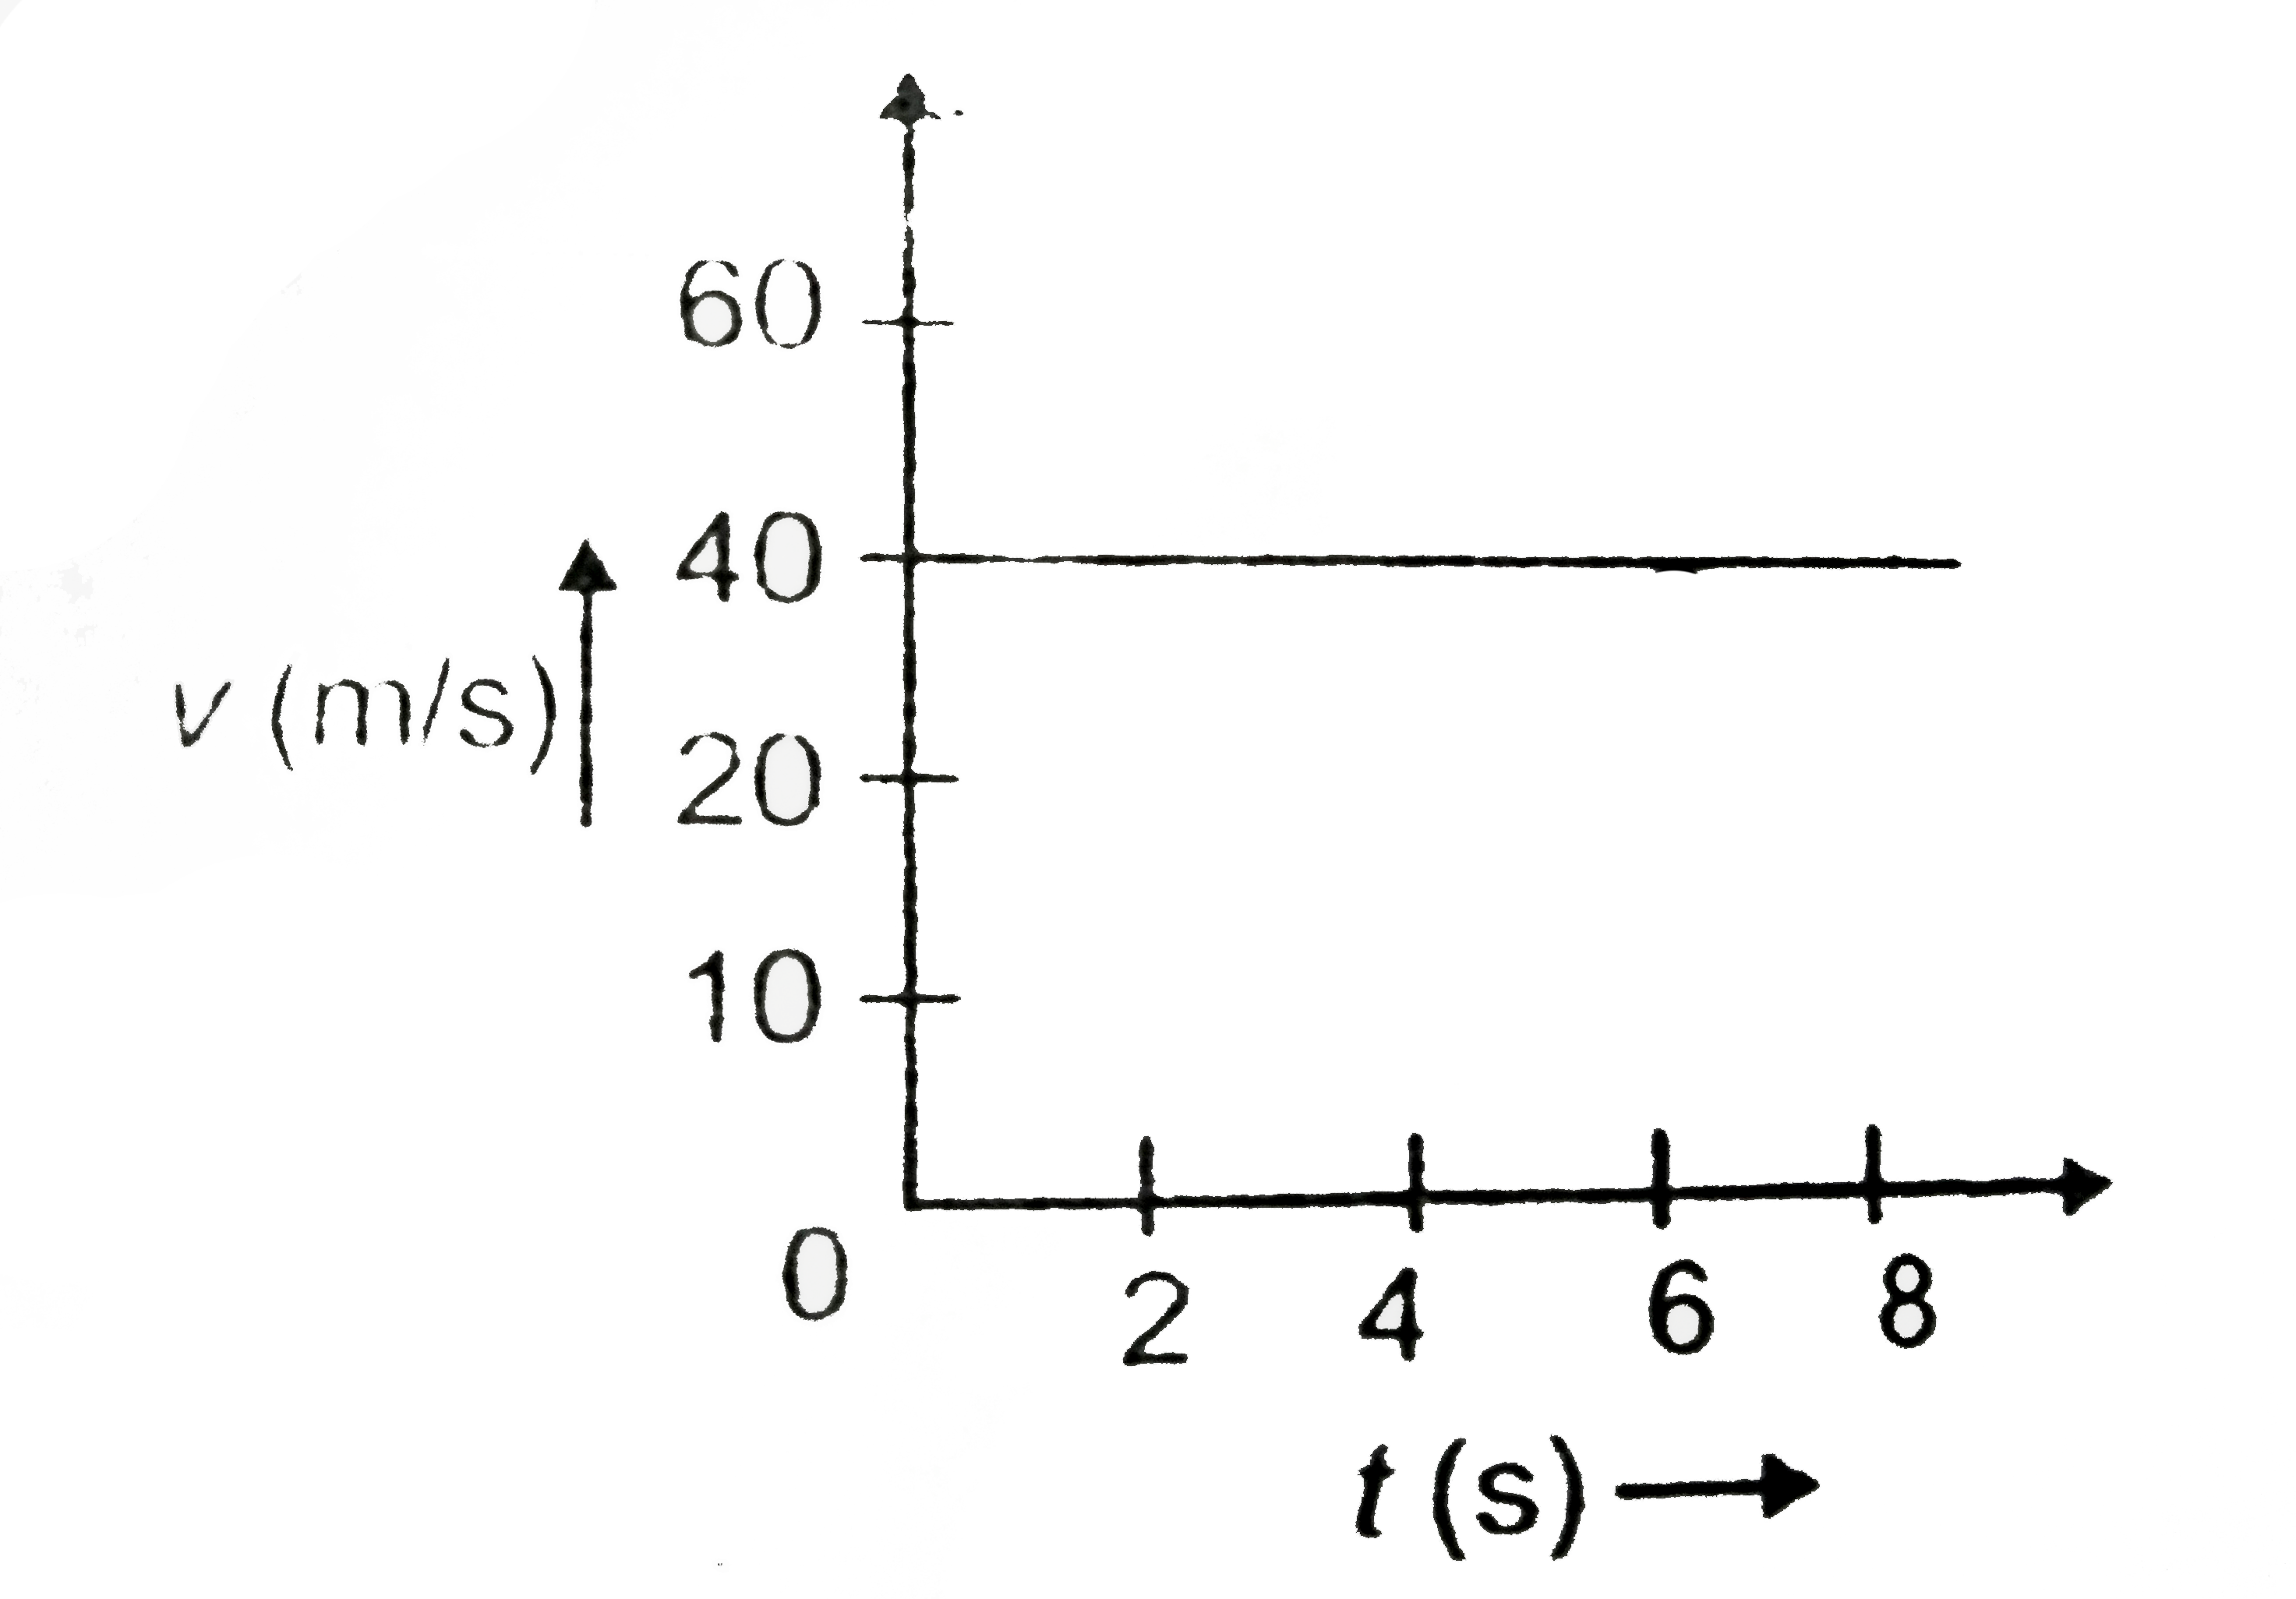
The velocity-time graph of an object is shown below. The acceleration of the object is
 View Solution
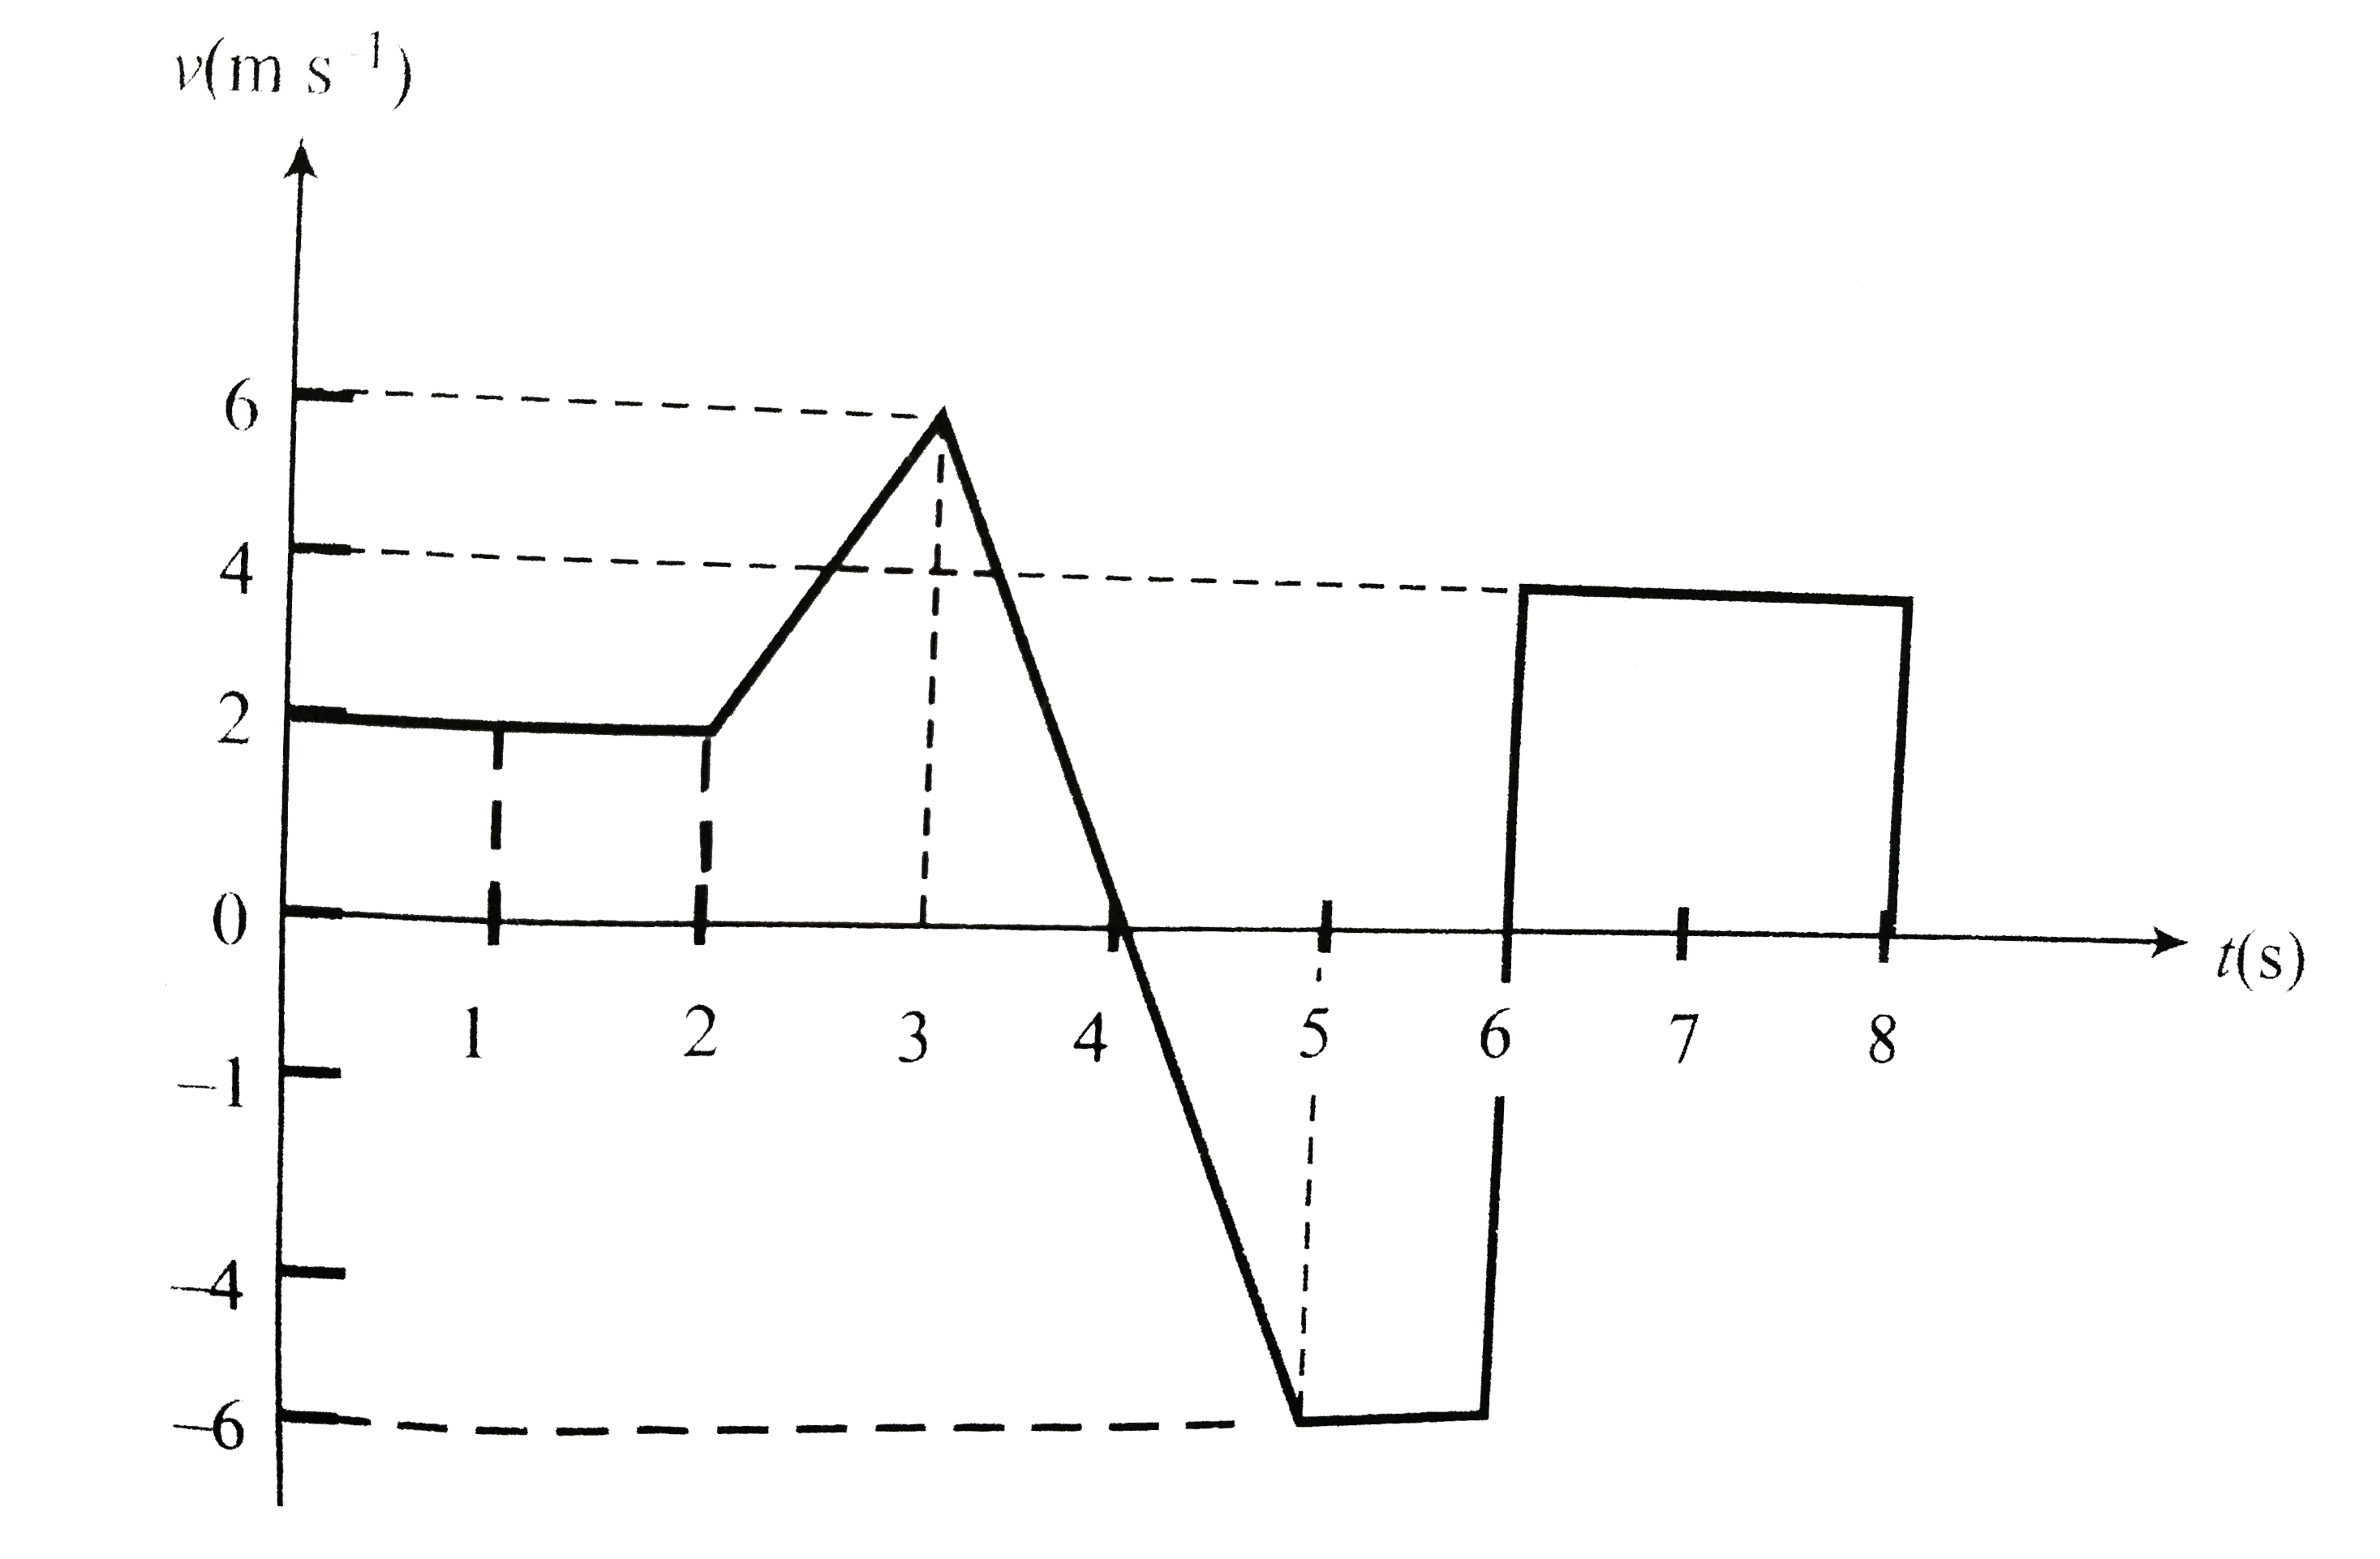
The velocity-time graph of a body is shown in .
The displacement of the body in 8s is.
 .View Solution
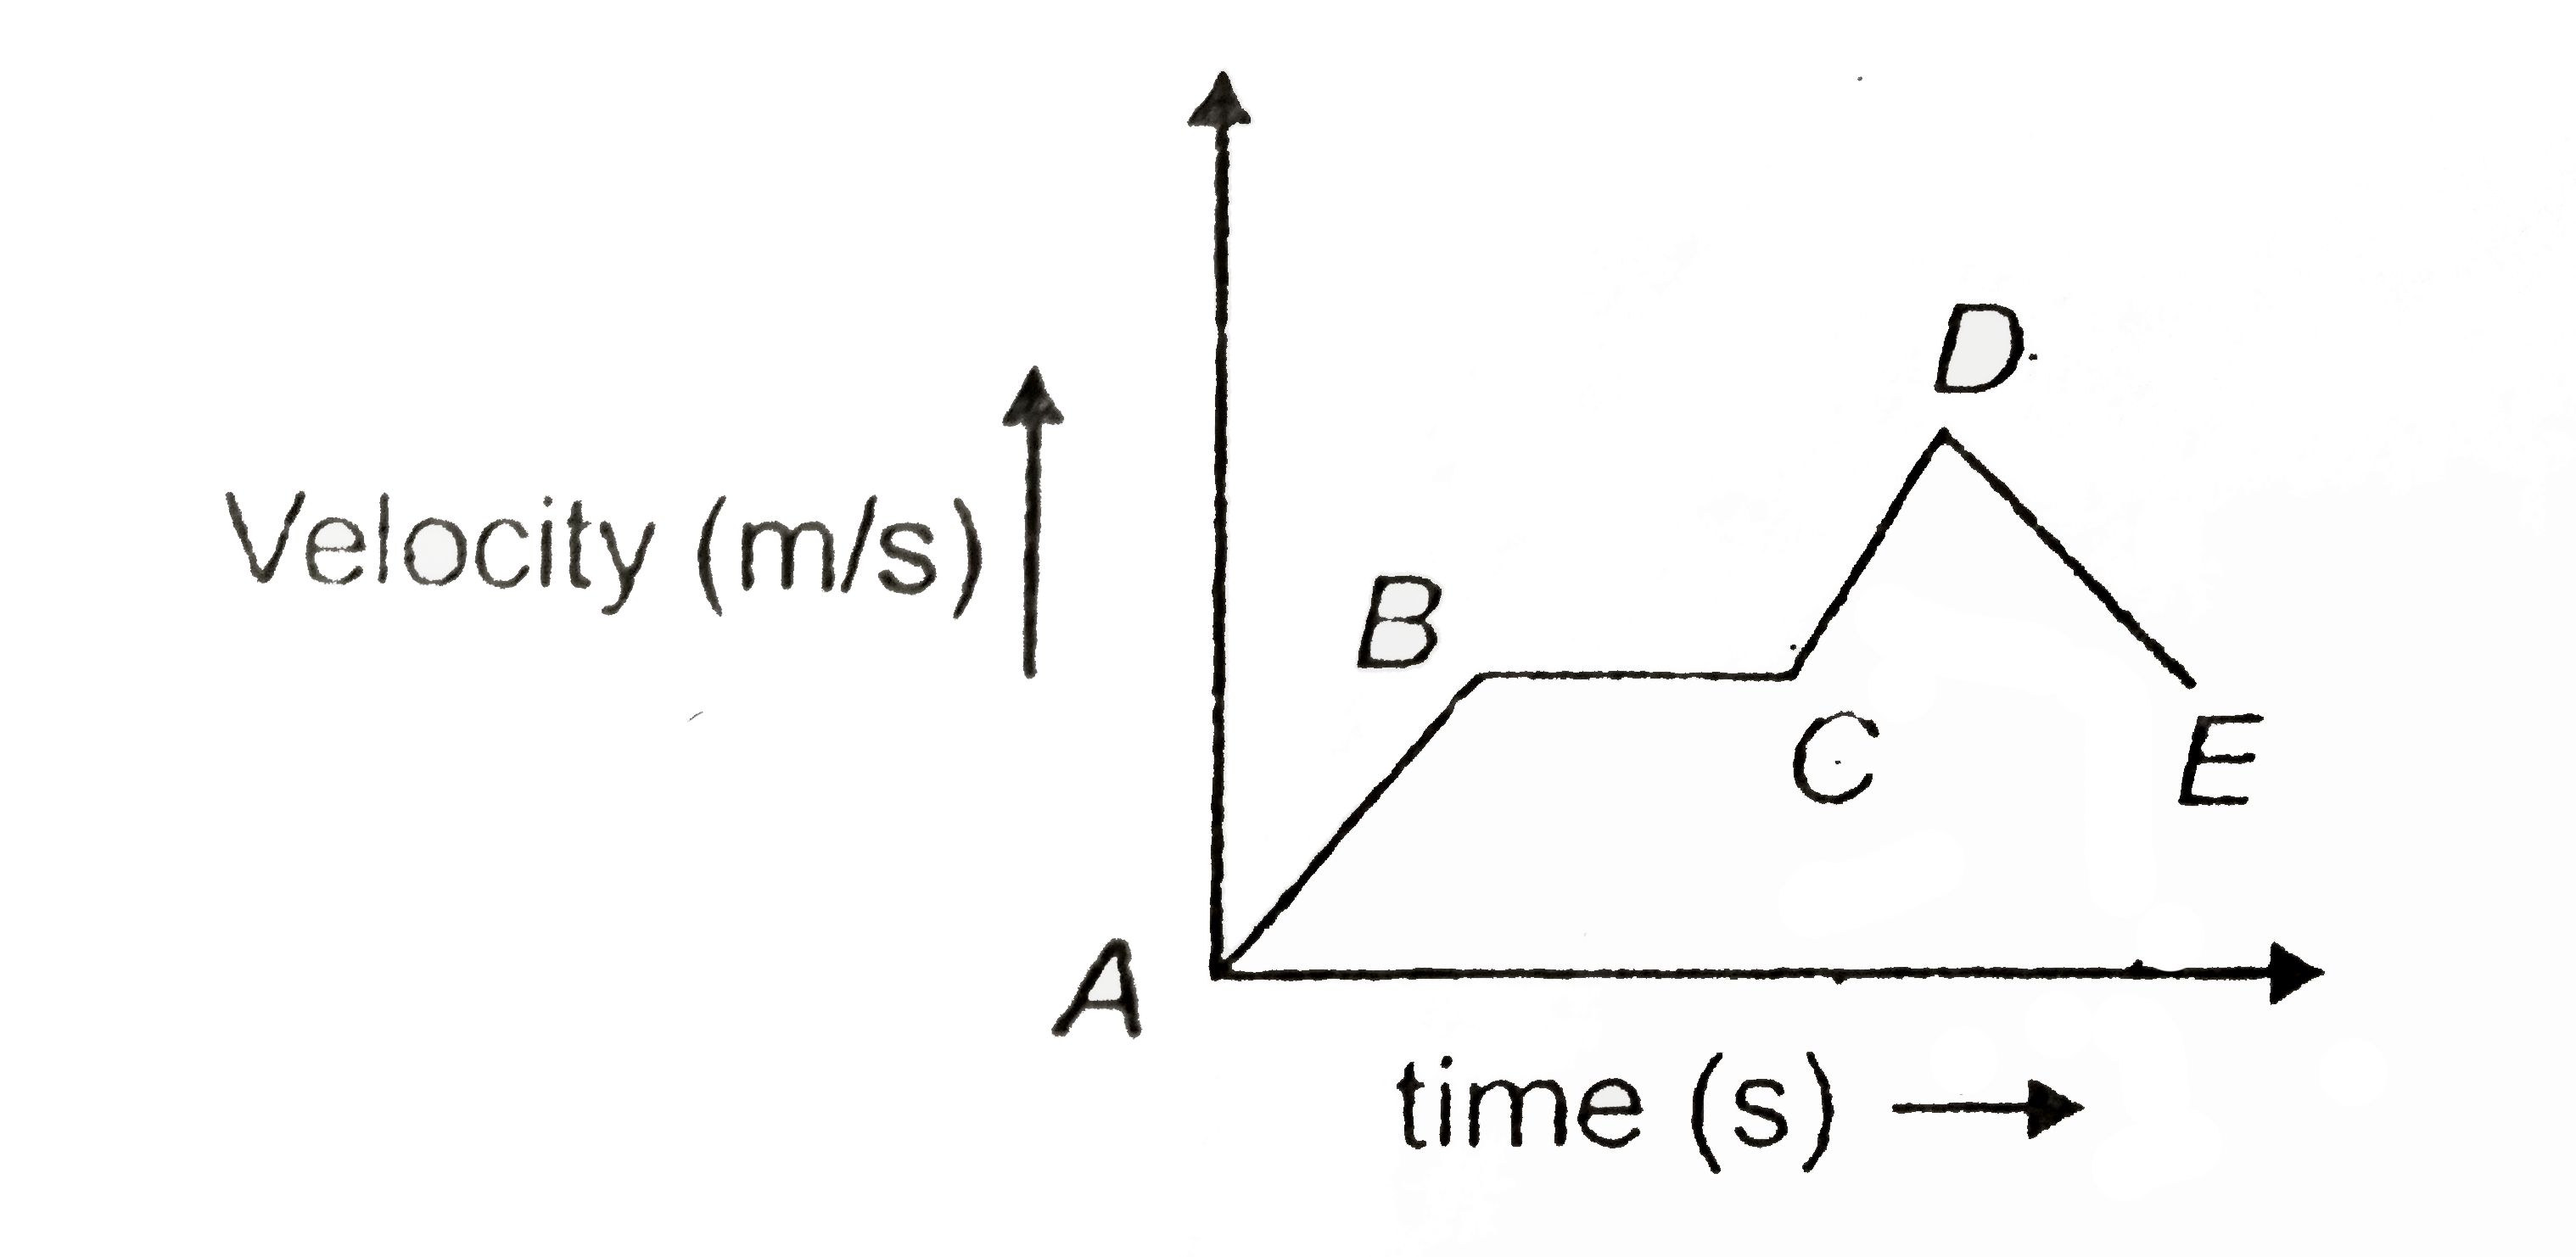
The velocity-time graph of an object is shown below. The part of the graph showing zero acceleration is
 View Solution
The velocity - time graph of a body is shown in fig. The ratio of the .....during the intervals OA and AB is _______
 View Solution
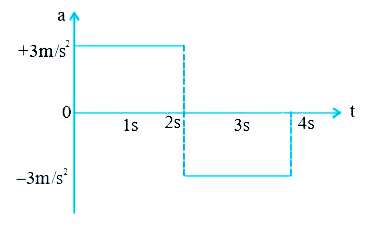
A particle starts from rest at t=0 and undergoes an acceleration as shown in figure.
Draw the velocity-time graph of the motion of the particle during the interval from zero to 4 second.
 View Solution
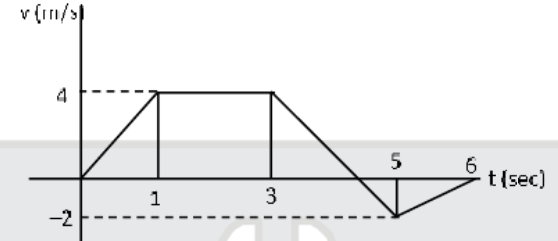
velocity time graph of a particle is shown in figure. Find displacement of the particle.
 View Solution
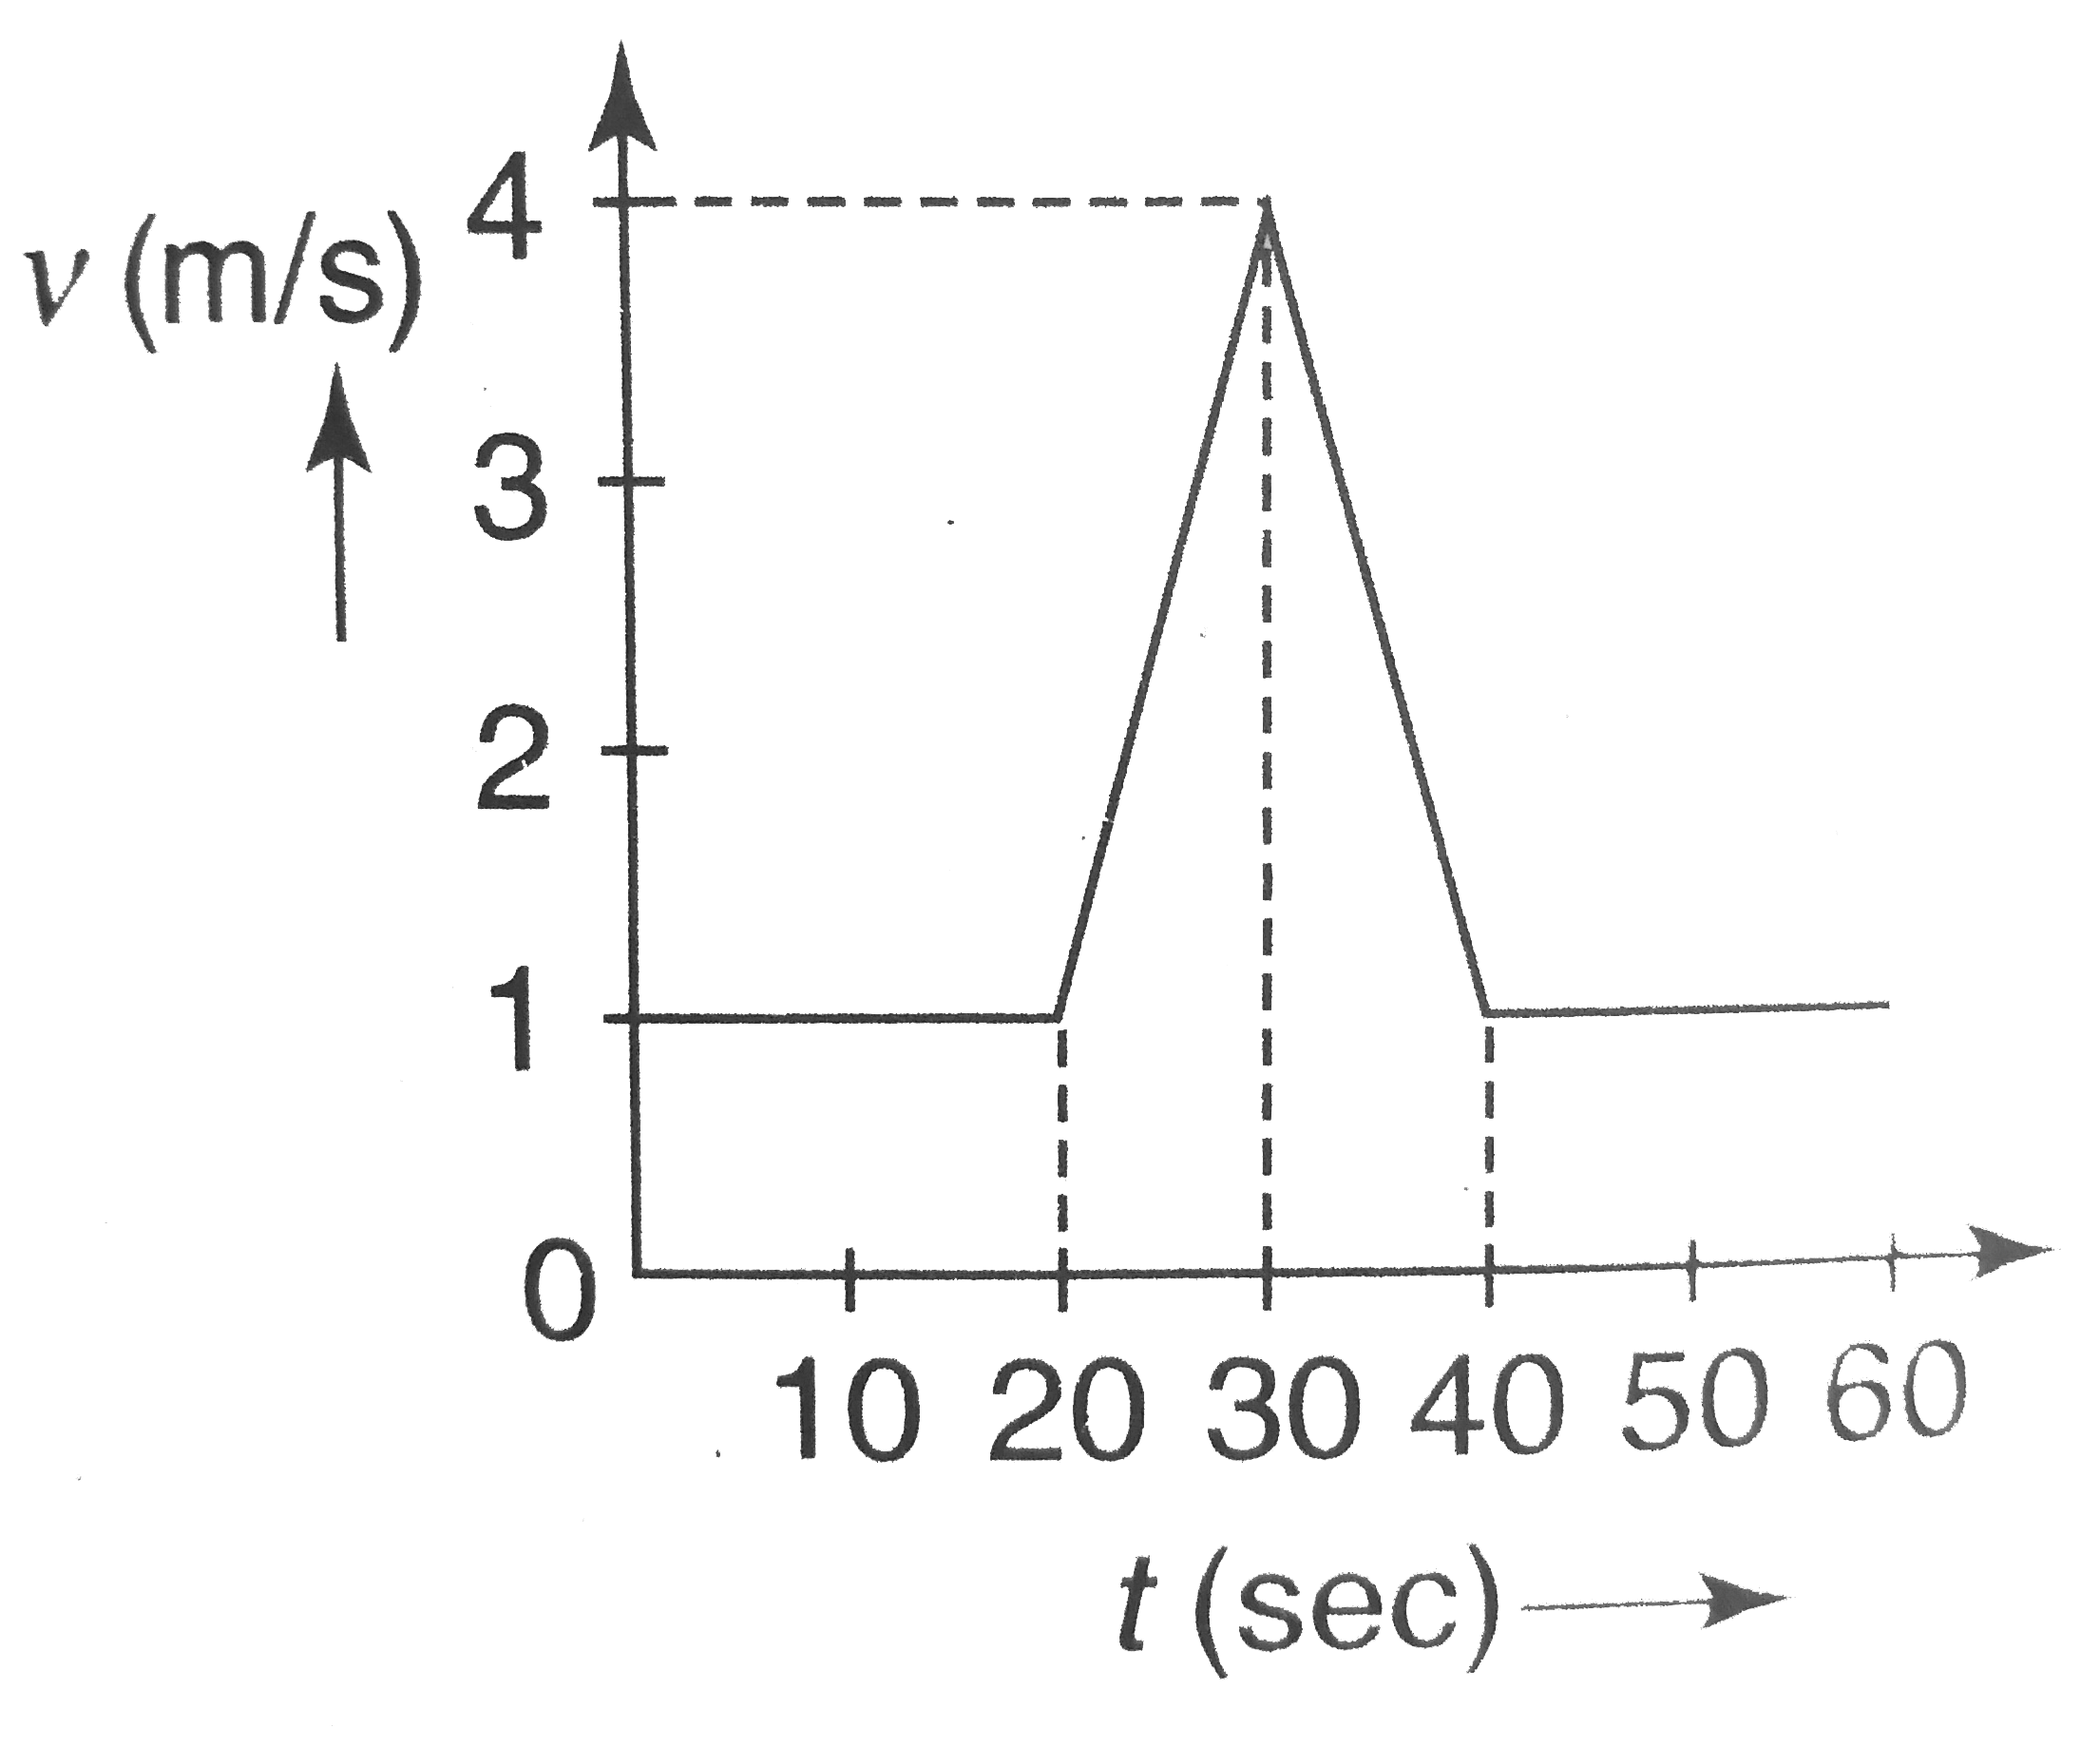
Velocity-time graph for a moving object is shown in the figure. Total displacement of the object during the time interval when there is non-zero acceleration and retardation is.
 View Solution
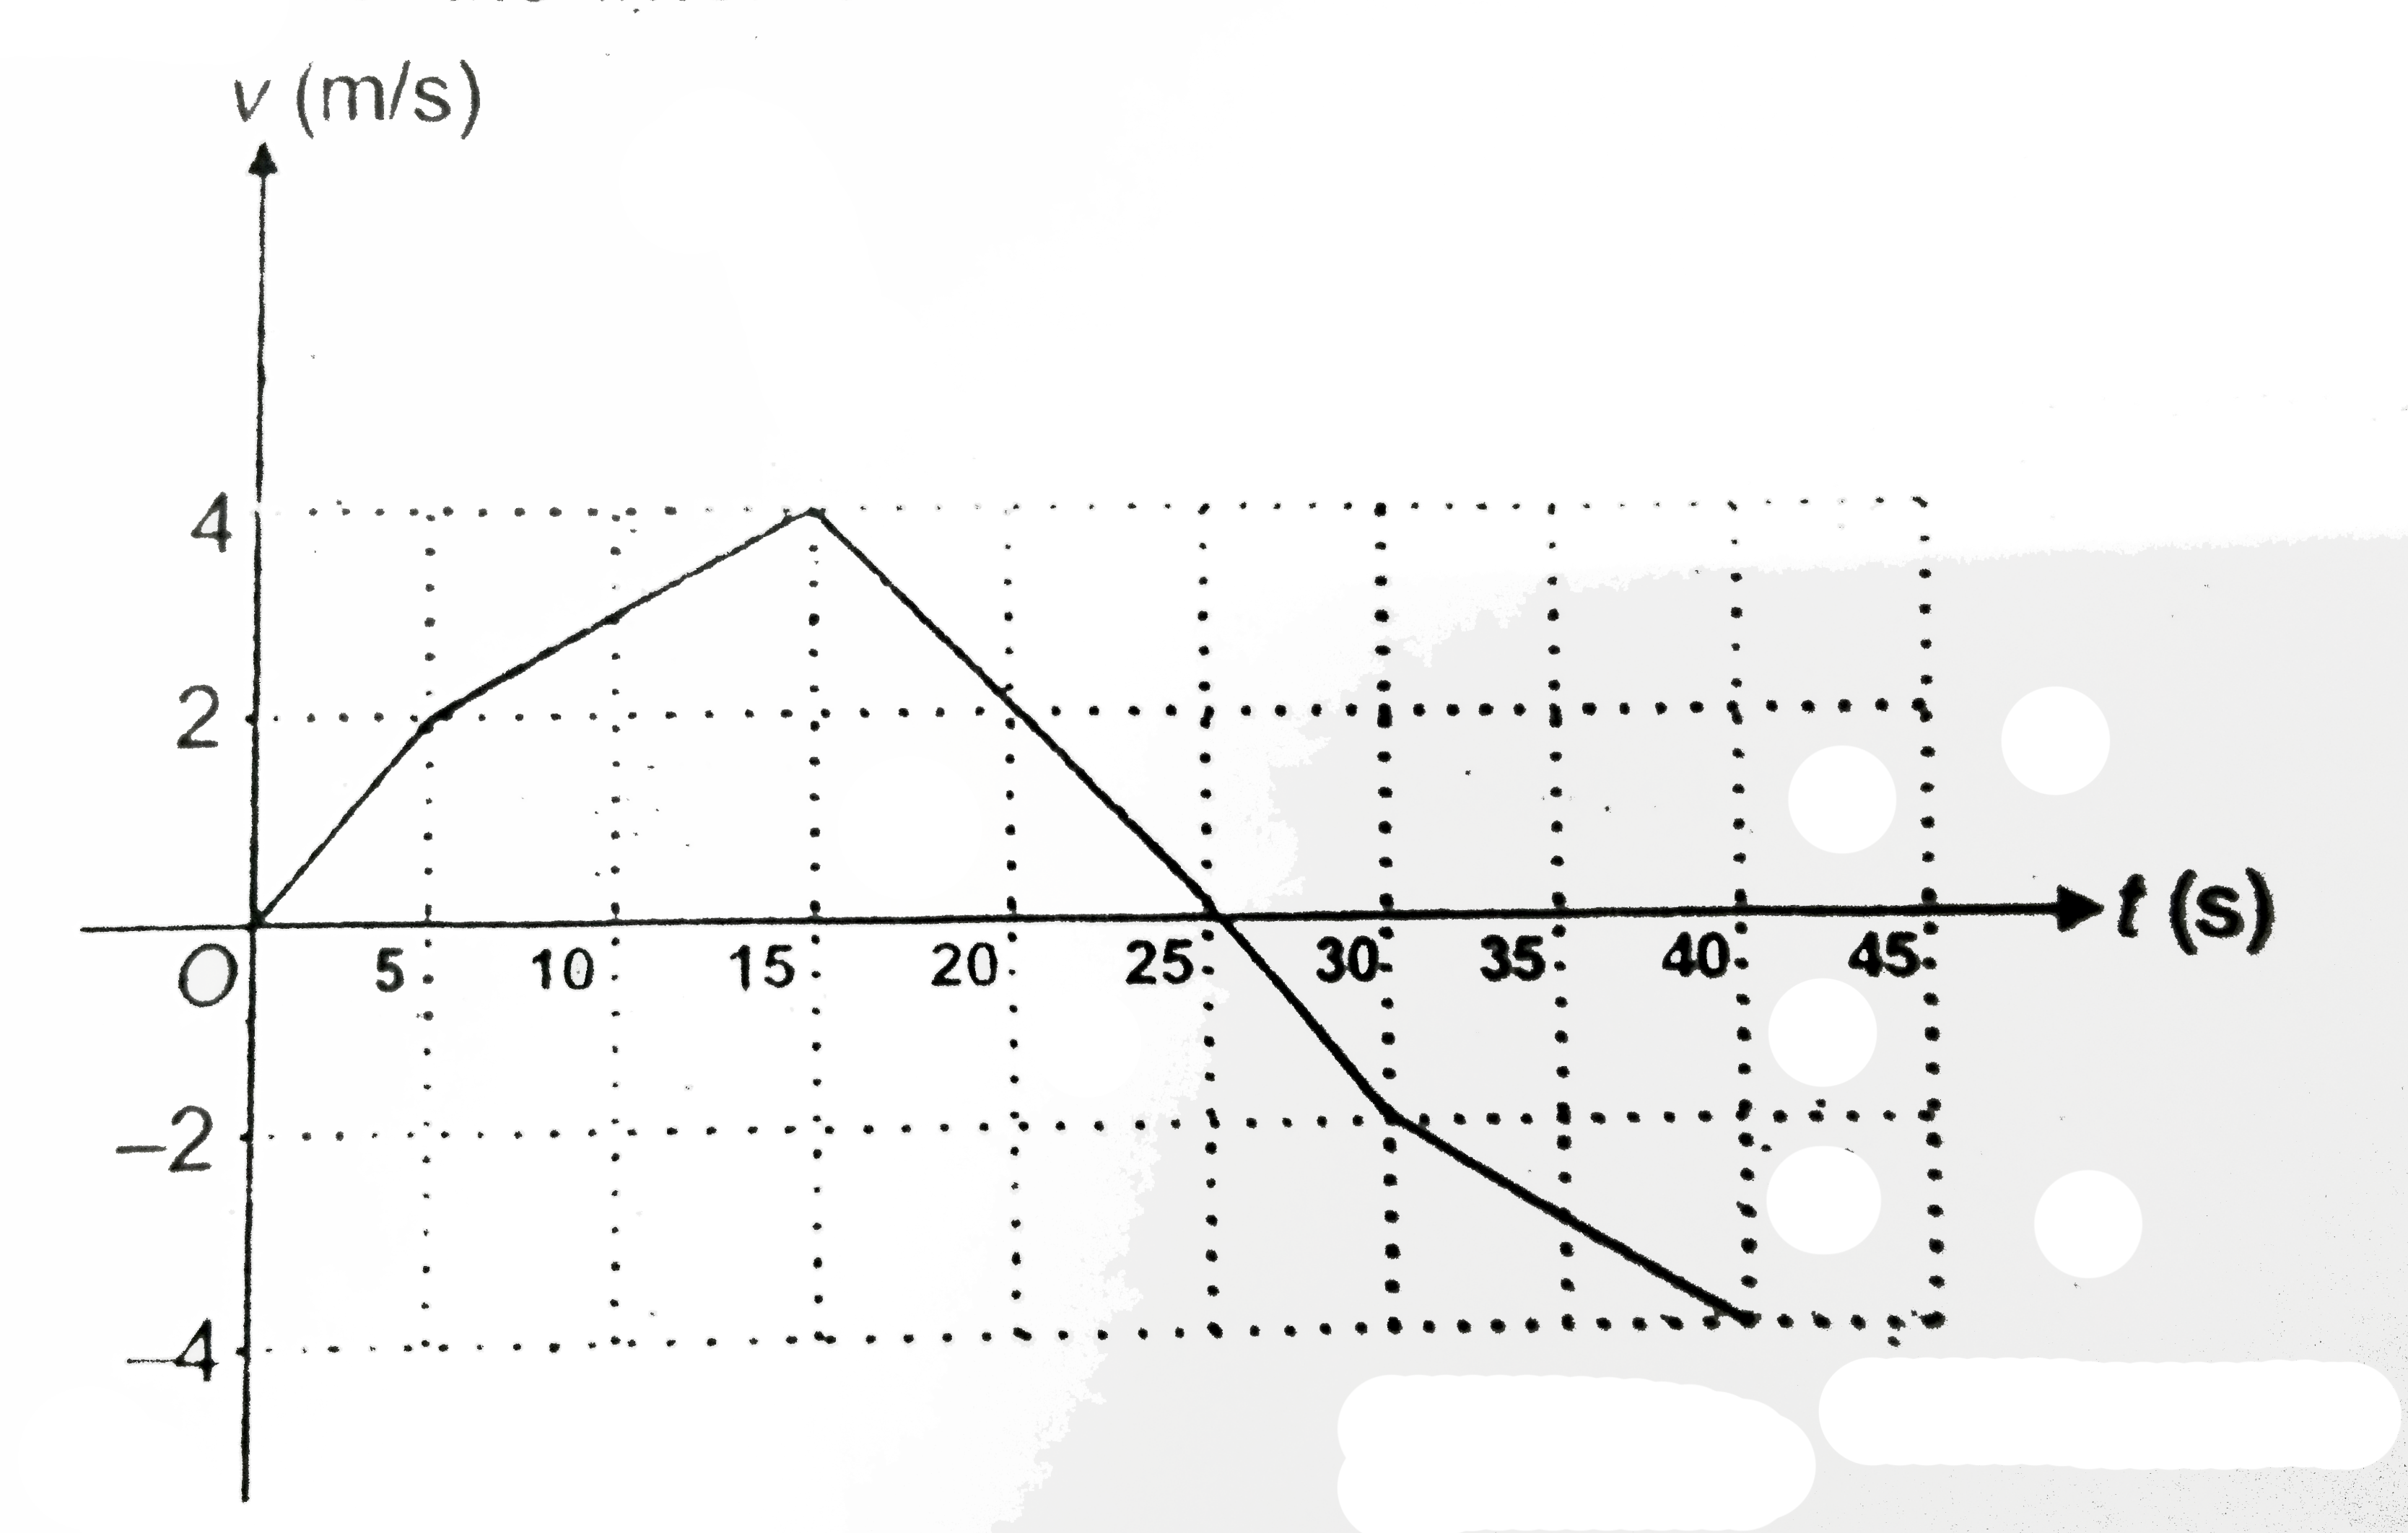
The velocity - time graph for linear motion of an object is as shown. Find
(a) The distance travelled and
(b) Displacement for the interval between 5 s and 40 s.
 View Solution
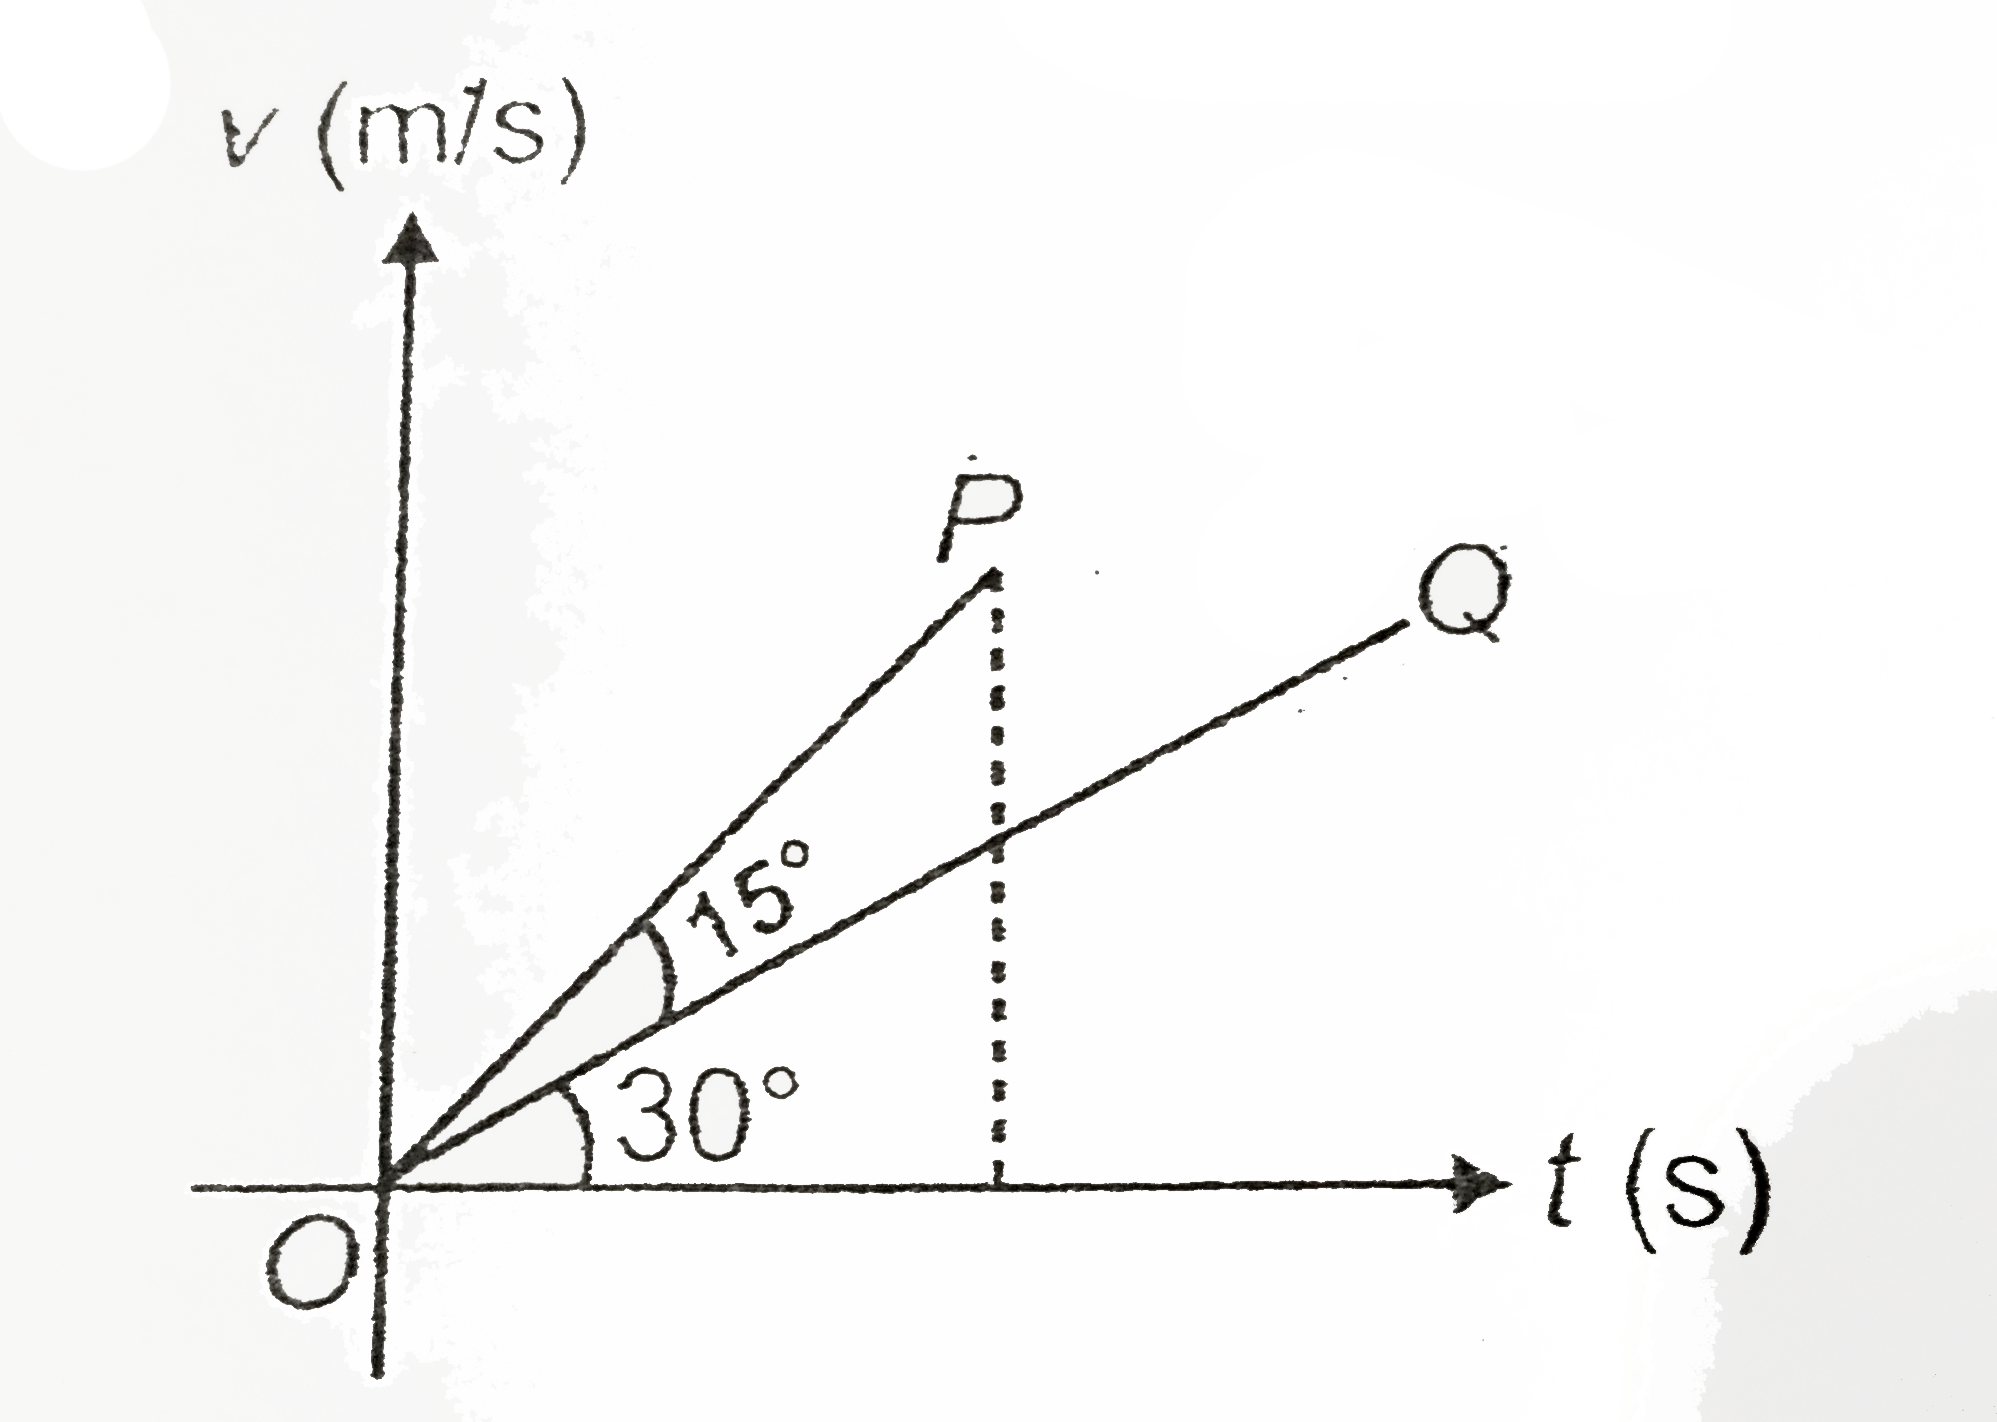
Graphs are very useful to represent a physical situation. Various quantities can be easily represented on graphs and other quantites can be determined from the graph. For example the slope of velocity-time graph represents instantaneous acceleration. For a motion with constant acceleration slope of velocity-time graph is constant. If acceleration is changing with time, slope with change and thus velocity-time graph will be a non-linear curve. Further the area of velocity-time graph gives displacement.
The velocity-time graph for two objects P and Q are shown. The ratio of their respective acceleration is
 View Solution
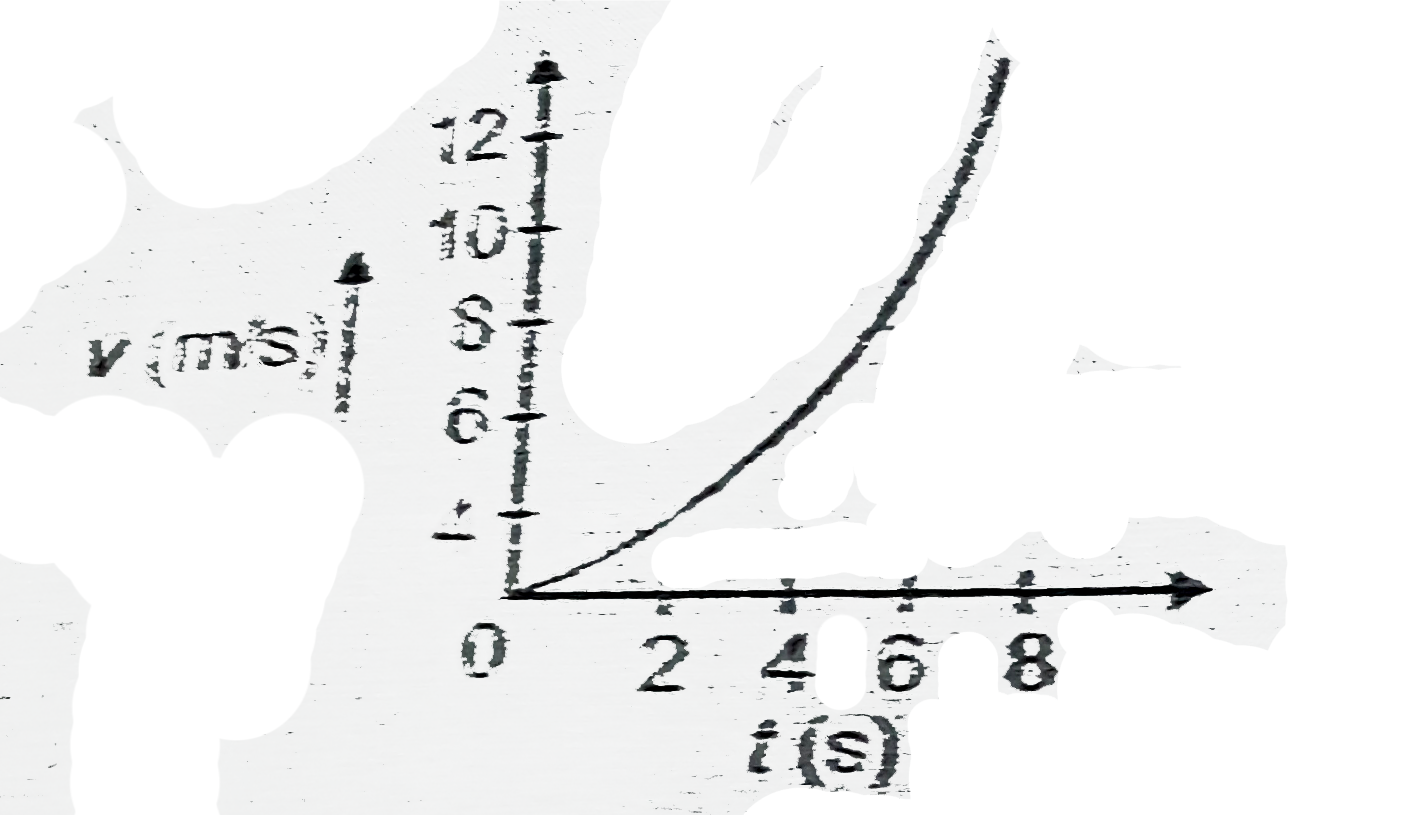
The velocity-time graph of an object is given below. Calculate the average acceleration of the object in the time interval of 4 s to 6 s.
 View Solution

