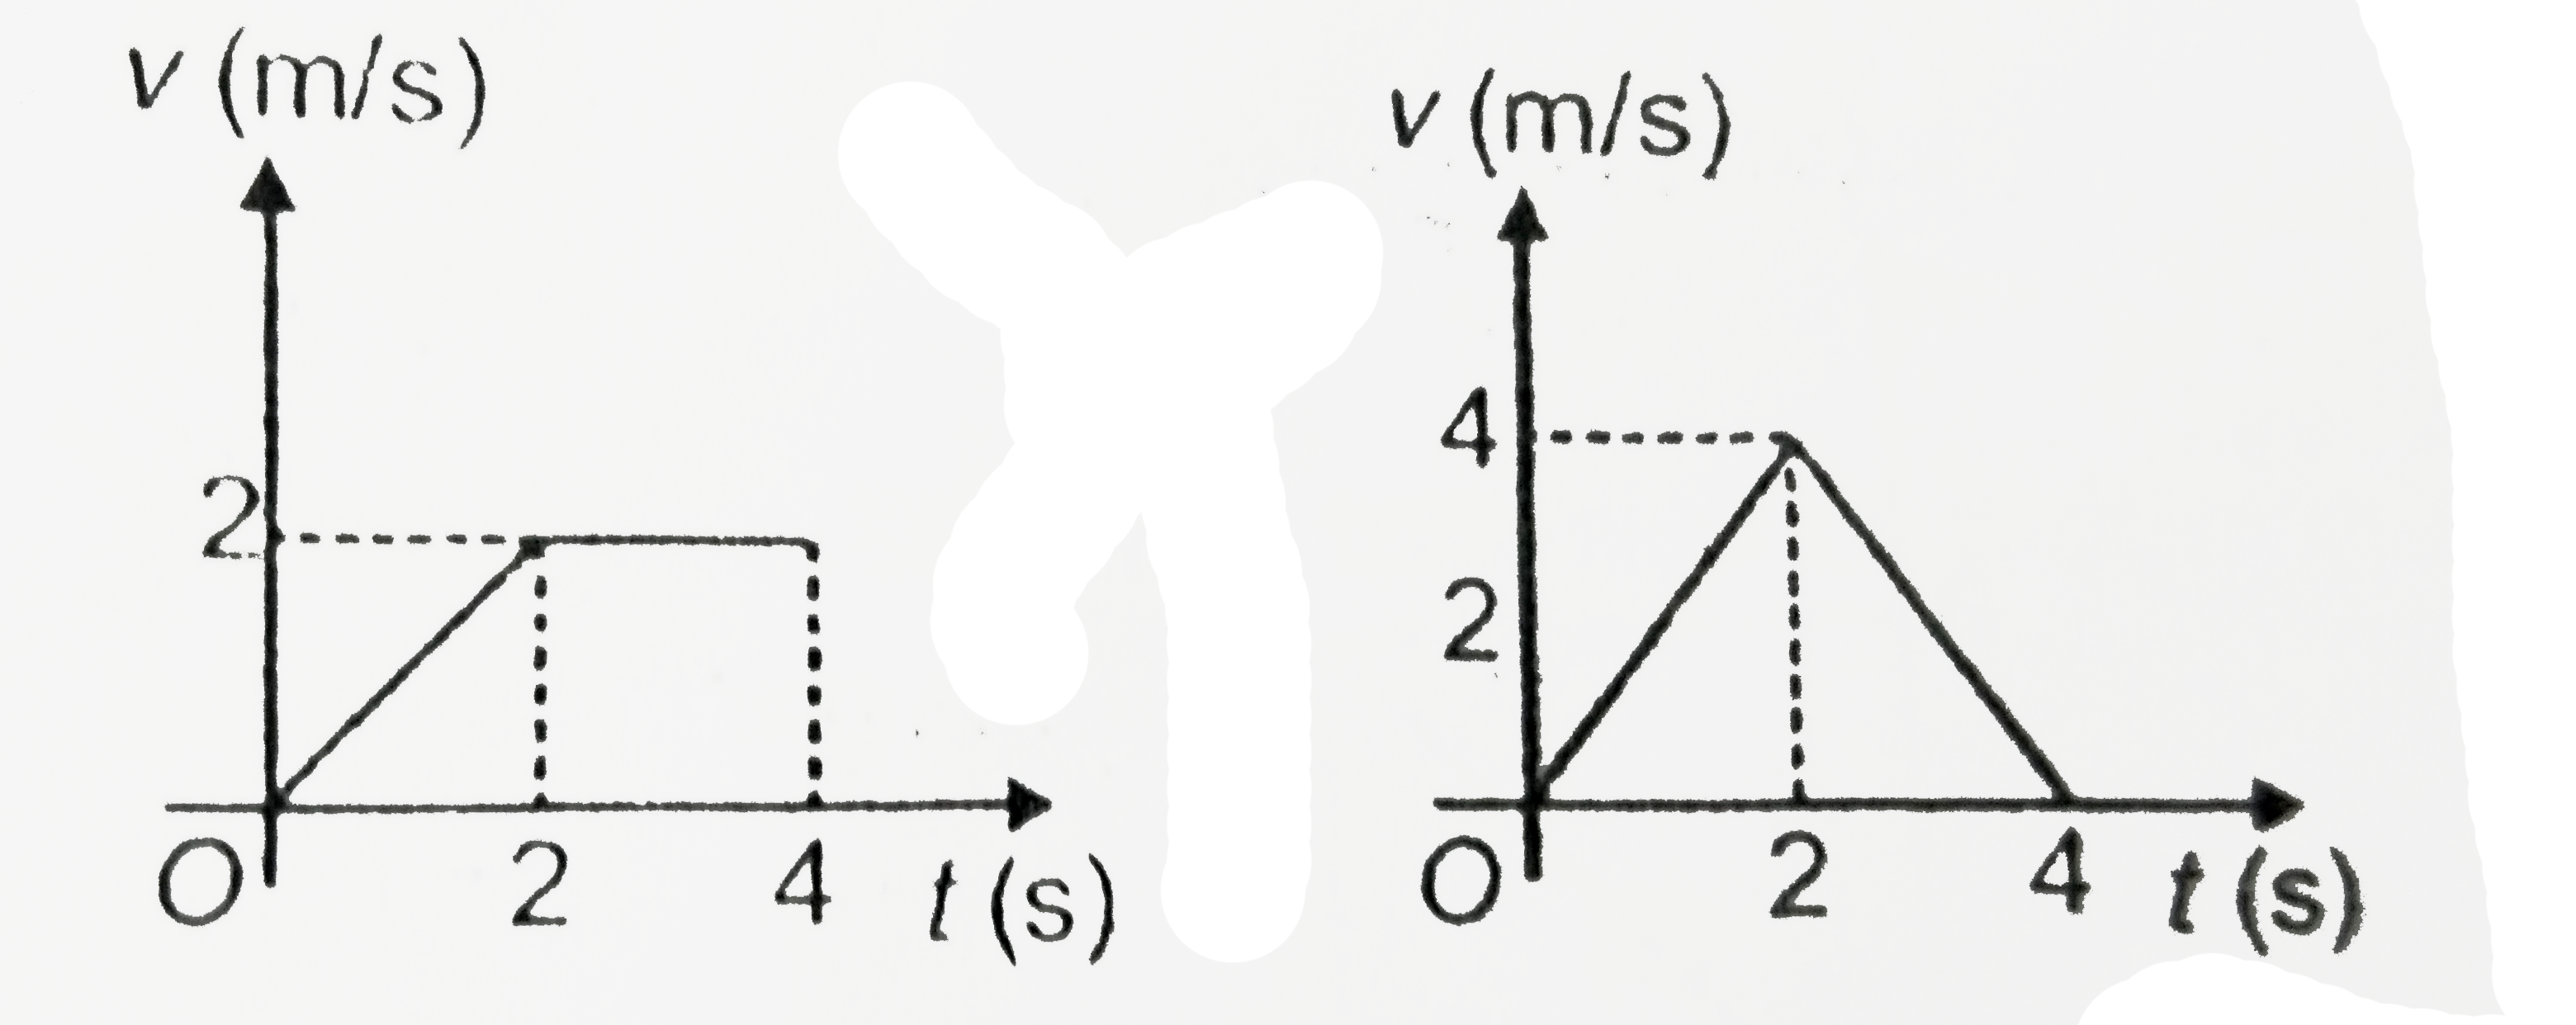
The velocity time graph for two particles (1 and 2) moving along X axis is shown in fig. At time t=0, both were at origin.
(a) During first 4 second of motion what is maximum separation between the particles? At what time the separation is maximum?
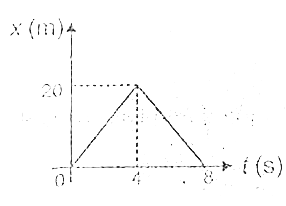
(b) Draw position (x) vs time (t) graph for the particles for the given interval.
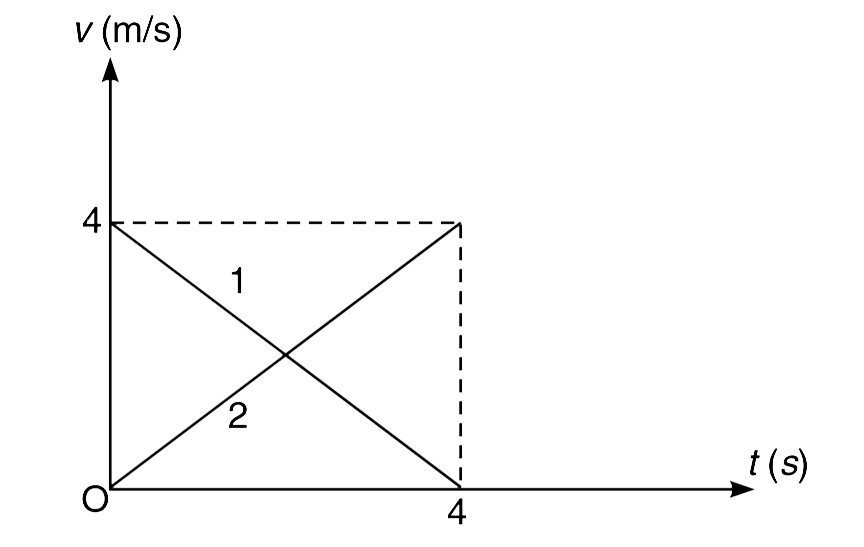
The correct Answer is:(a) Xmax=4m;t=2s
(b) (##IJAPHYV01C02E01006_A01##)
Step by step video, text & image solution for The velocity time graph for two particles (1 and 2) moving along X axis is shown in fig. At time t = 0, both were at origin. (a) During first 4 second of motion what is maximum separation between the particles? At what time the separation is maximum? (b) Draw position (x) vs time (t) graph for the particles for the given interval. by Physics experts to help you in doubts & scoring excellent marks in Class 11 exams.
Topper's Solved these Questions
- BOOK - ARIHANTCHAPTER - KINEMATICSEXERCISE - Level 258videos
KINEMATICS
- BOOK - ARIHANTCHAPTER - KINEMATICSEXERCISE - Level 333videos
KINEMATICS
- BOOK - ARIHANTCHAPTER - HEAT TRANSFEREXERCISE - Heat Transfer45videos
HEAT TRANSFER
- BOOK - ARIHANTCHAPTER - KINETIC THEORY OF GASESEXERCISE - Level 34videos
KINETIC THEORY OF GASES
Similar Questions
Knowledge Check
- Question 1 - Select One or More
Velocity time graphs of particles A and B moving along x-axis are shown here. Both A and B start from origin:
 AMaximum separation between the particles is 8mBMaximum separation between the particles is 10mCMaximum separation between the particles occurs at t=6sDMaximum separation between the particles occurs at t=8s
 - Question 2 - Select One
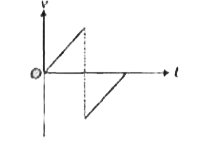
The velocity (v) - time (t) graph for a particle moving along x - axis is shown in the figure. The corresponding position (x) - time (t) is best represented by
 A
A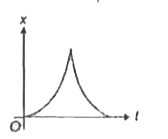 B
B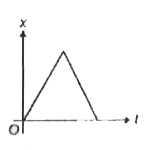 C
C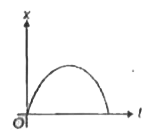 D
D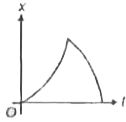
- Question 3 - Select One
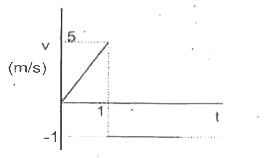
The velocity time graph for a particle moving along X-axis is shown in the figure. The corresponding displacement time graph is correctly shown by
 A
A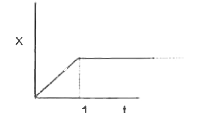 B
B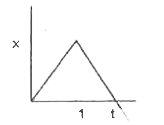 C
C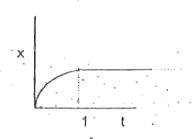 D
D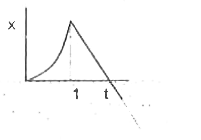
Position (x) versus time (t) graph of a particle is as shown. The velocity is zero at?
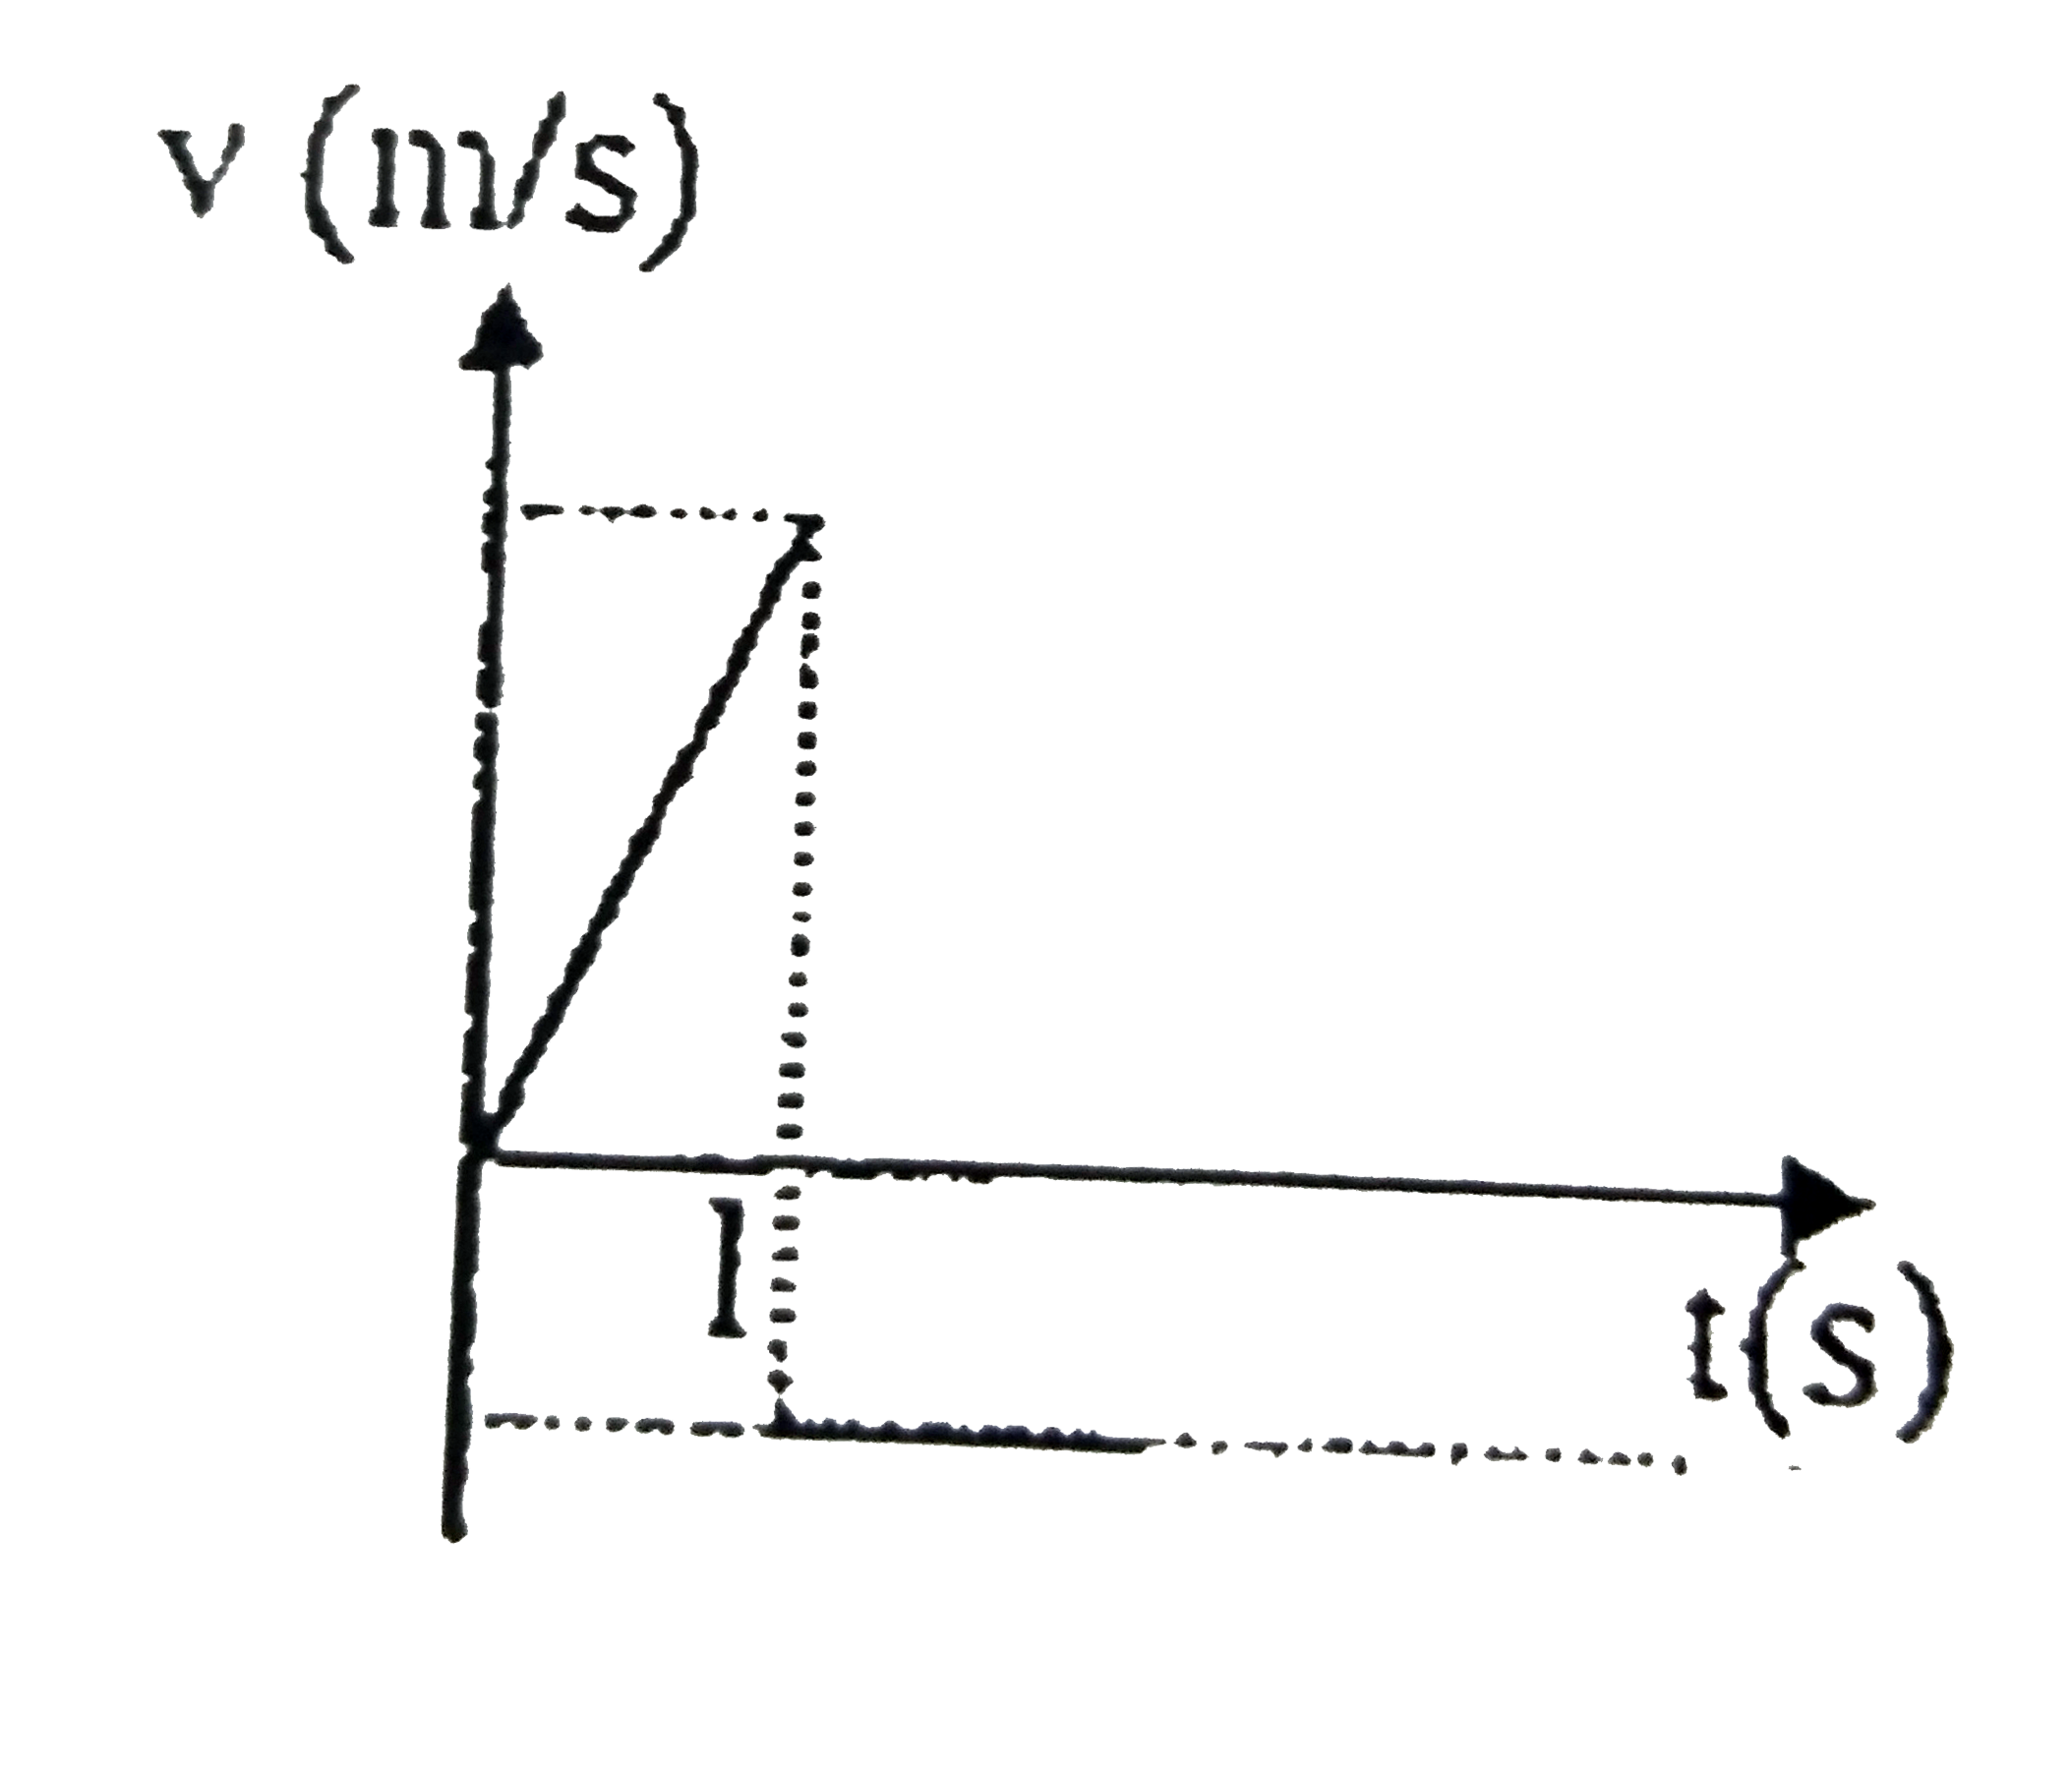
View SolutionThe velocity time graph for a particle moving along x-axis is shown in the figure. The corresponding displacement time graph is correctly shown by
 View Solution
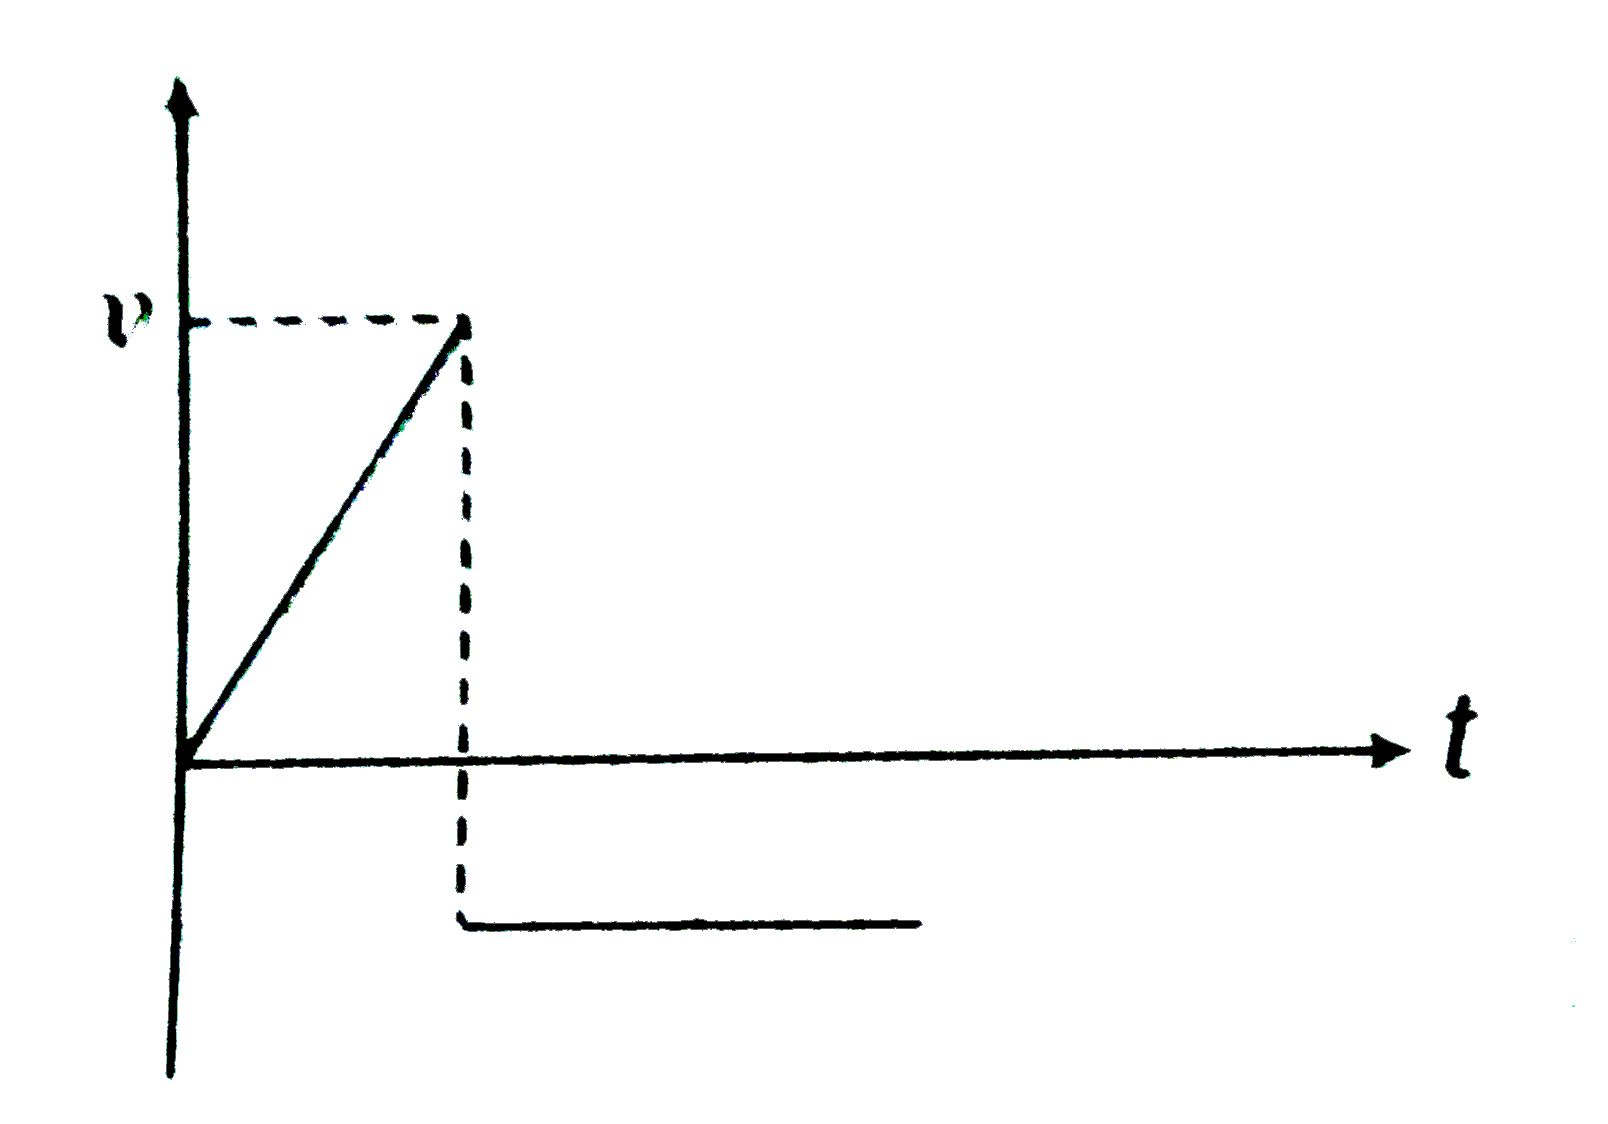
The velocity-time graph for a particle moving along X-axis is shown in the figure. The corresponding displacement-time graph is correctly shown by
 View Solution
Two particles A and B start from the origin along x-axis. Velocity time graph of both particles are shown in the figure. During the given time interval, the maximum separation between the particles is
 View Solution
The velocity - time graph of a particle moving along a straight line is shown in the figure given below
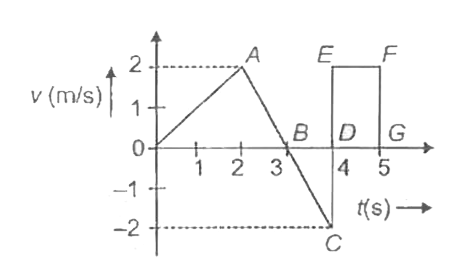
The displacement of the particle in 5 second isView Solution


