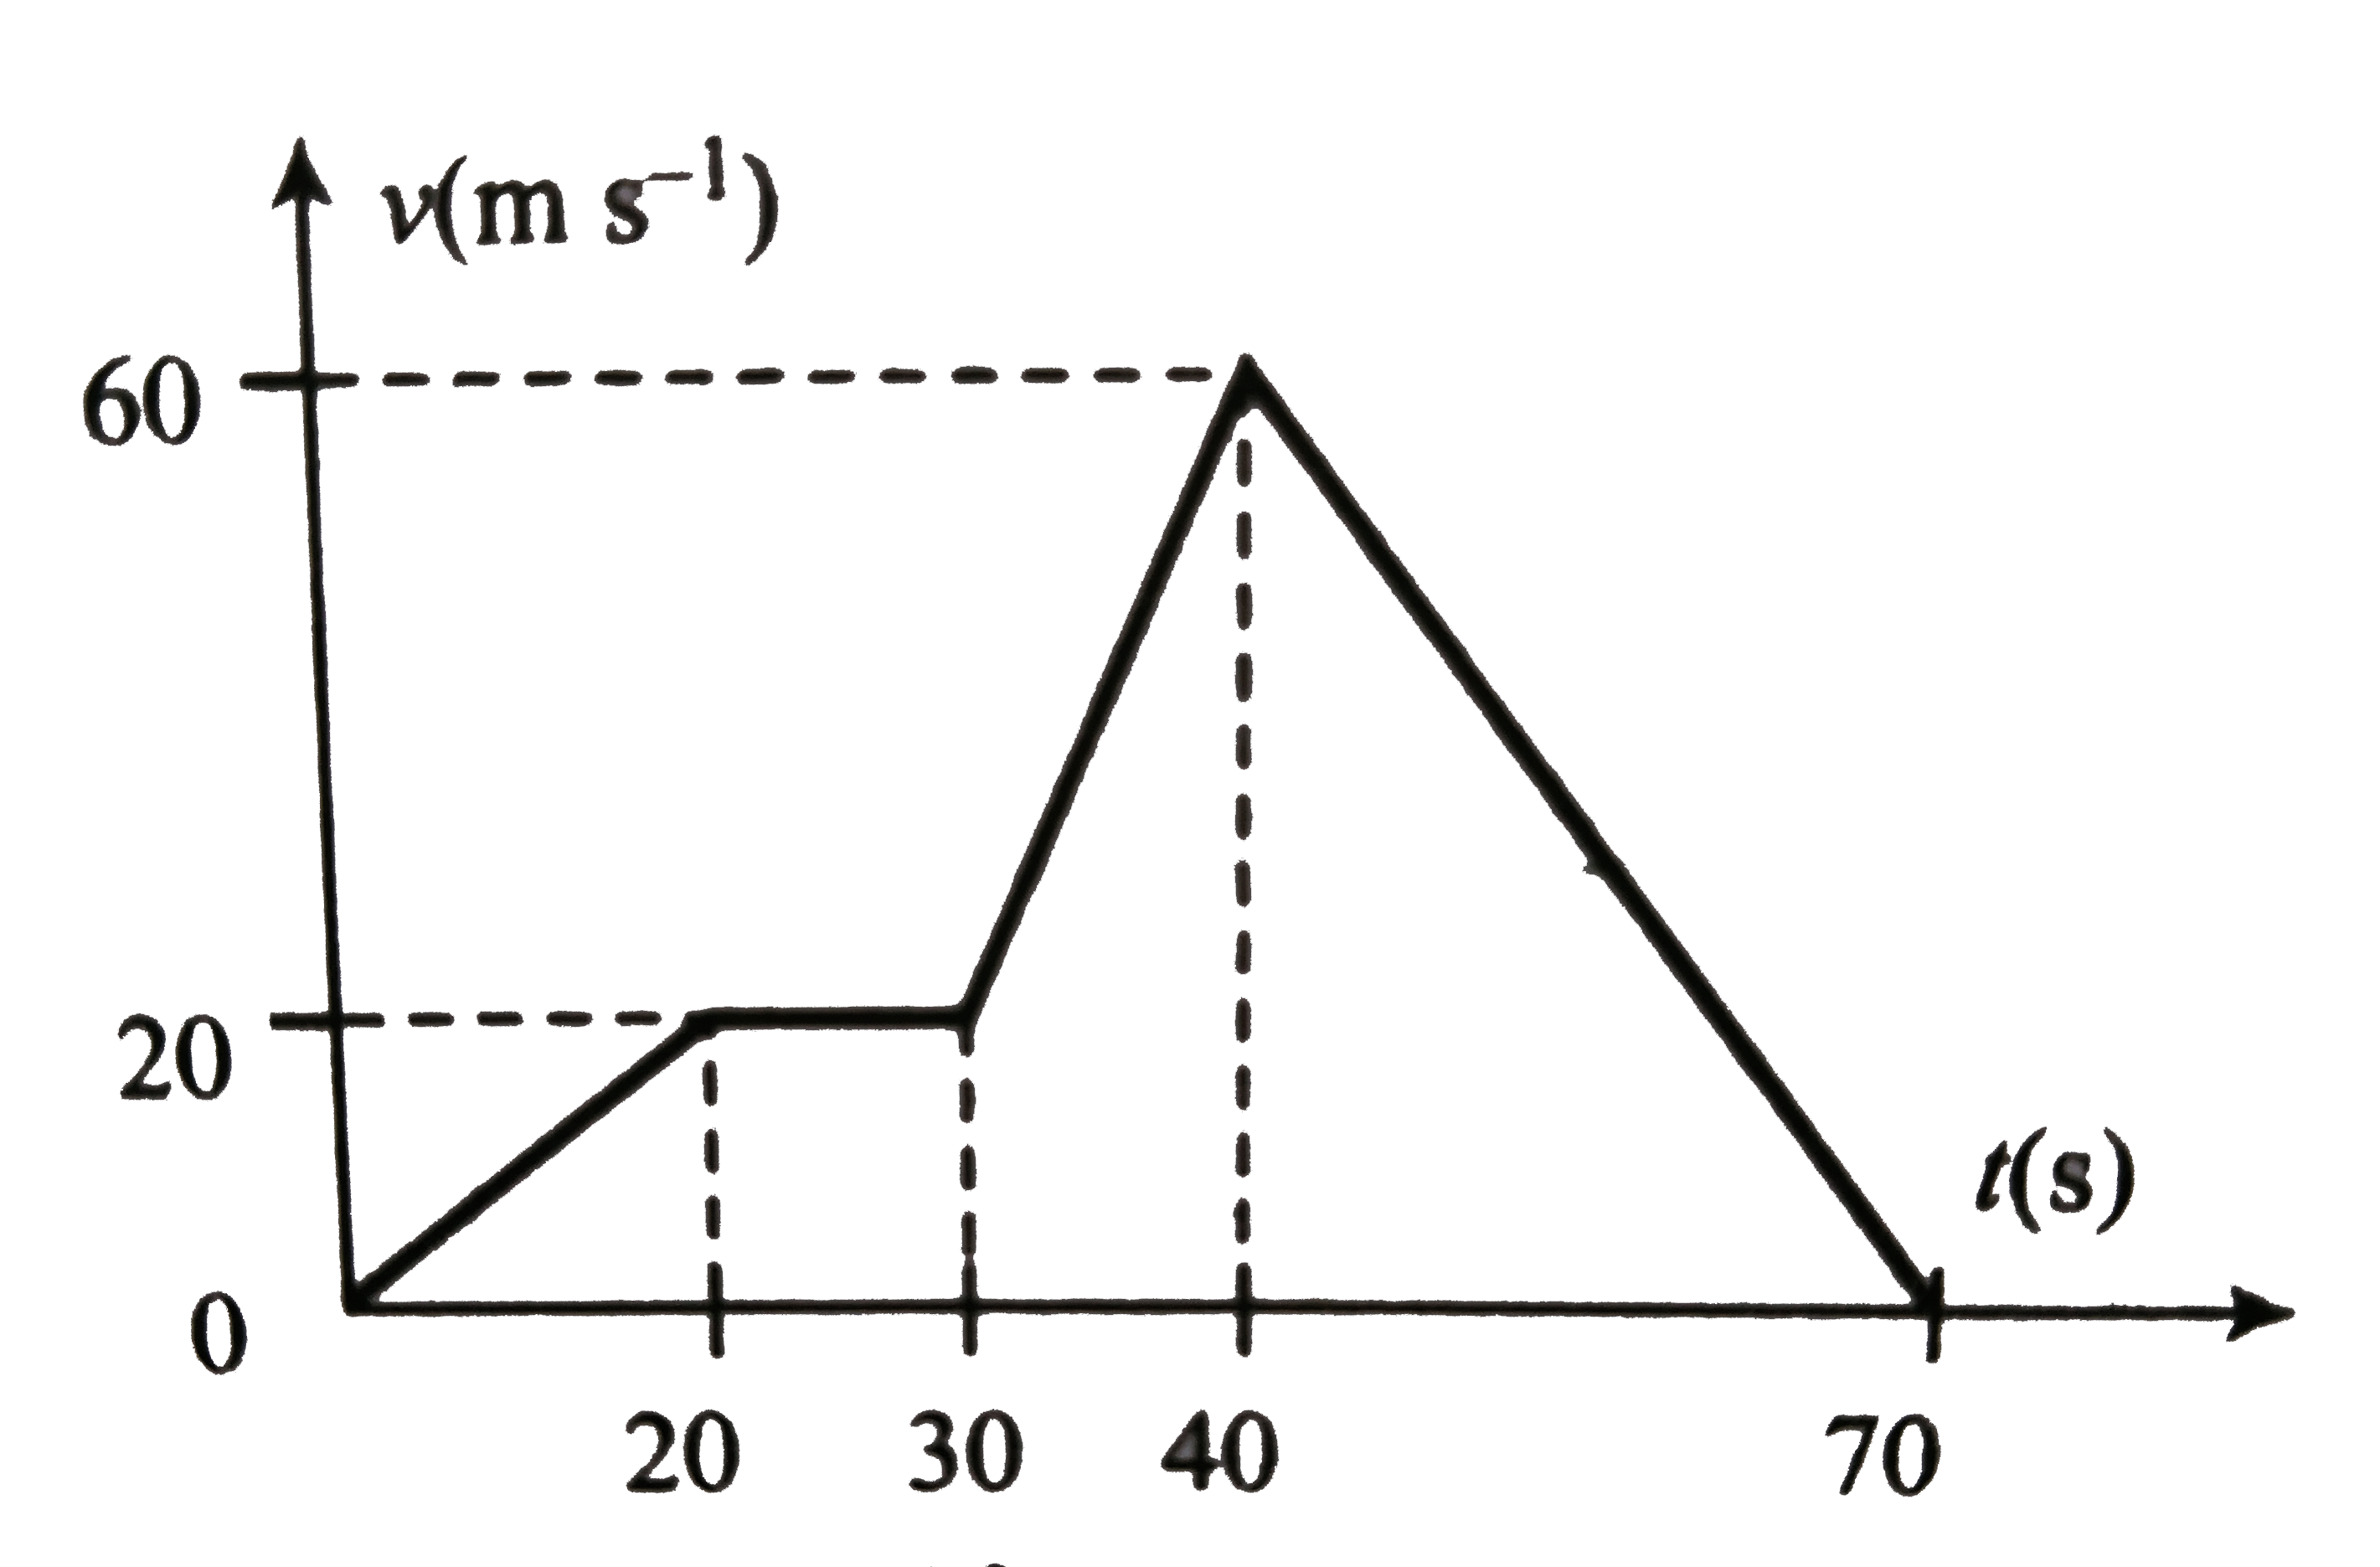
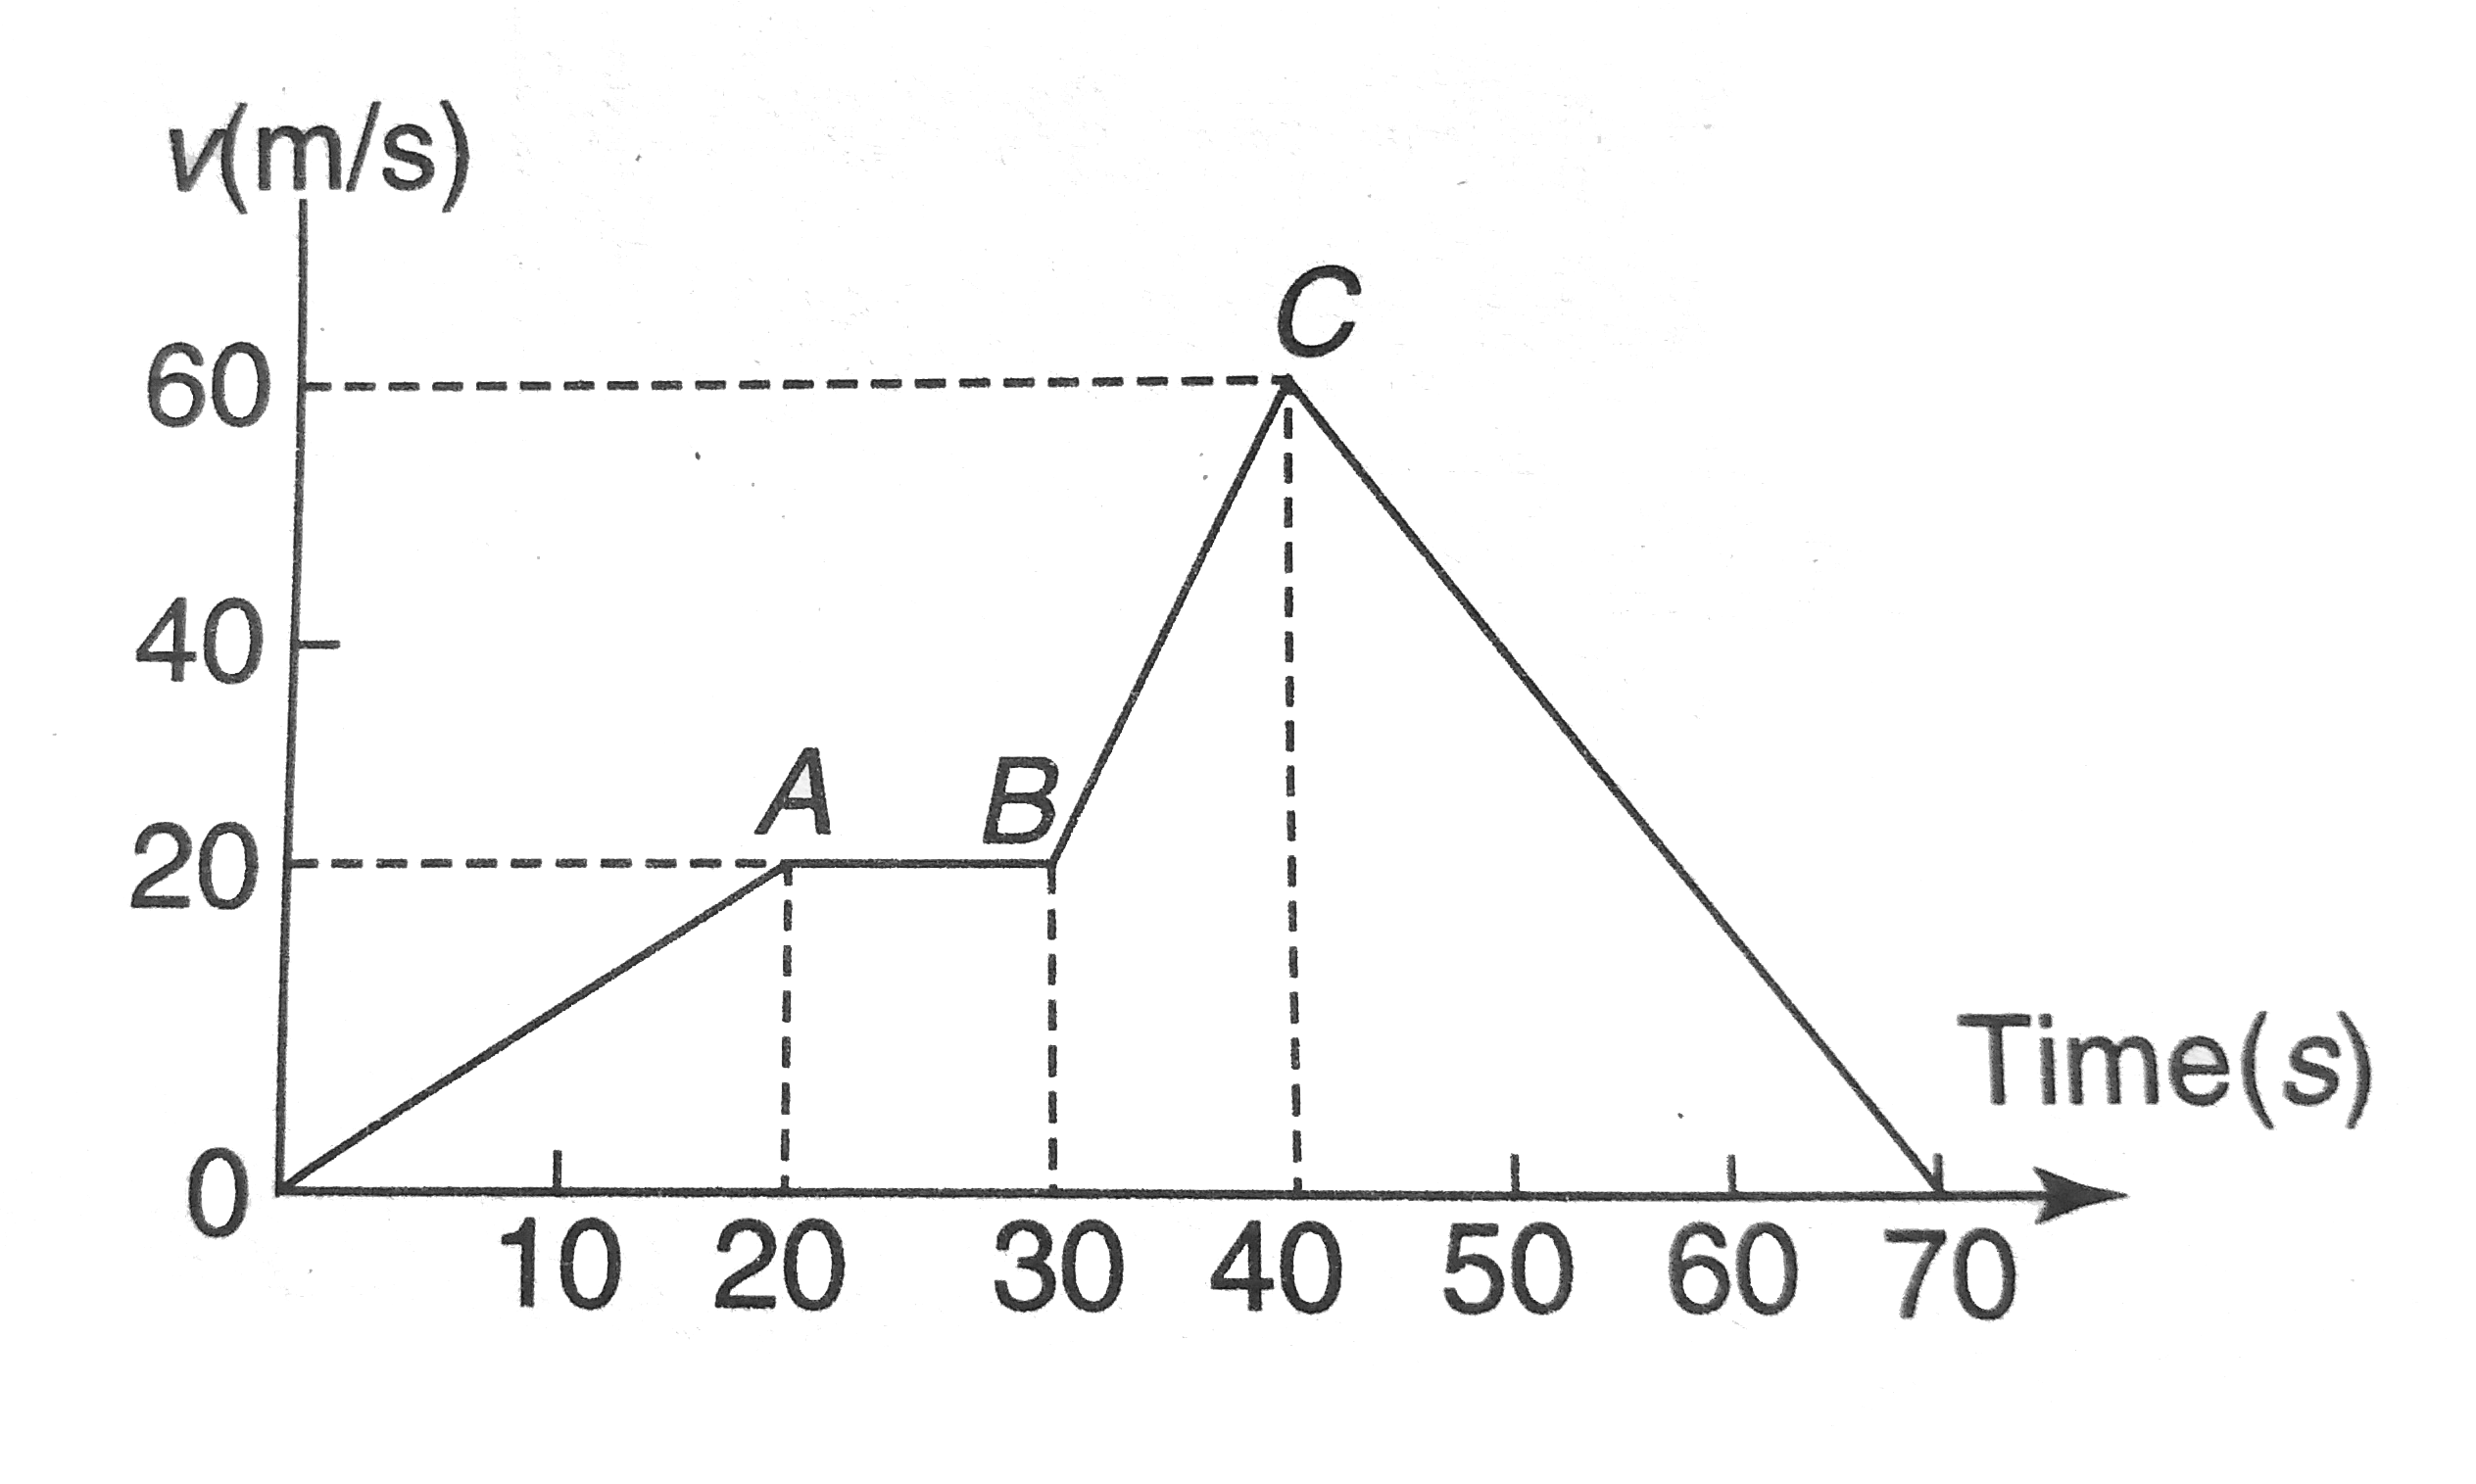
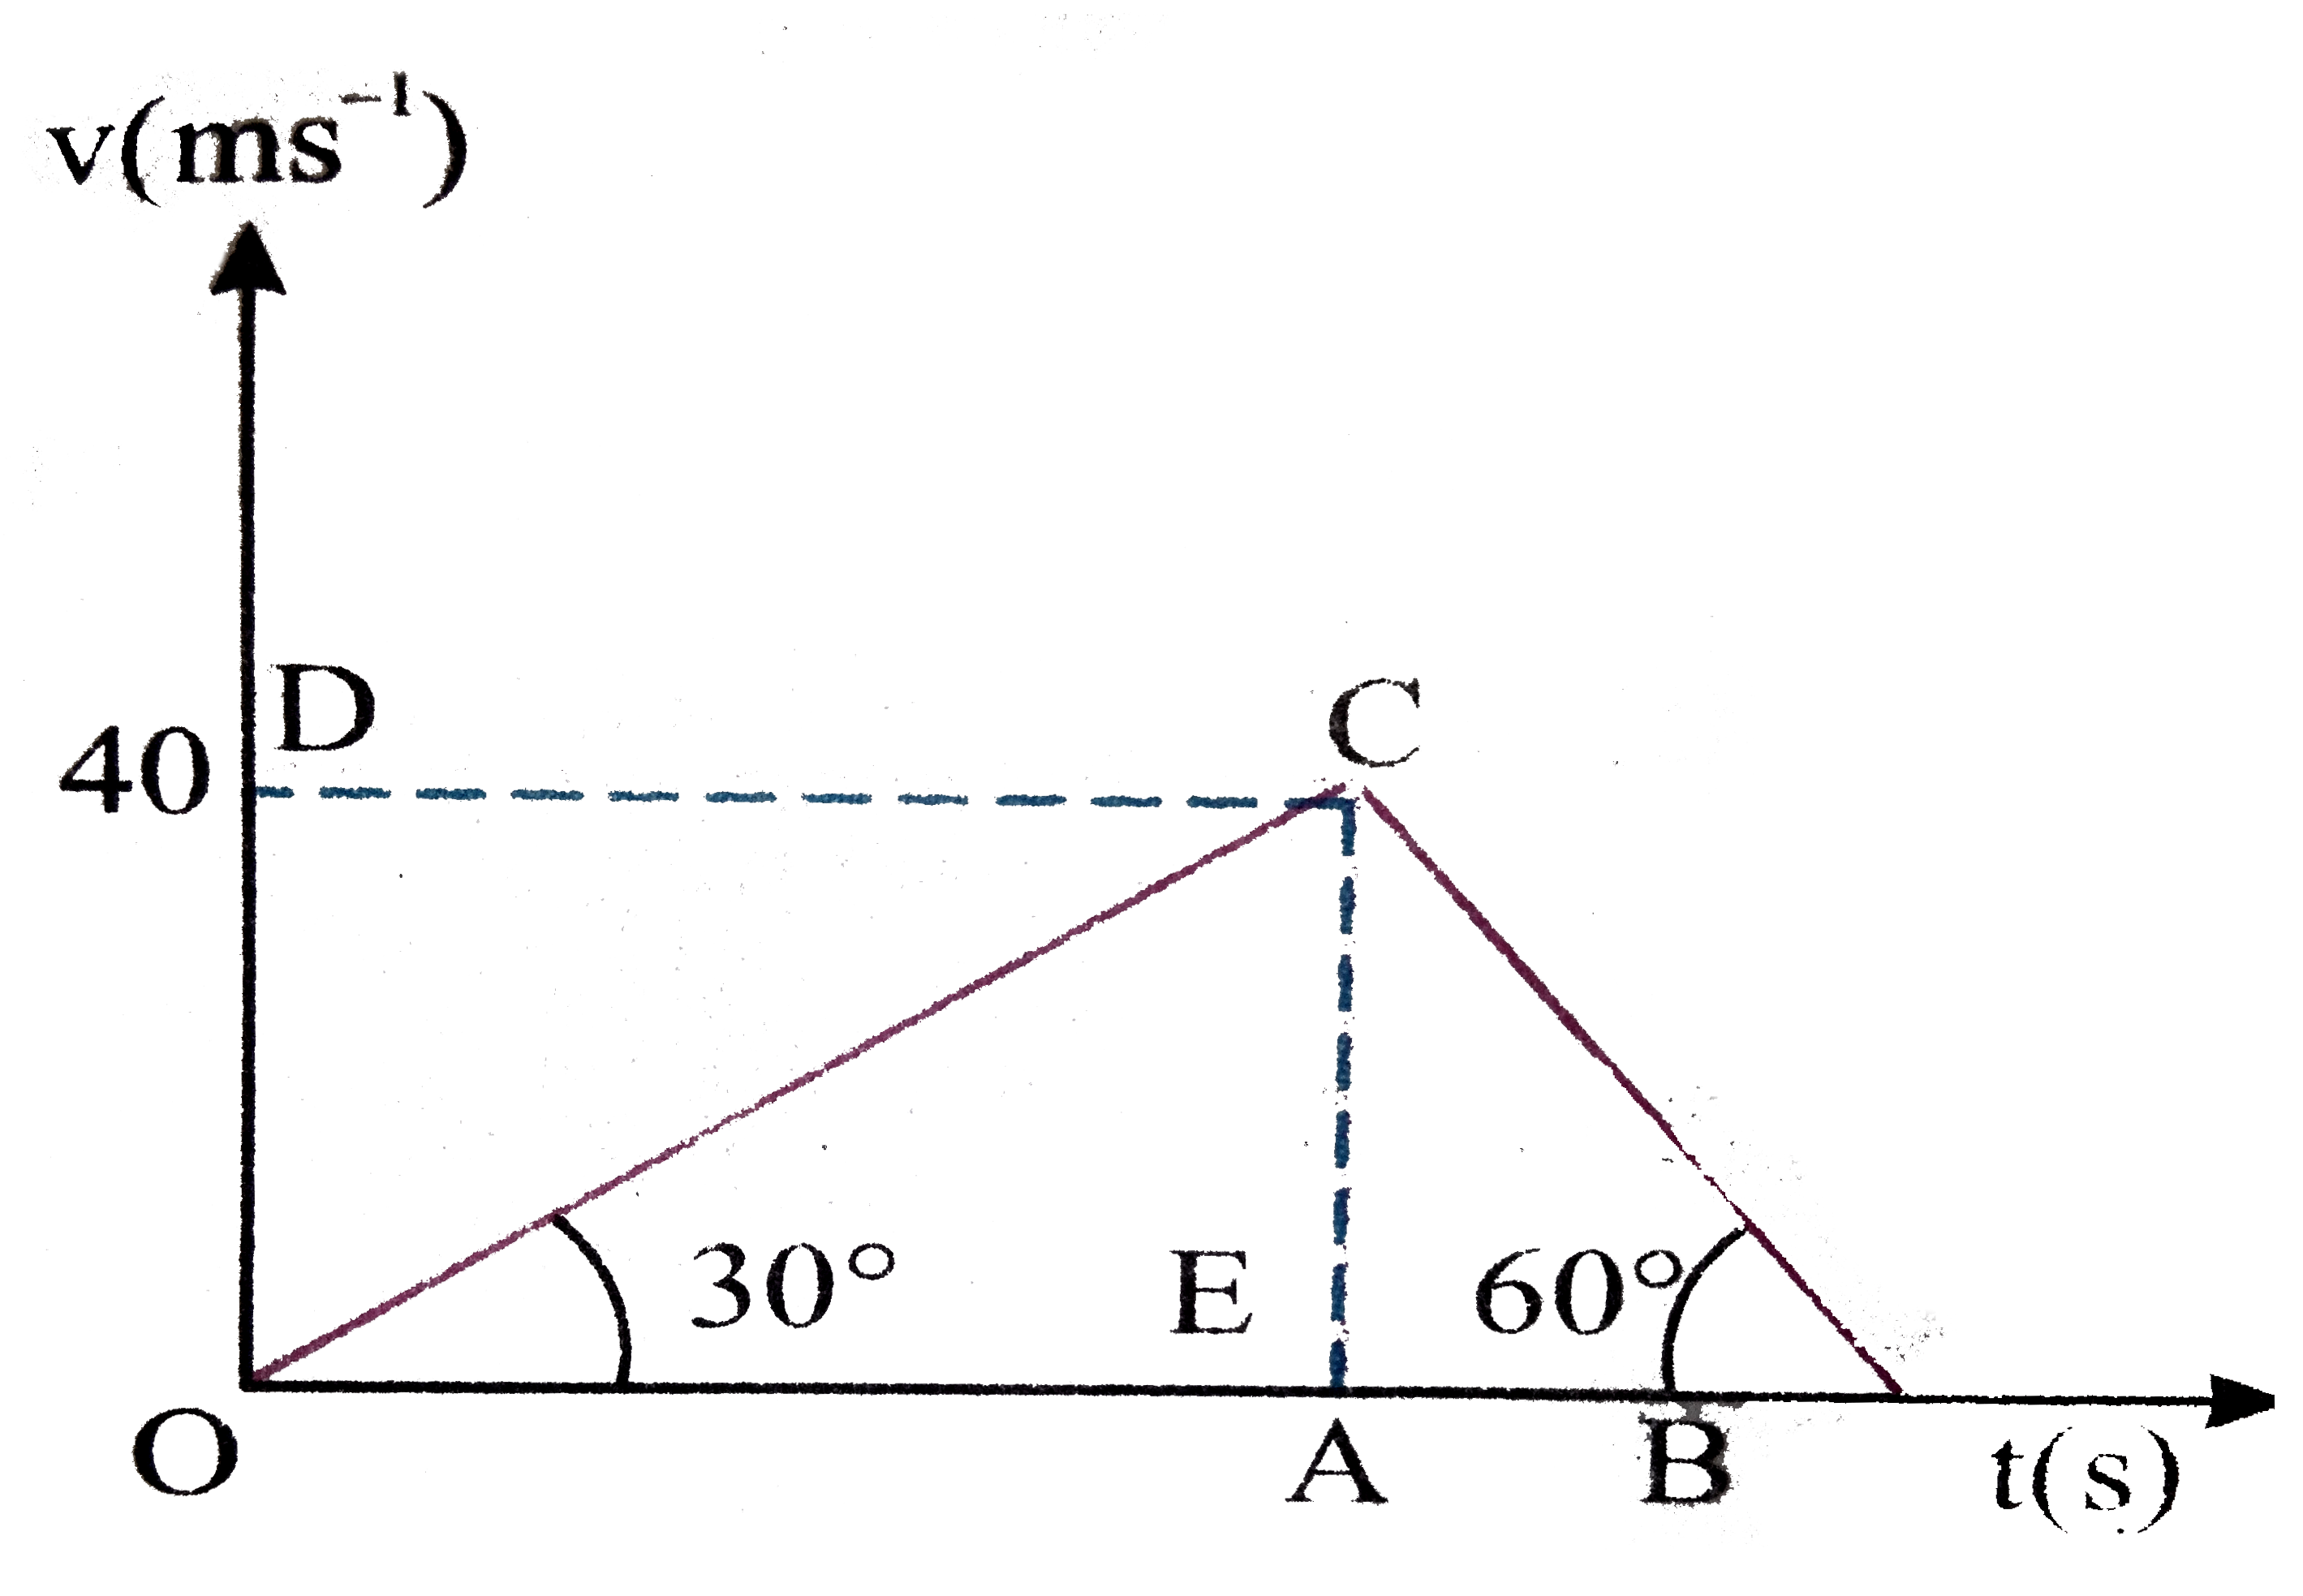
The velocity-time graph of a body is given in. The maximum acceleration in ms−1 is .
 .
.
A
4
B
3
C
2
D
1
Video Solution
Text Solution
The correct Answer is:A
Maximum acceleration will be from 30 to 40s, because slope in this intervl is maximum.
a=(v2−v1t2−t1=60−2040−30=4ms−2.
|
Topper's Solved these Questions
- KINEMATICS-1BOOK - CENGAGE PHYSICSCHAPTER - KINEMATICS-1EXERCISE - Graphical cancept
1 Videos
- KINEMATICS-1BOOK - CENGAGE PHYSICSCHAPTER - KINEMATICS-1EXERCISE - Multiple Correct
16 Videos
- KINEMATICS-1BOOK - CENGAGE PHYSICSCHAPTER - KINEMATICS-1EXERCISE - Single Correct
52 Videos
- GRAVITATIONBOOK - CENGAGE PHYSICSCHAPTER - GRAVITATIONEXERCISE - INTEGER_TYPE
1 Videos
- KINEMATICS-2BOOK - CENGAGE PHYSICSCHAPTER - KINEMATICS-2EXERCISE - Exercise Integer
9 Videos
Similar Questions
Knowledge Check
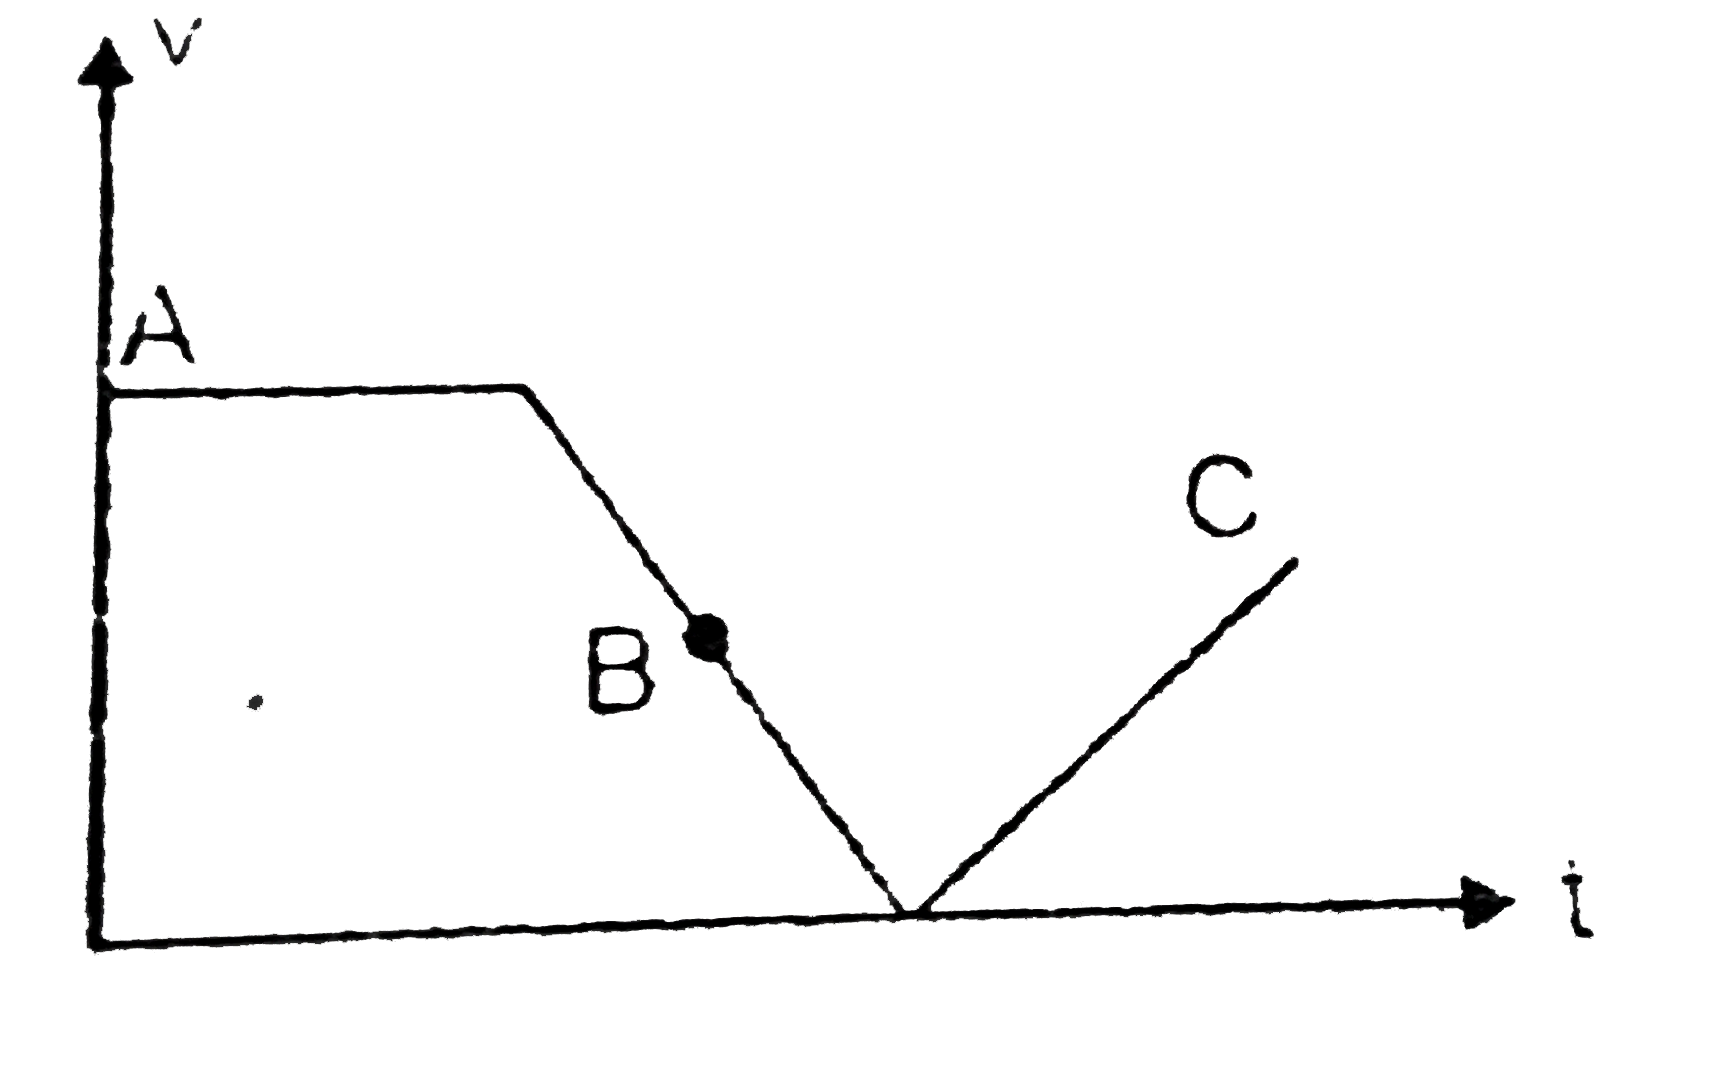
The velocity - time graph of a body is given in figure below .
The acceleration-time graph of the motion of the body isA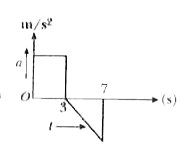 B
B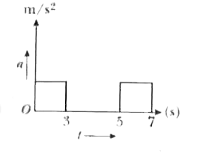 C
C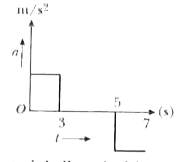 D
D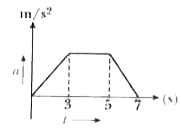
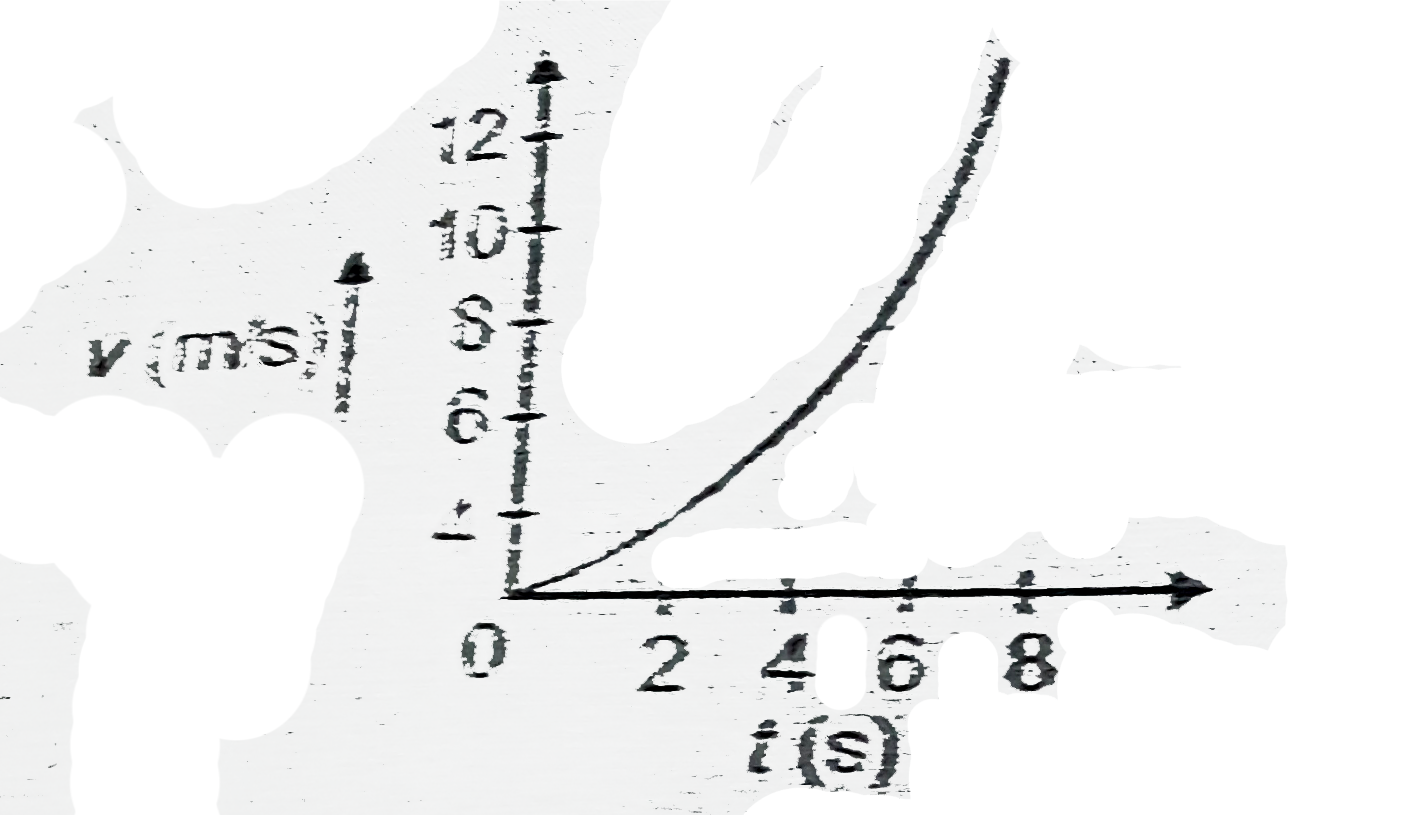
Velocity-time graph of a body thrown vertically up is
Aa straight lineBa parabolaCa hyperbolaDcircleThe velocity -time graph for a body with non-uniform motion is a
Astraight lineBstraight line parallel to x-axisCstraight line parallel to y-axisDcurved line
The velocity time graph of a body is as showh in
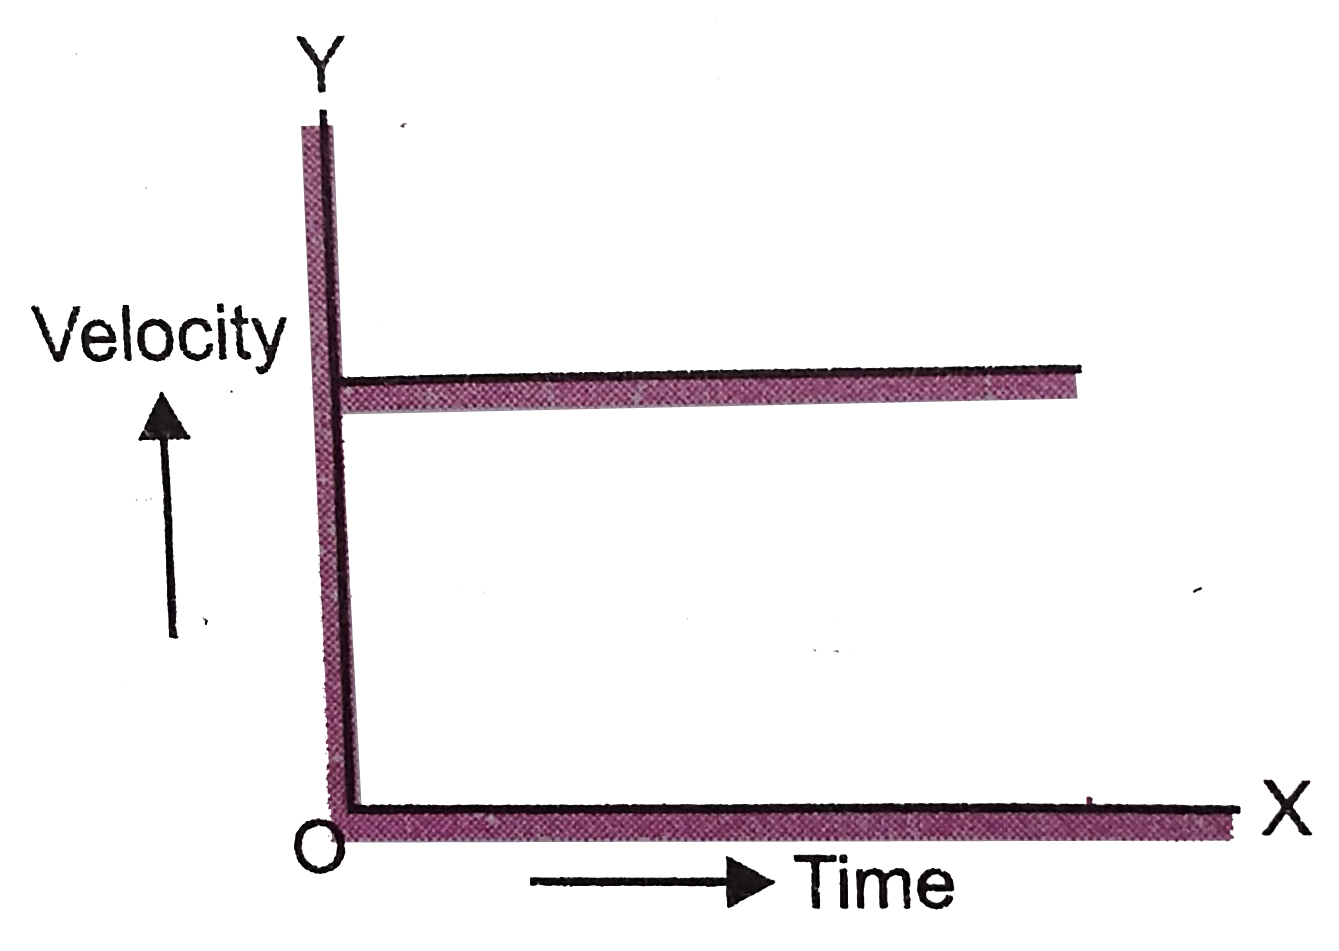
what would be the acceleration of the body ?
View Solution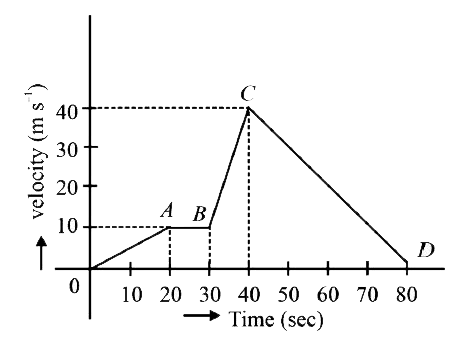
From the above velocity-time graph of a body, identify the interval of time in which the acceleration is maximum. The distance travelled by the body in this interval be Xm. Then what is x10 ?
View SolutionThe velocity-time graph of a body is given below. Find the average velocity from t=0 to t=40s.
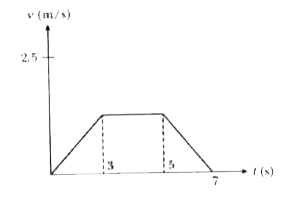
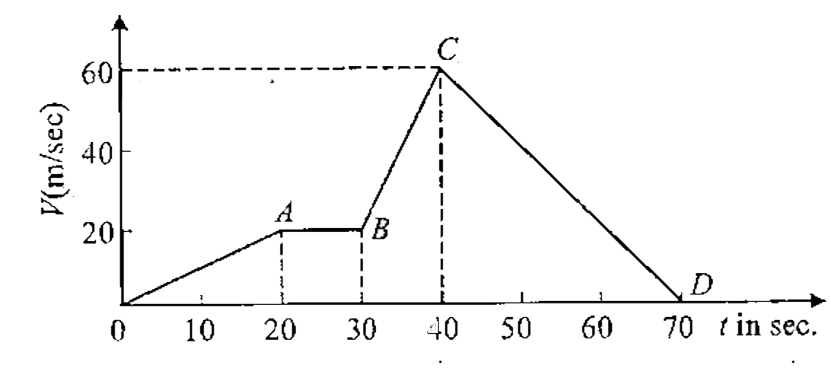
View SolutionThe following shows the time-velocity graph for a moving object. The maximum acceleration will be:
View SolutionThe velocity-time graph of a body is shown in figure. The ratio of magnitude of average acceleration during the intervals OA and AB is
View Solution

