The velocity time graph of a linear motion is shown in the figure. The distance from the starting point after 8 seconds will be
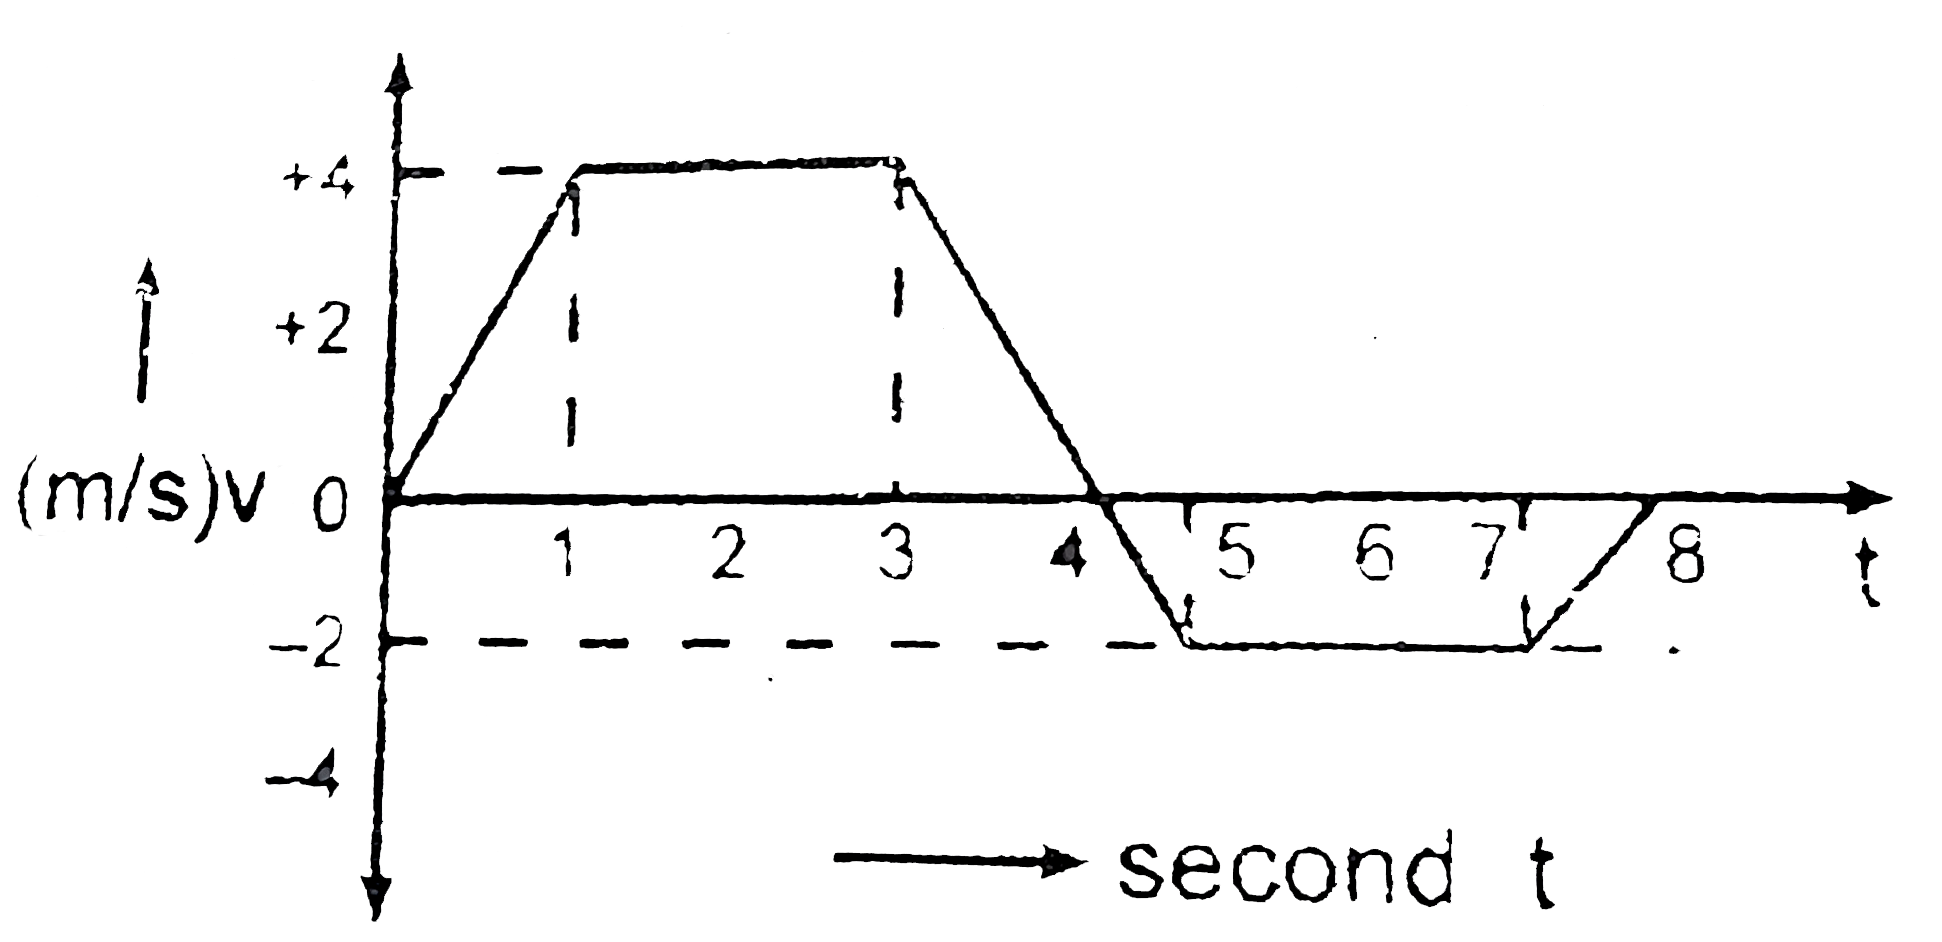 .
.
18 m
6 m
8 m
none of these
The correct Answer is:B
Step by step video, text & image solution for The velocity time graph of a linear motion is shown in the figure. The distance from the starting point after 8 seconds will be . by Physics experts to help you in doubts & scoring excellent marks in Class 12 exams.
Updated on:21/07/2023Topper's Solved these Questions
- DAILY PRACTICE PROBLEMBOOK - RESONANCECHAPTER - DAILY PRACTICE PROBLEMEXERCISE - DPP No.10
9 Videos
- DAILY PRACTICE PROBLEMBOOK - RESONANCECHAPTER - DAILY PRACTICE PROBLEMEXERCISE - DPP No.11
20 Videos
- DAILY PRACTICE PROBLEMBOOK - RESONANCECHAPTER - DAILY PRACTICE PROBLEMEXERCISE - DPP No.8
9 Videos
- CURRENT ELECTRICITYBOOK - RESONANCECHAPTER - CURRENT ELECTRICITYEXERCISE - High Level Problems (HIP)
21 Videos
- ELECTRO MAGNETIC WAVESBOOK - RESONANCECHAPTER - ELECTRO MAGNETIC WAVESEXERCISE - Exercise 3
27 Videos
Similar Questions
The velocity-time graph of a linear motion is shown in figure. The displacement from the origin after 8 sec is :
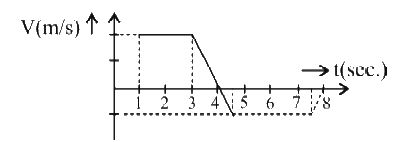
View SolutionThe velocity-time graph of a linear motion is shown below. Find the (a) displacement and distance from the origin after 8s. (b) acceleration in the first second. (c) deceleration during the 5th second. (d) maximum speed during the motion.
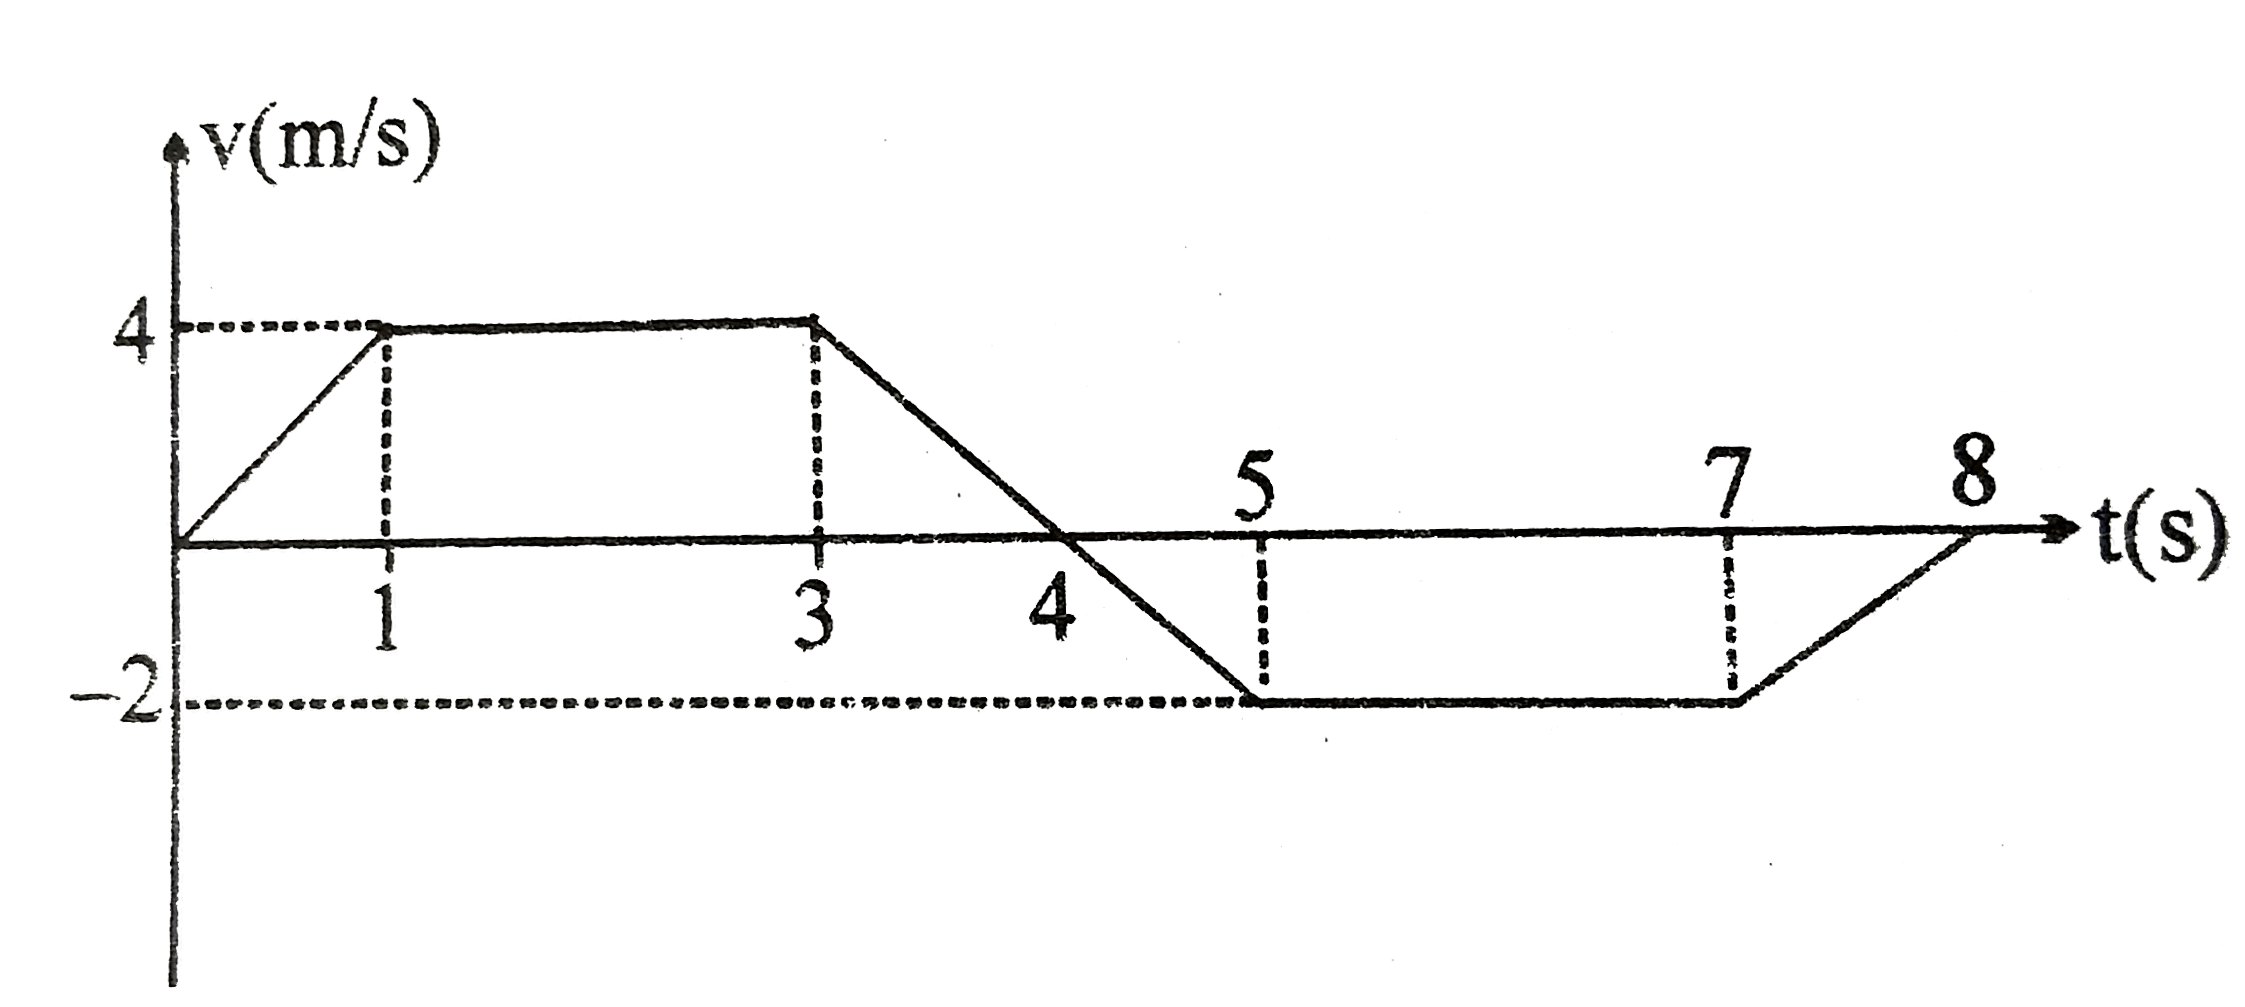
View Solution
Knowledge Check
The velocity-time graph of a linear motion os shown figure. The distance from the starting point after 8sec is.
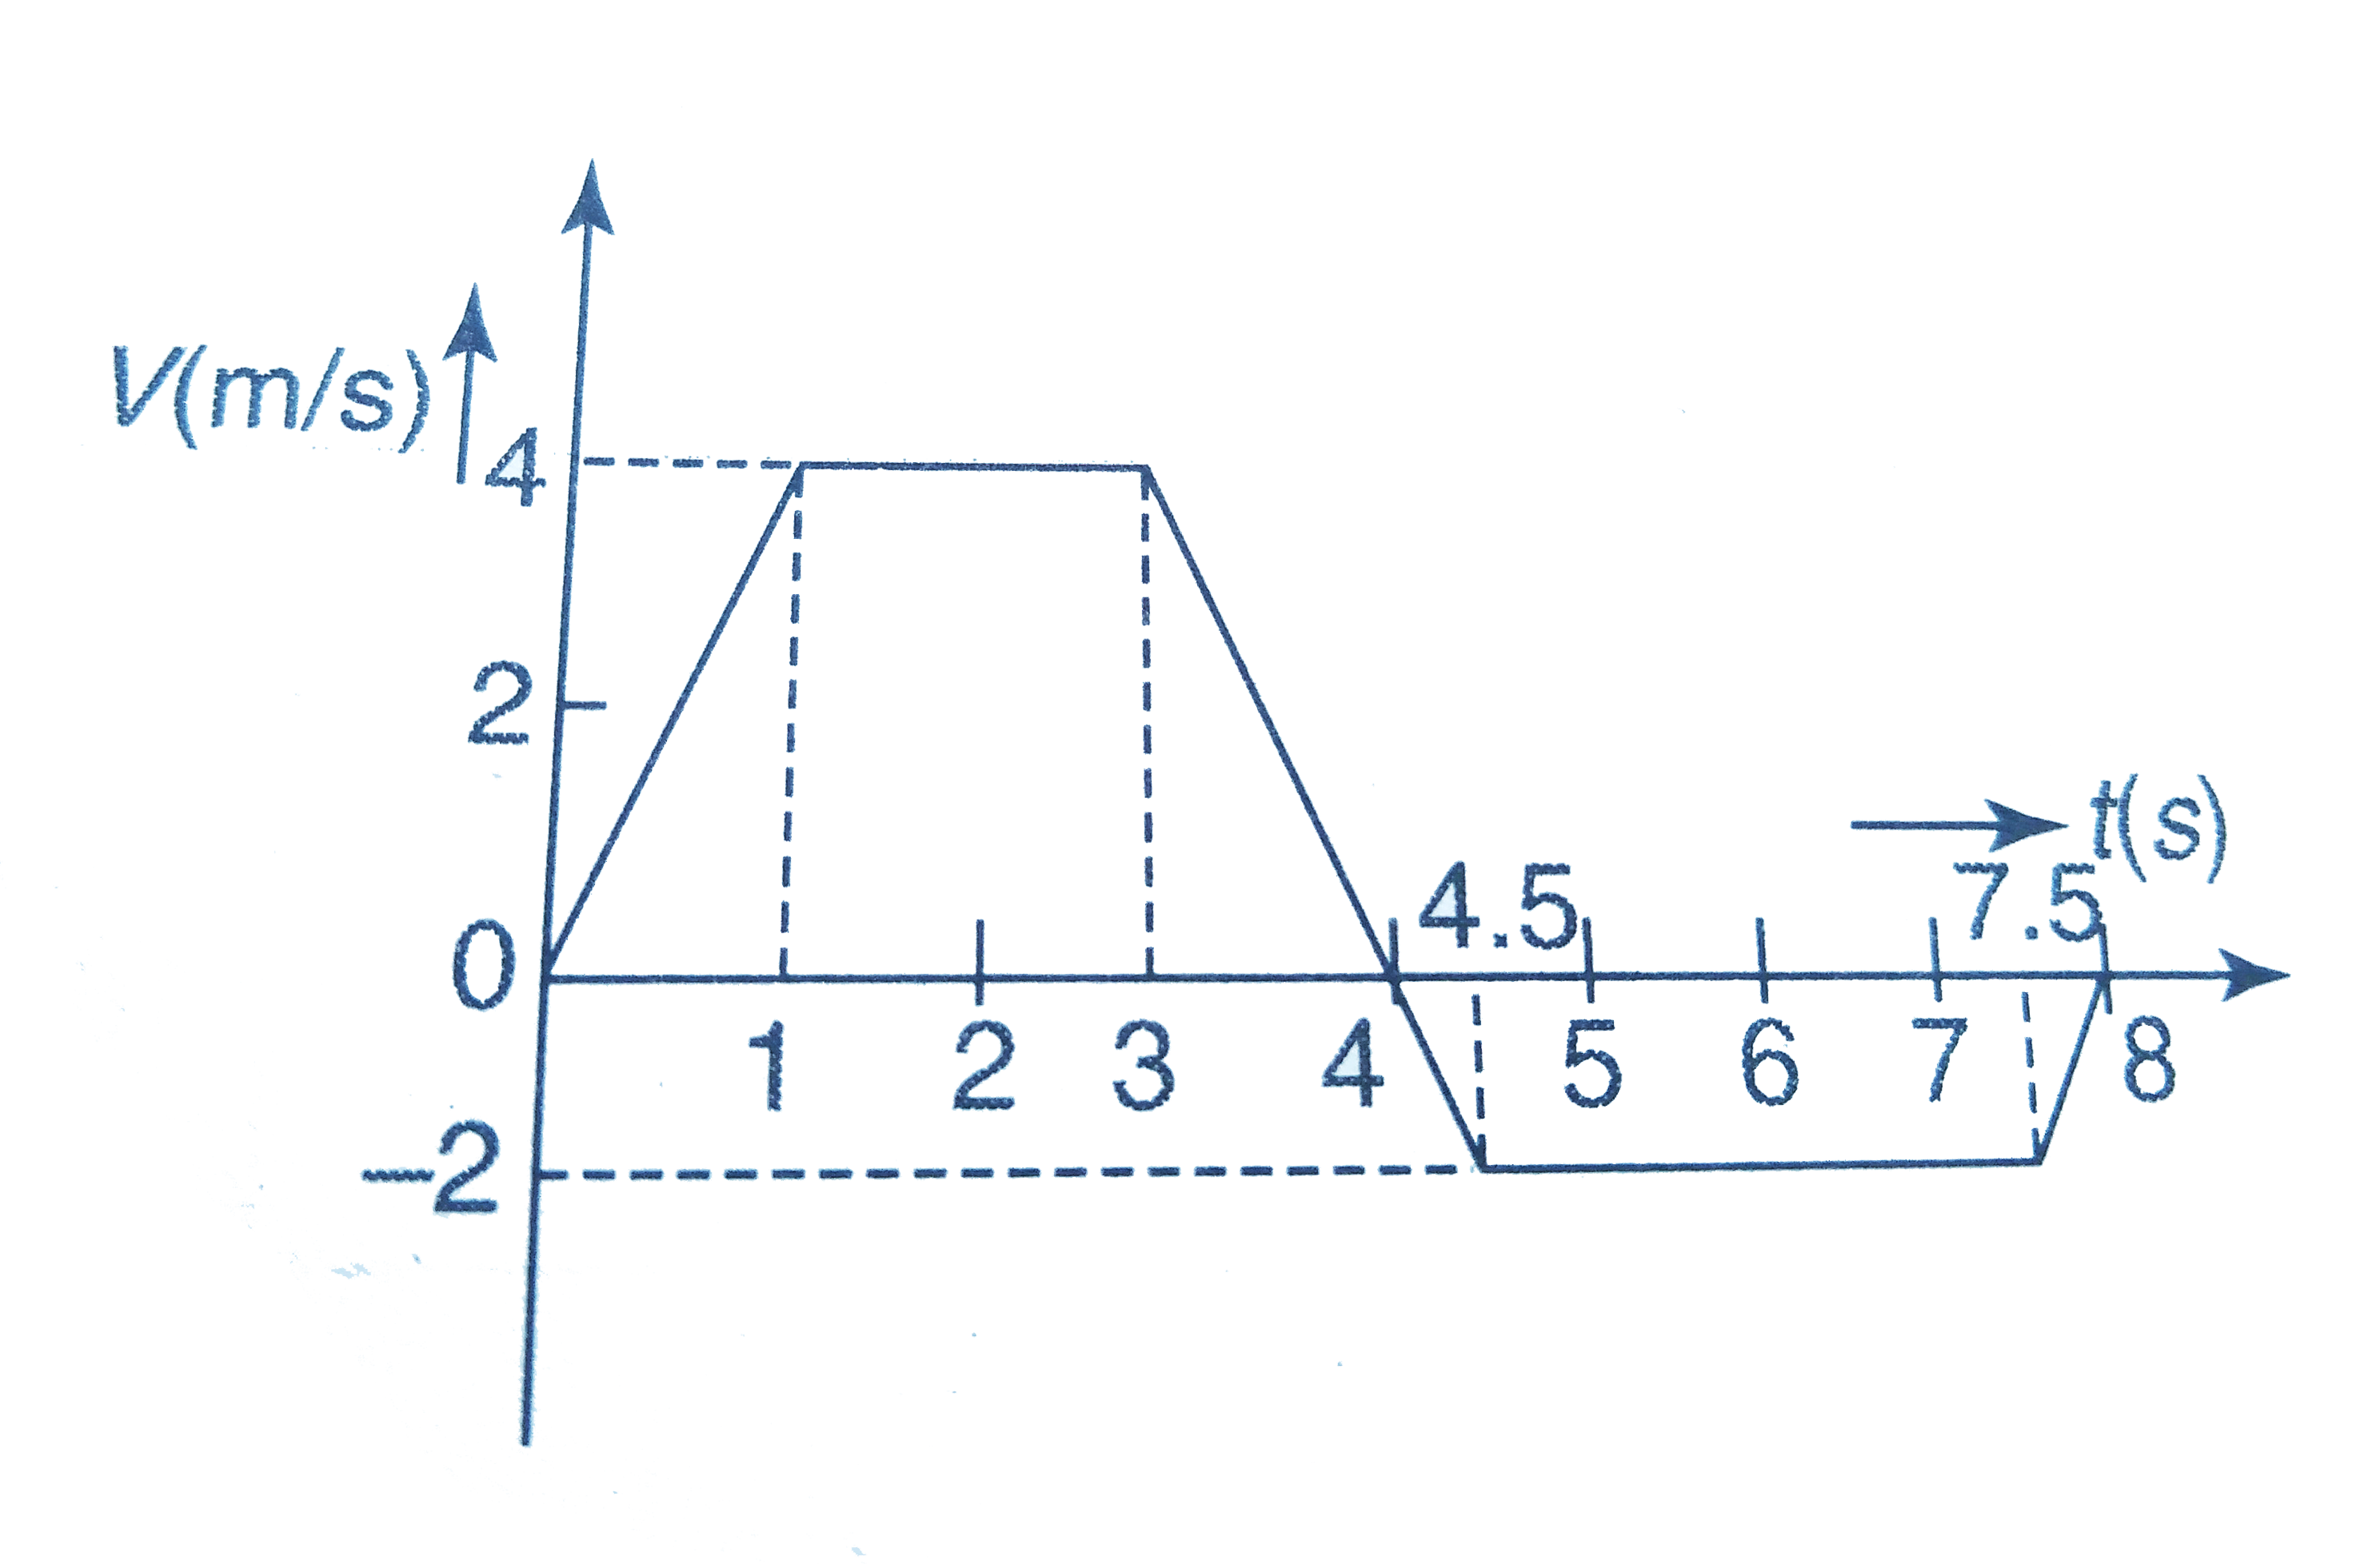 A5 mB16 mC8 mD19 m
The velocity-time graph of a linear motion is shown in figure. The displacement & distance from the origin after 8 sec is :-
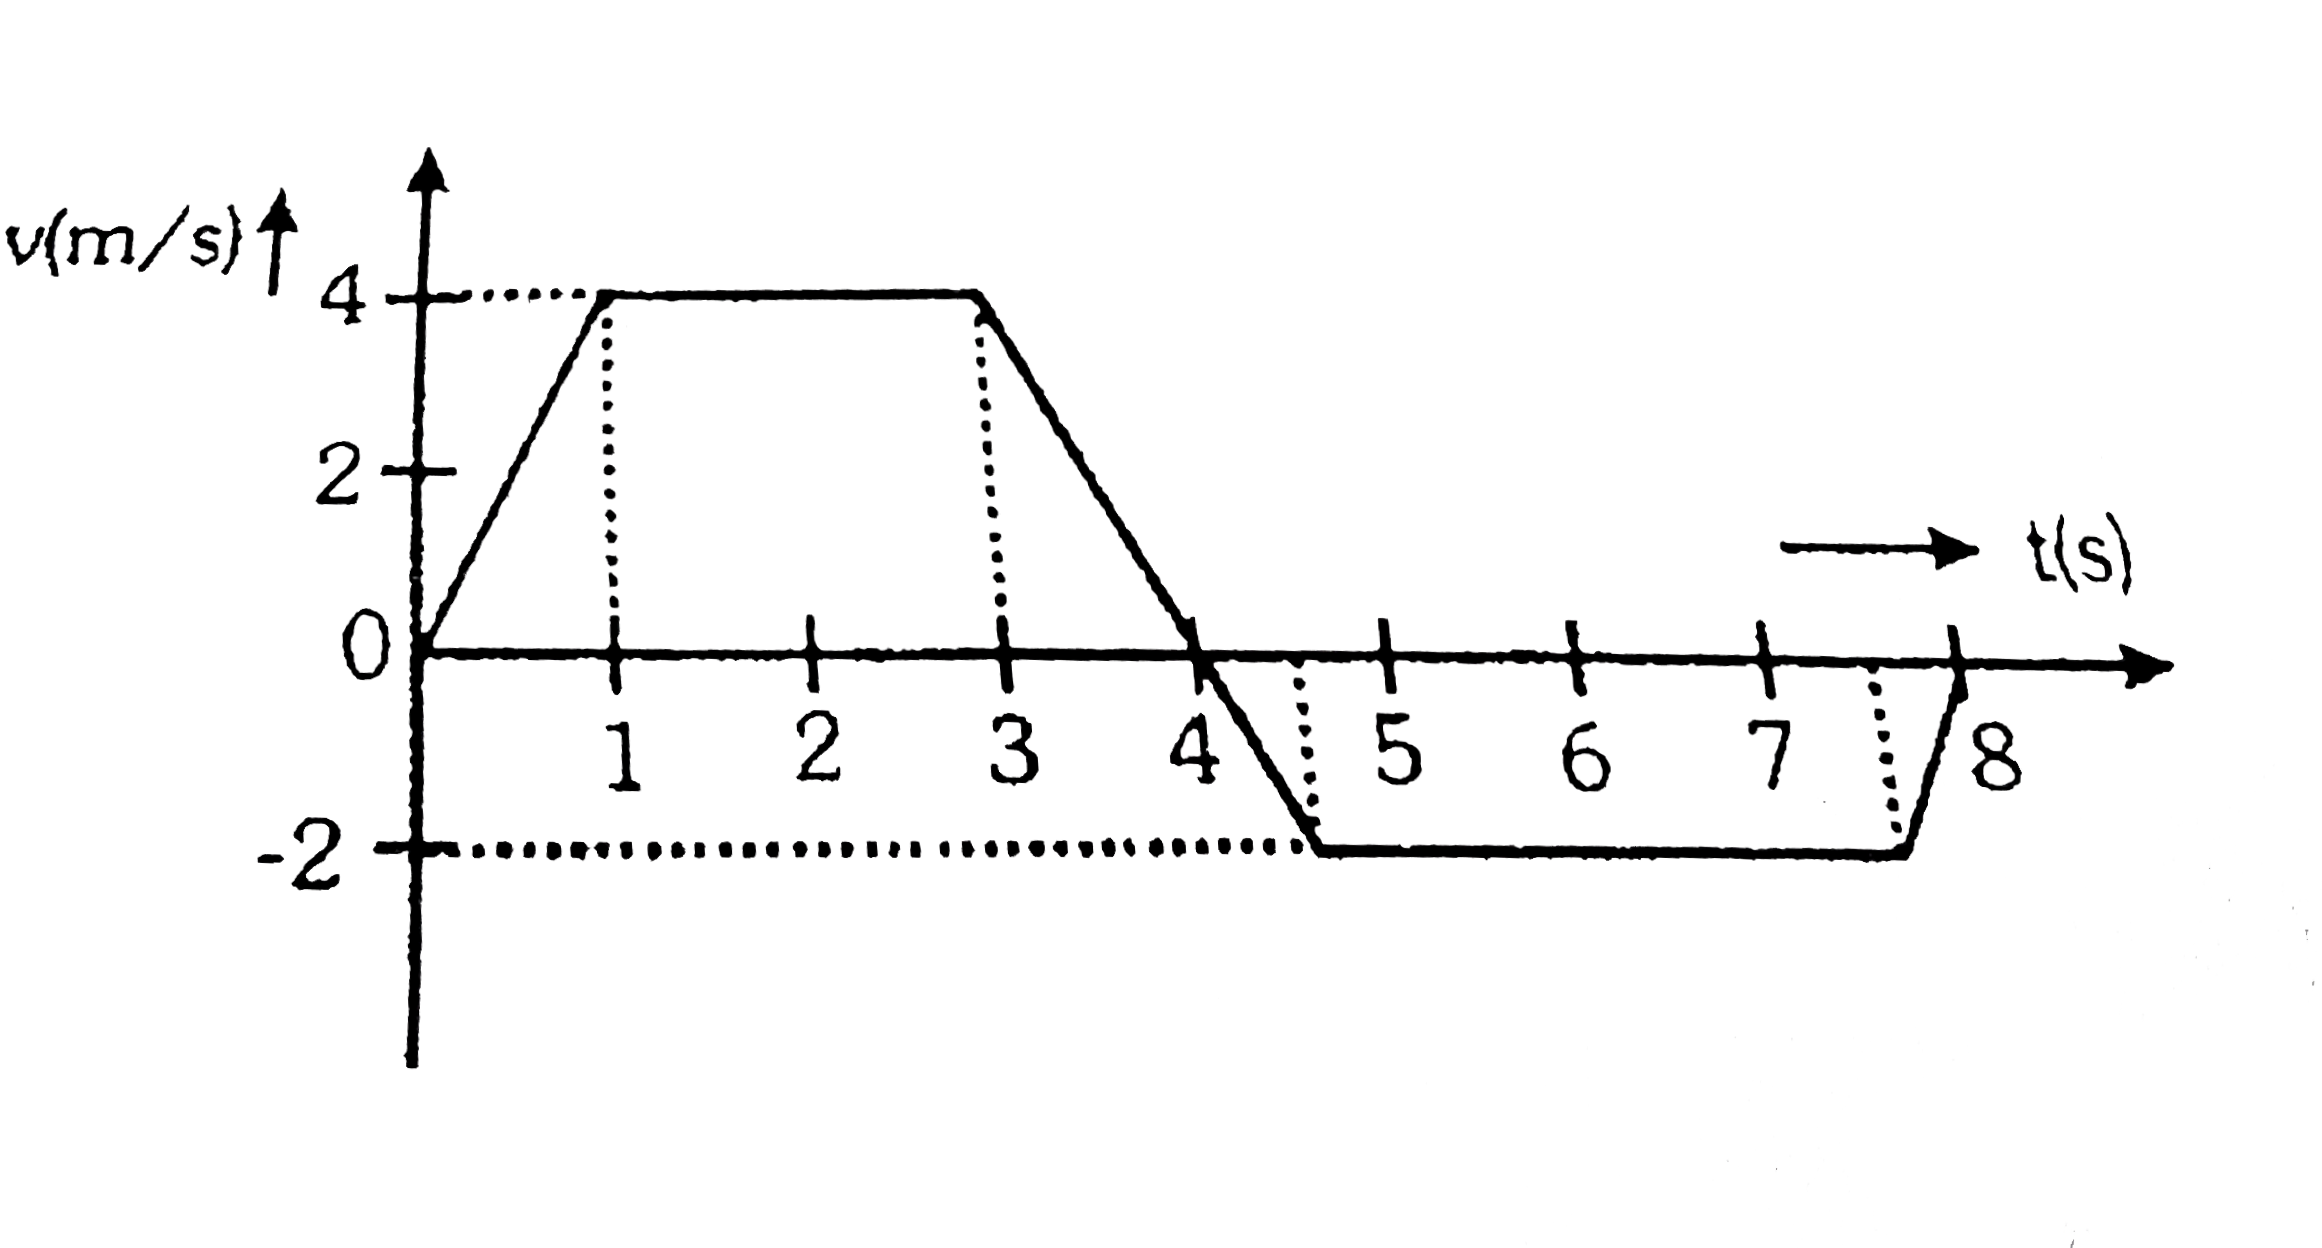 A5m,19mB16m,22mC8m,19mD6m,5m
The v-t graph of a linear motion is shown in adjoining figure. The distance from origin after 8 seconds is -
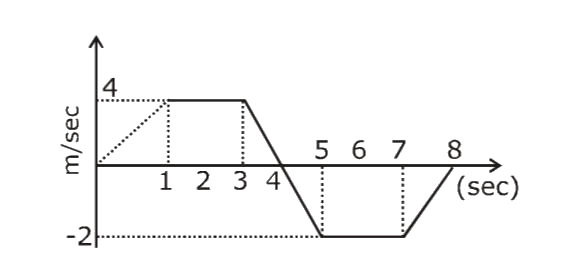 A18 metersB16 metersC8 metersD6 meters
The velocity-time graph of a linear motion is shown below. The distance from the origin after 8 seconds is :
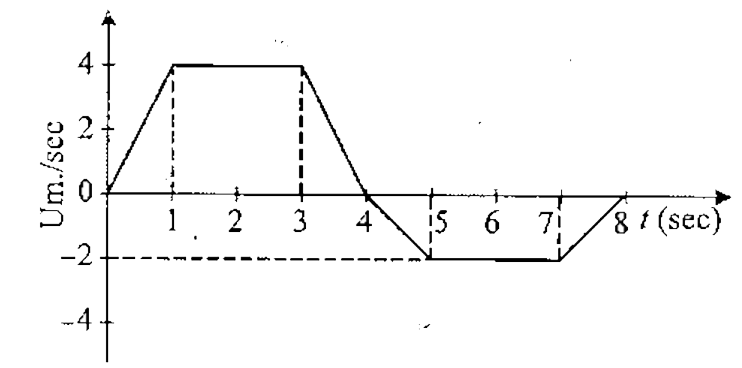
View SolutionThe velocity − time graph of a particle is as shown in figure

View SolutionThe velocity-time graph of a body is shown in the figure, it implies that at point B
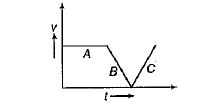
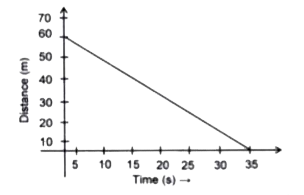
View SolutionThe distance-time graph of a moving vehicle is as shown in the figure.
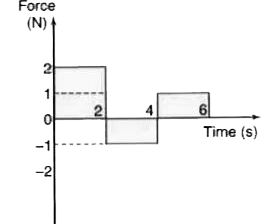
View SolutionA force-time graph for a linear motion is shown in figure. The linear momentum gained between 0 and 6 second is
View Solution
