The velocity-time graph of a particle moving in a straight line is shown in figure. The mass of the particle is 2kg. Work done by all the forces acting on the particle in time interval between t=0 to t=10s is
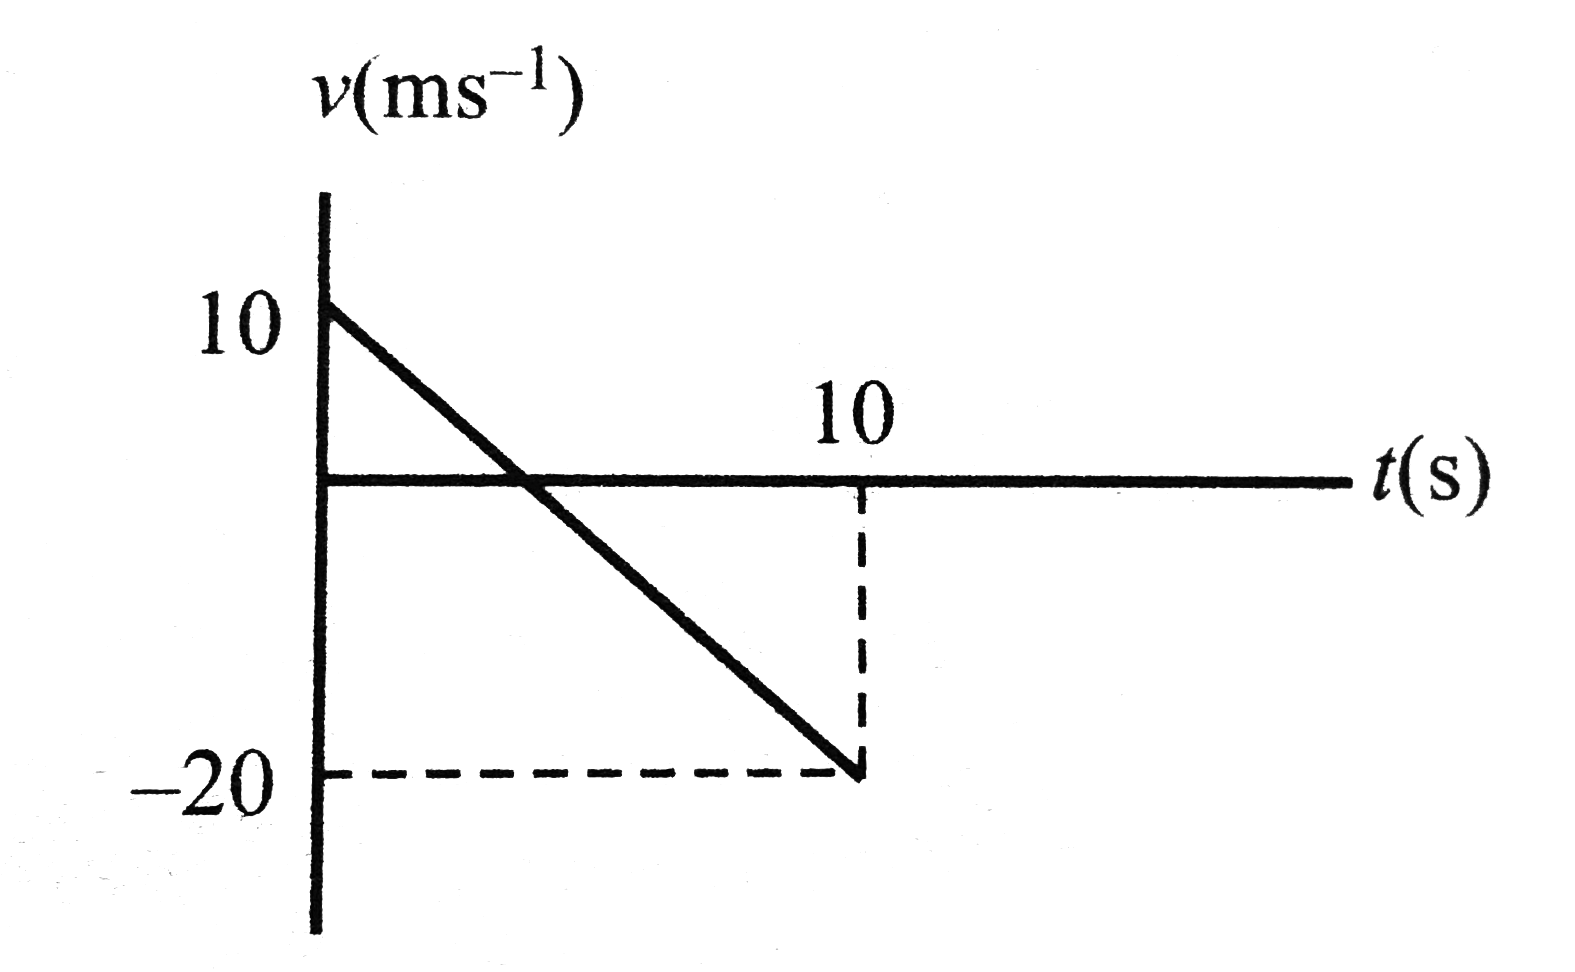
300 J
−300 J
400 J
−400 J
The correct Answer is:A
Step by step video, text & image solution for The velocity-time graph of a particle moving in a straight line is shown in figure. The mass of the particle is 2kg. Work done by all the forces acting on the particle in time interval between t=0 to t=10s is by Physics experts to help you in doubts & scoring excellent marks in Class 11 exams.
Updated on:21/07/2023Topper's Solved these Questions
- WORK, ENERGY AND POWERBOOK - PHYSICS GALAXY - ASHISH ARORACHAPTER - WORK, ENERGY AND POWEREXERCISE - unsolvedMCQ
78 Videos
- WORK, ENERGY AND POWERBOOK - PHYSICS GALAXY - ASHISH ARORACHAPTER - WORK, ENERGY AND POWEREXERCISE - unsolved
1 Videos
- WORK, ENERGY AND POWERBOOK - PHYSICS GALAXY - ASHISH ARORACHAPTER - WORK, ENERGY AND POWEREXERCISE - Discussion Question
31 Videos
- RIGID BODIES AND ROTATIONAL MOTIONBOOK - PHYSICS GALAXY - ASHISH ARORACHAPTER - RIGID BODIES AND ROTATIONAL MOTIONEXERCISE - Unsolved Numerical
63 Videos
Similar Questions
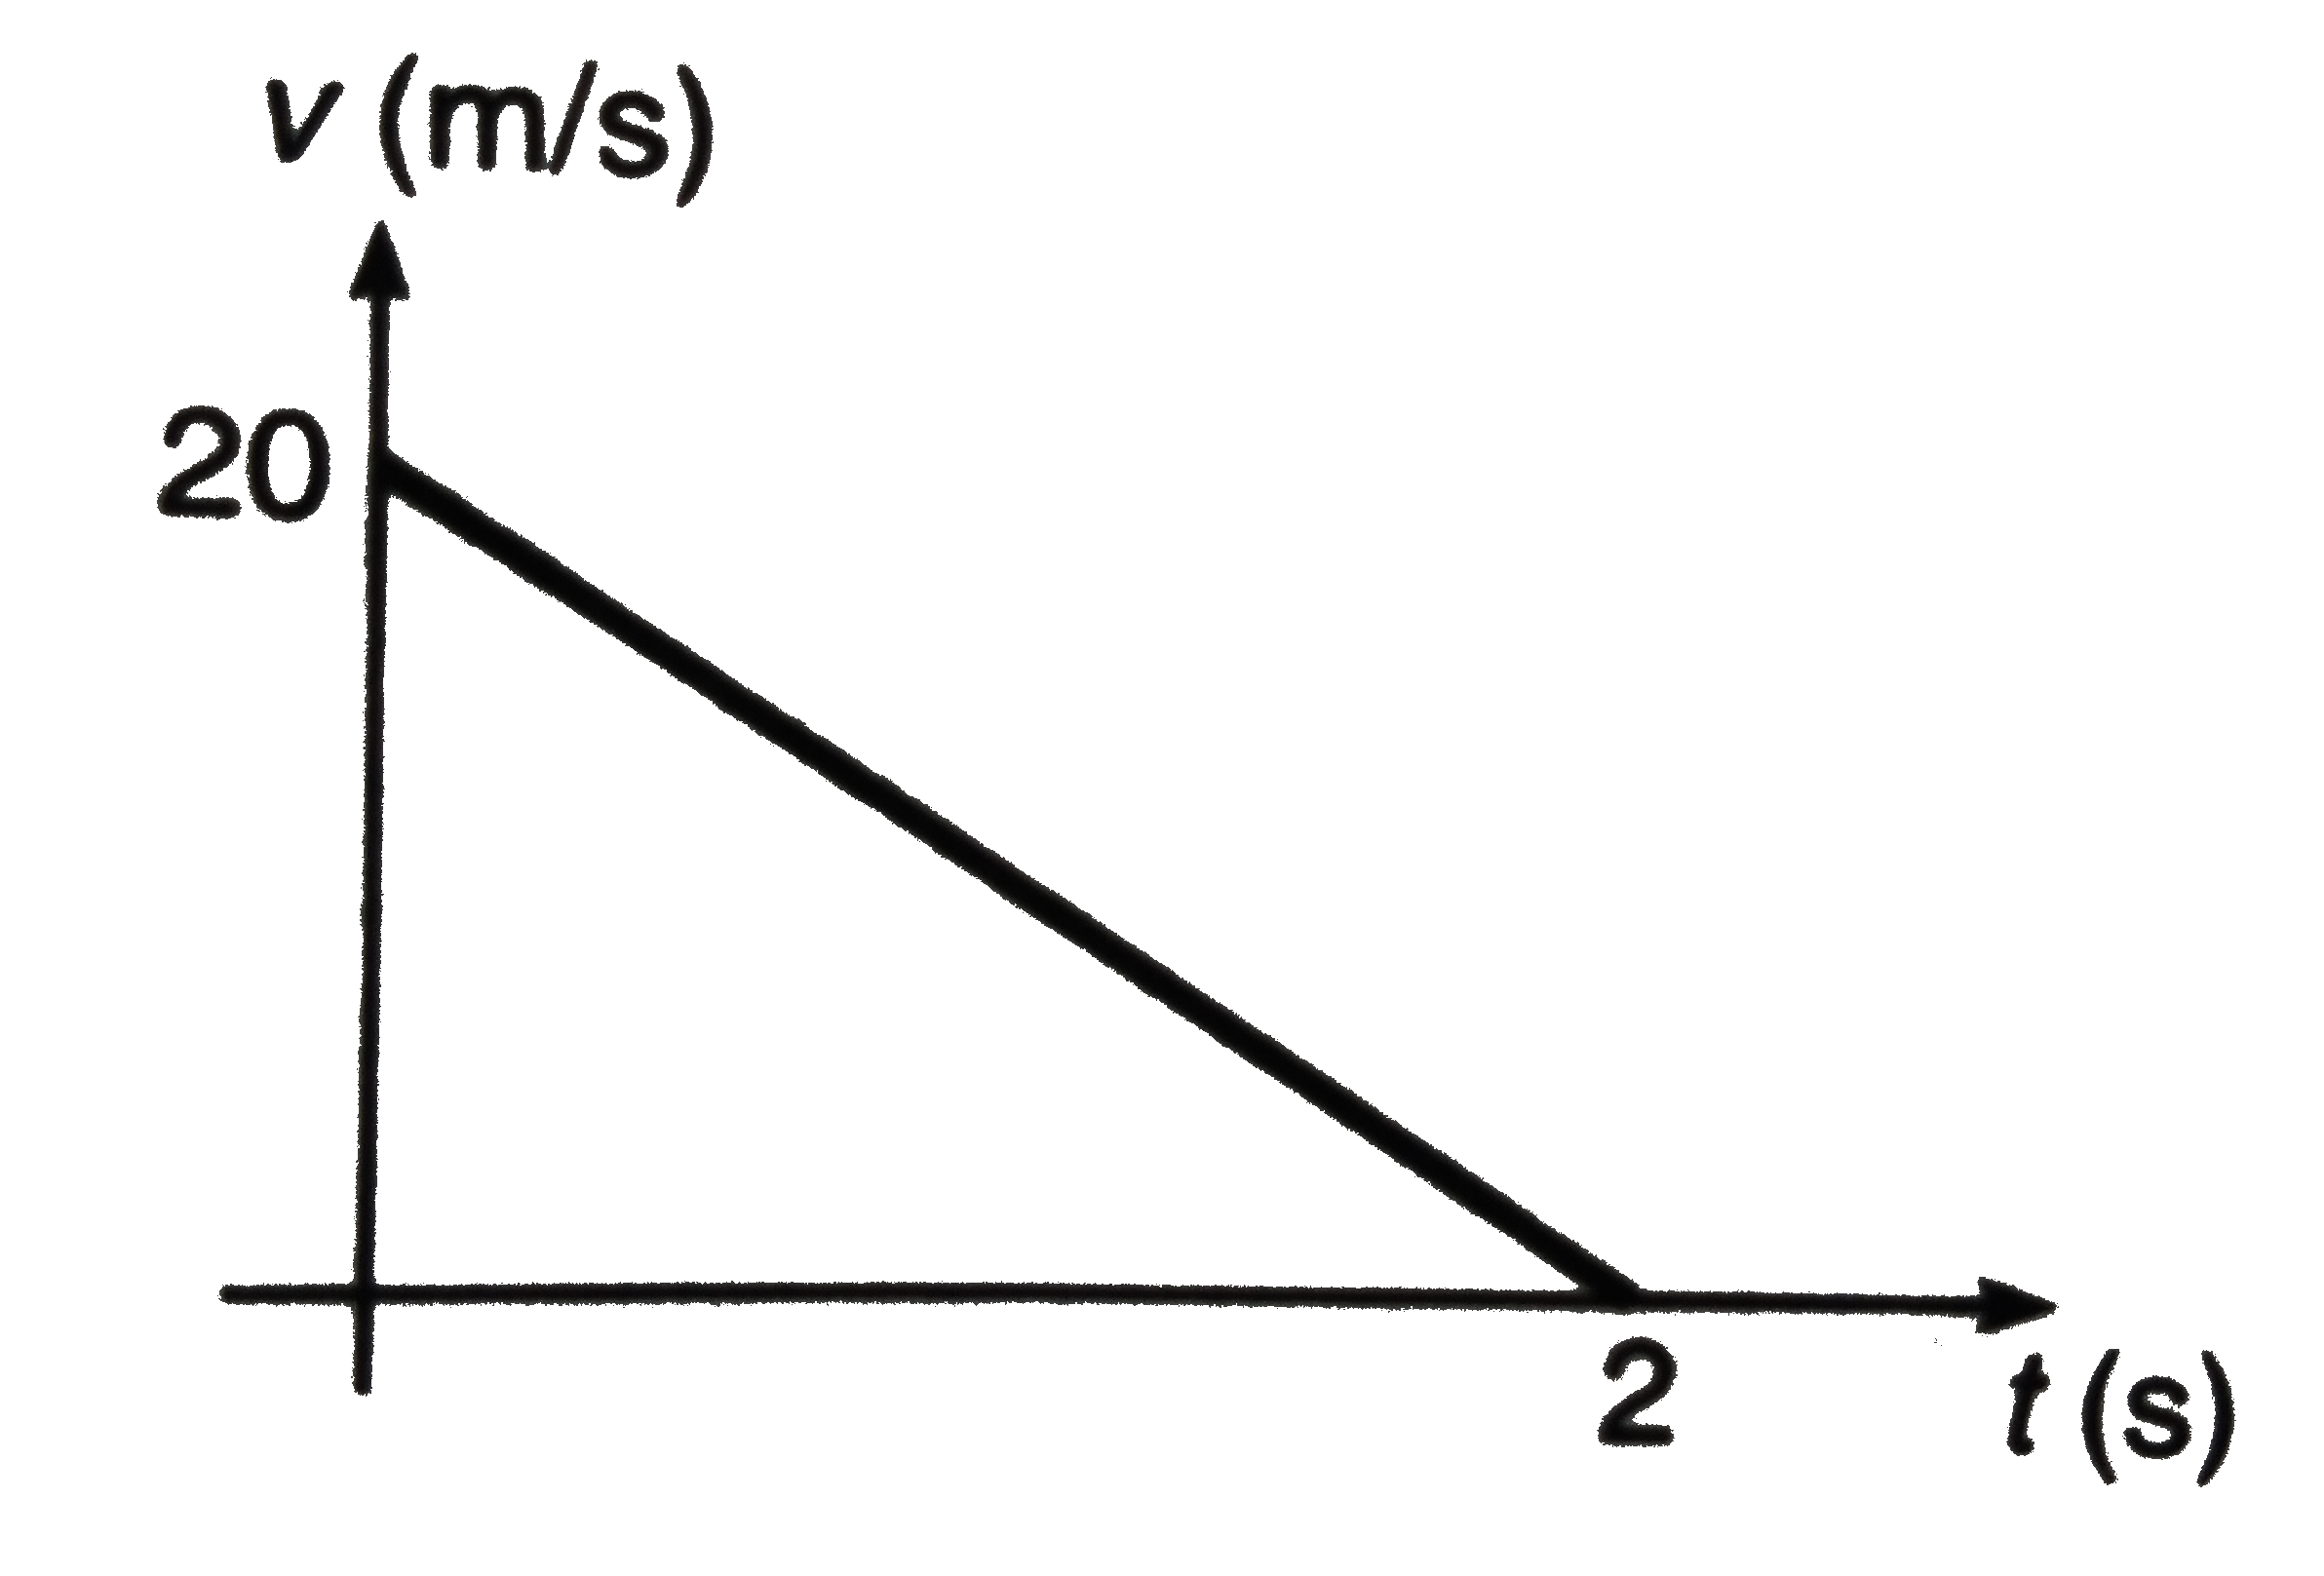
Velocity-time graph of a particle of mass (2 kg) moving in a straight line is as shown in Fig. 9.20. Find the word done by all the forces acting on the particle.
 .
.
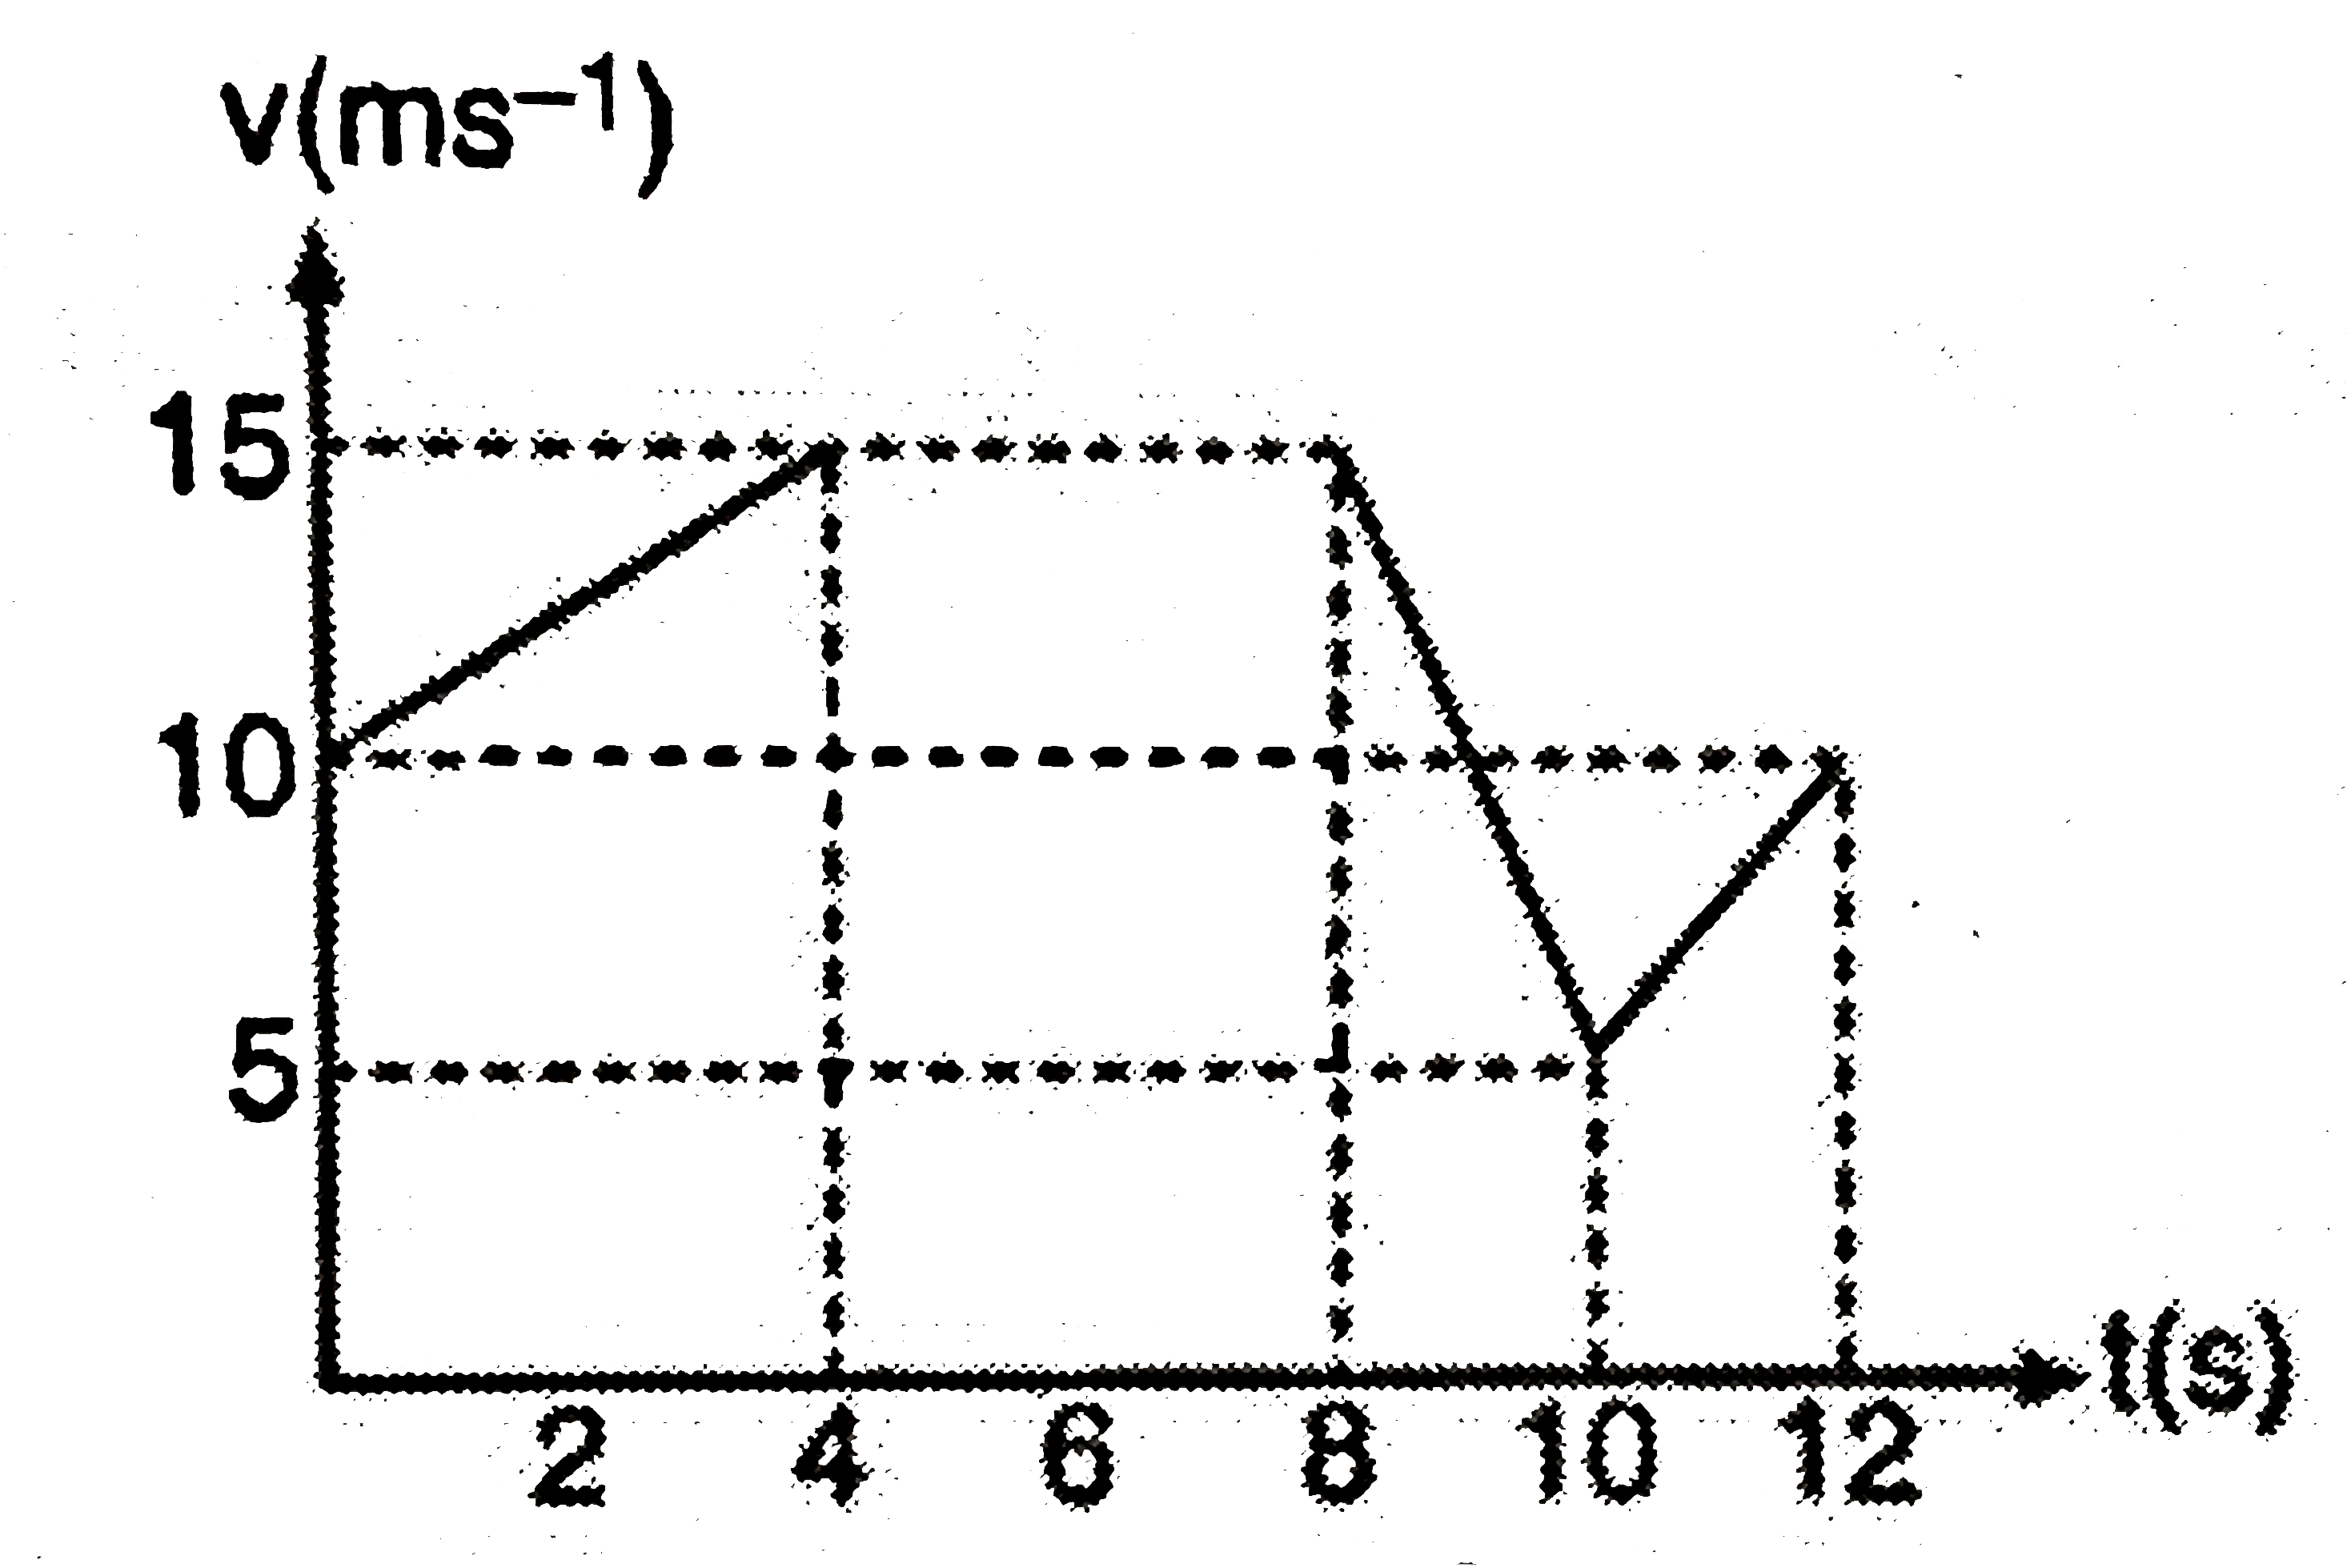
View SolutionThe velocity -time (v−t) graph of a particle moving in a straight line is shown in figure. The acceleration of the particle at t=9 is:
View Solution
Knowledge Check
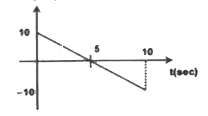
Velocity-time graph of a particle moving in a straight line is shown in the figure. Mass of the particle is 2 kg. Work done by all the forces acting on the particle in time interval t = 0 to t = 10 sec is
 A300JB−300JCzeroD−400J
Displacement time graph of a particle moving in a straight line is a shown in figure.
 Ain region A acceleration is positiveBin region B acceleration is negativeCin region C acceleration is positiveDin region D acceleration is negative
The velovity-time graph of a particle moving in a straitht line is shown in . The acceleration of the particle at t=9s is.
 .AZeroB5ms−2C−5ms−2D−2ms2
The x-t graph of a particle moving along a straight line is shown in figure
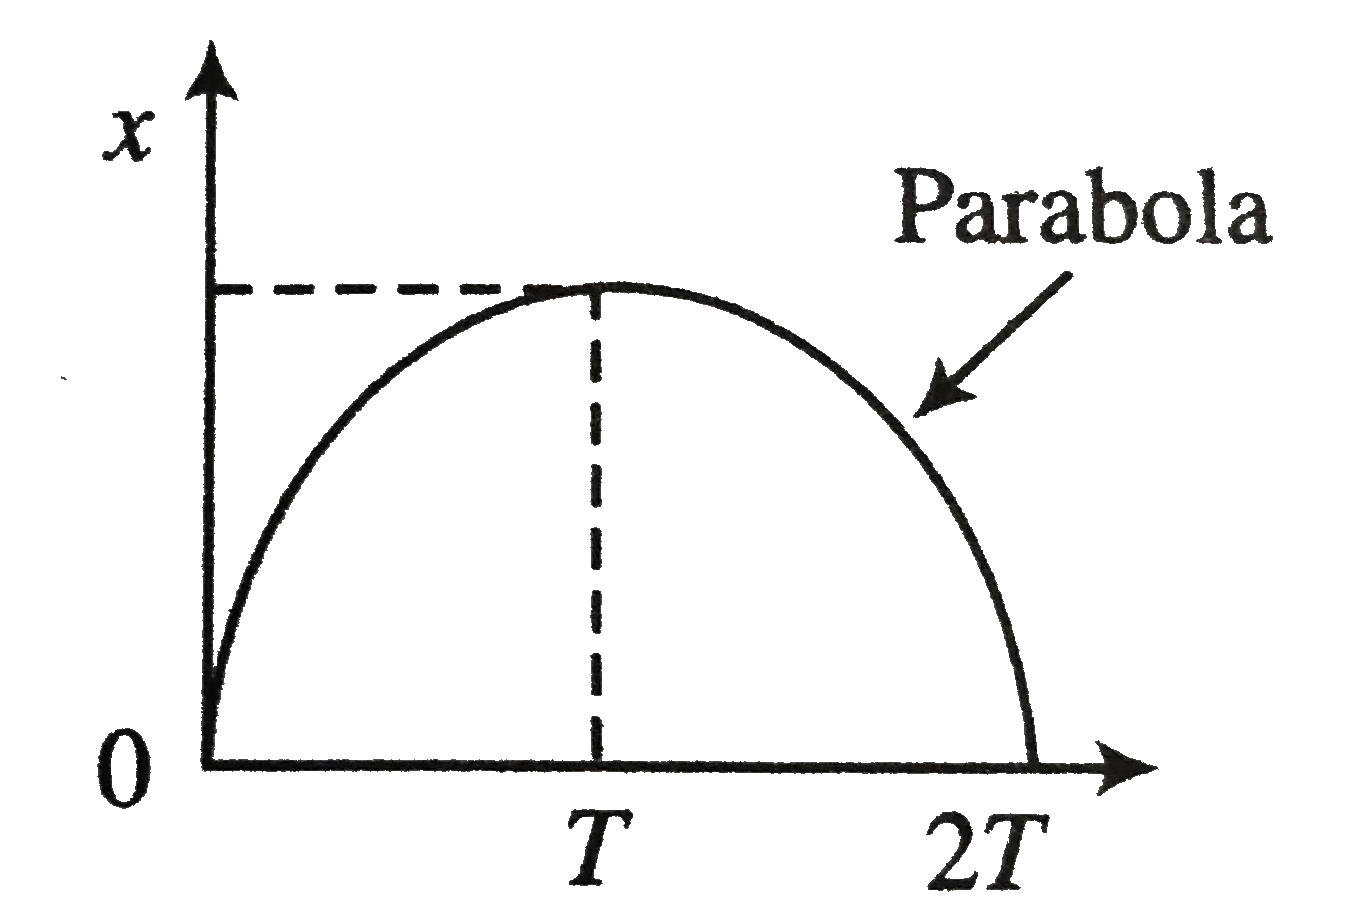
The a-t graph of the particle is correctly shown by
View SolutionThe x-t graph of a particle moving along a straight line is shown in figure

The v-t graph of the particle is correctly shown by
View SolutionThe x-t graph of a particle moving along a straight line is shown in figure
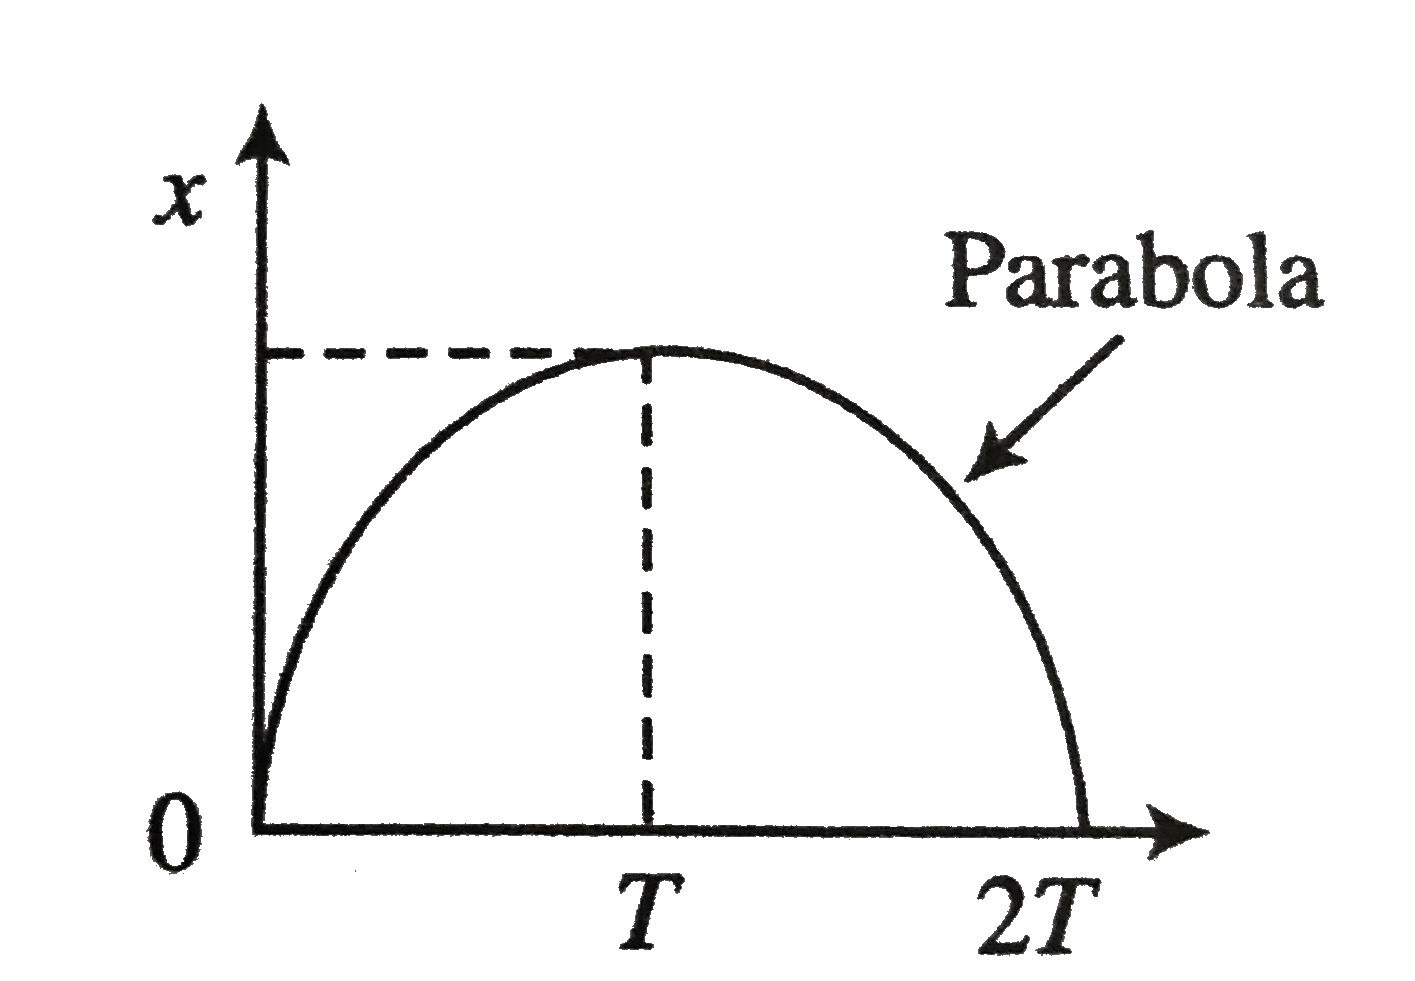
The speed-time graph of the particle is correctly shown by
View SolutionThe x−t graph of particle moving along a straight line is shown in figure
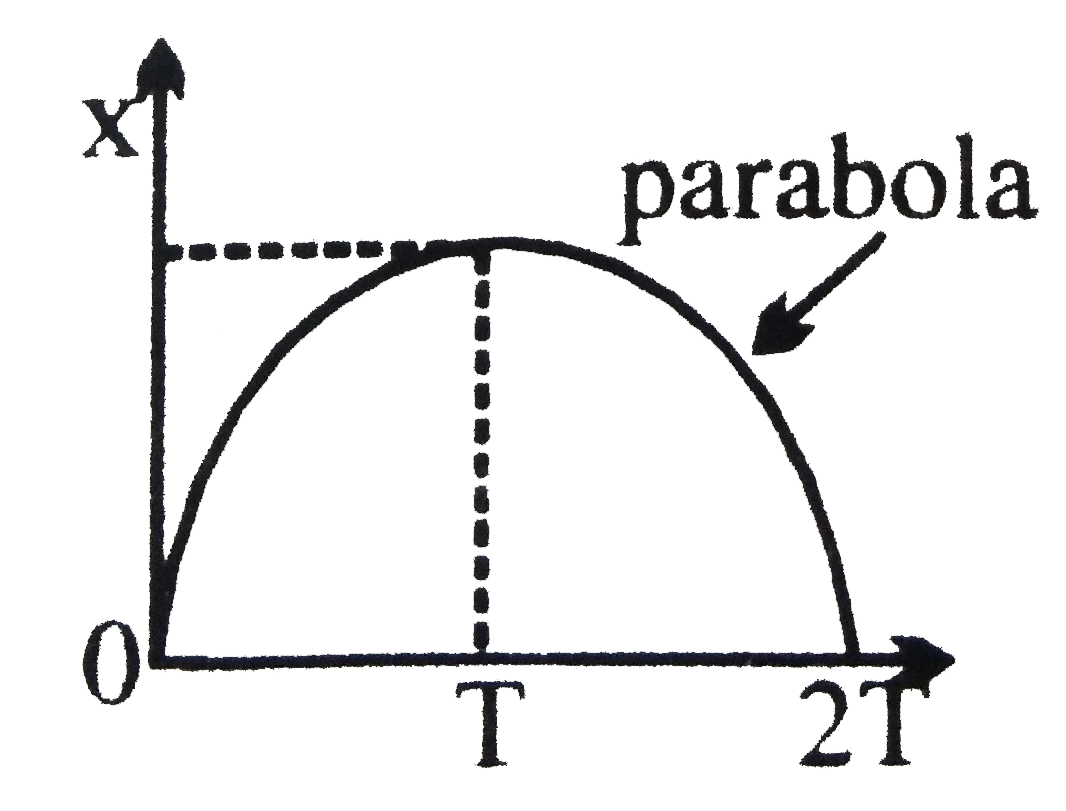
The a−t graph of the particle is correctly shown by
View SolutionThe x−t graph of particle moving along a straight line is shown in figure
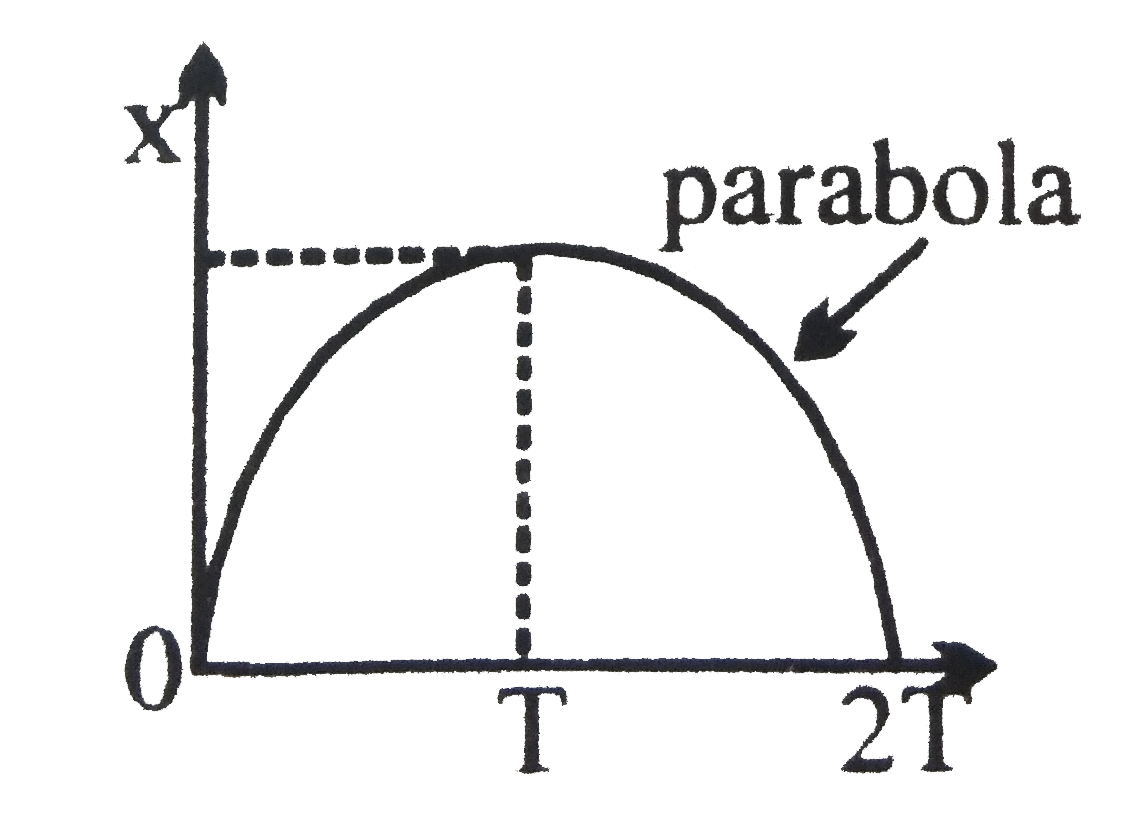
The v−t graph of the particles is correctly shown by
View Solution
