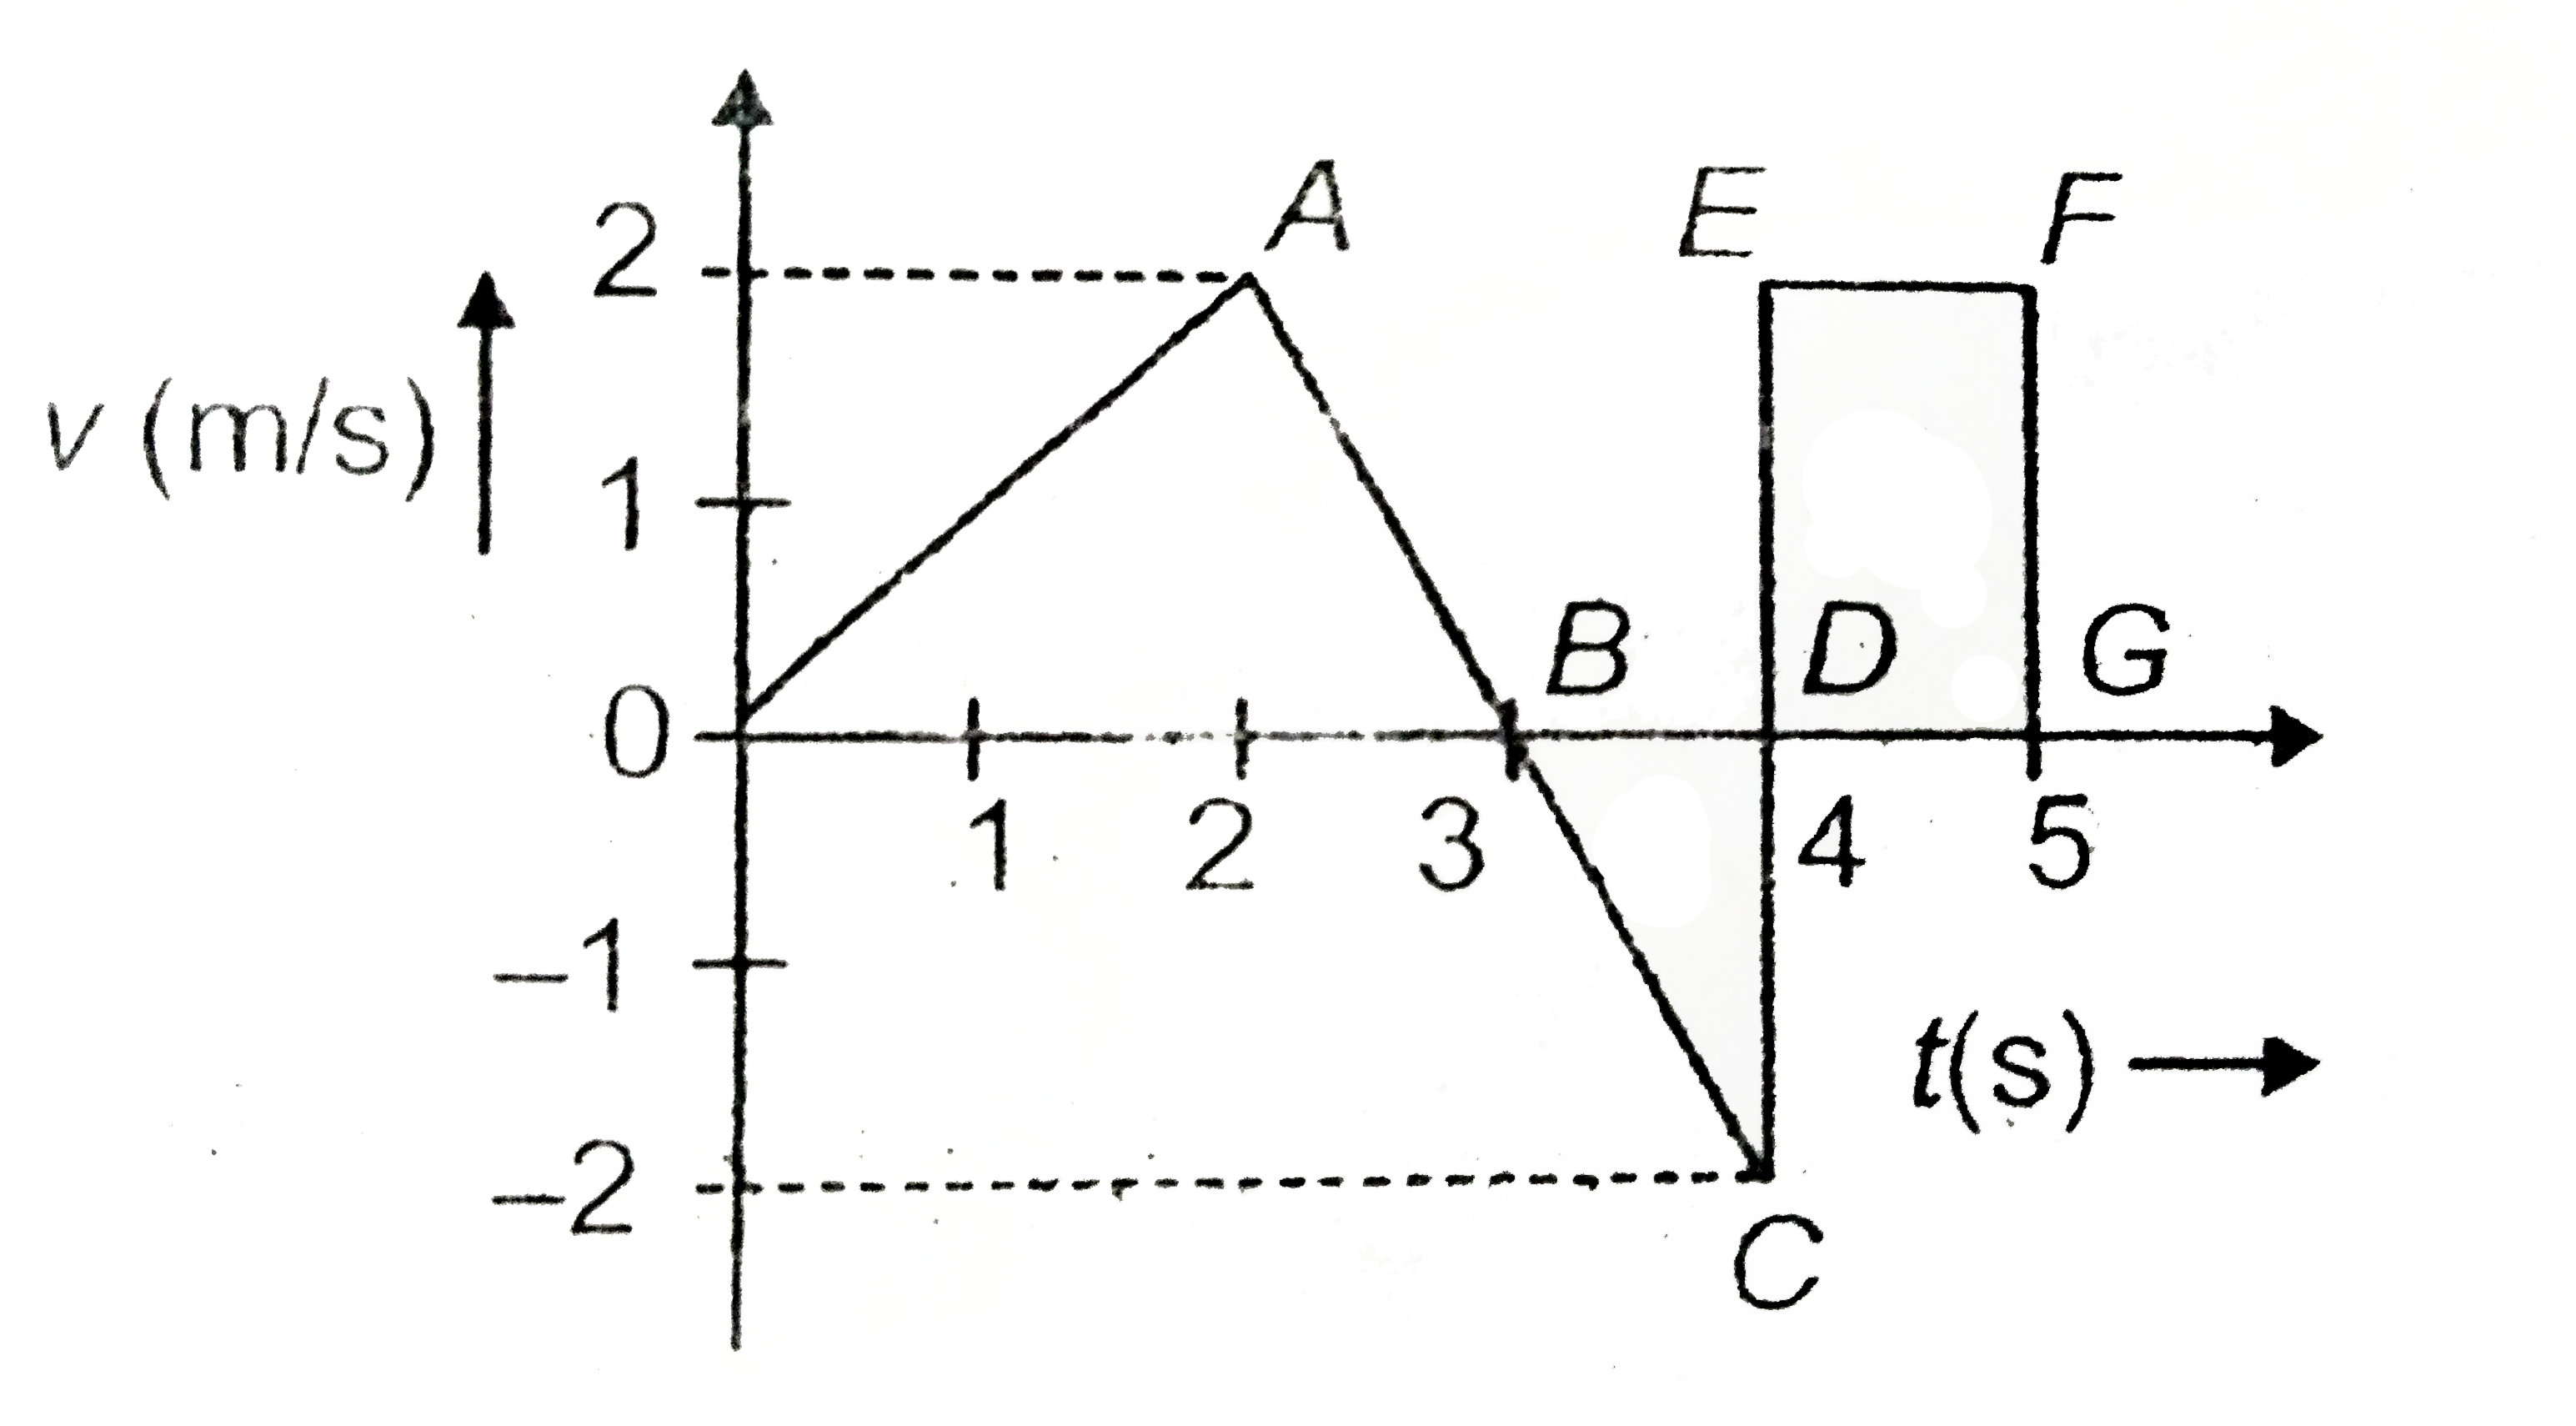
The velocity (V) – time (t) graphs for two particles A and B moving rectilinearly have been shown in the figure for an interval of 2 second.
(a) At t=1s, which of the two particles (A or B) has received a severe blow?
(b) Draw displacement (X) – time (t) graph for both of them.
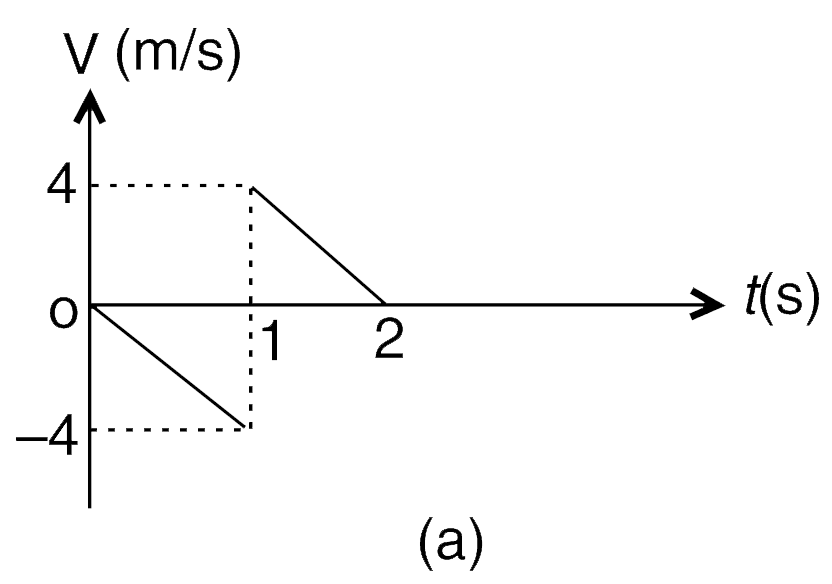
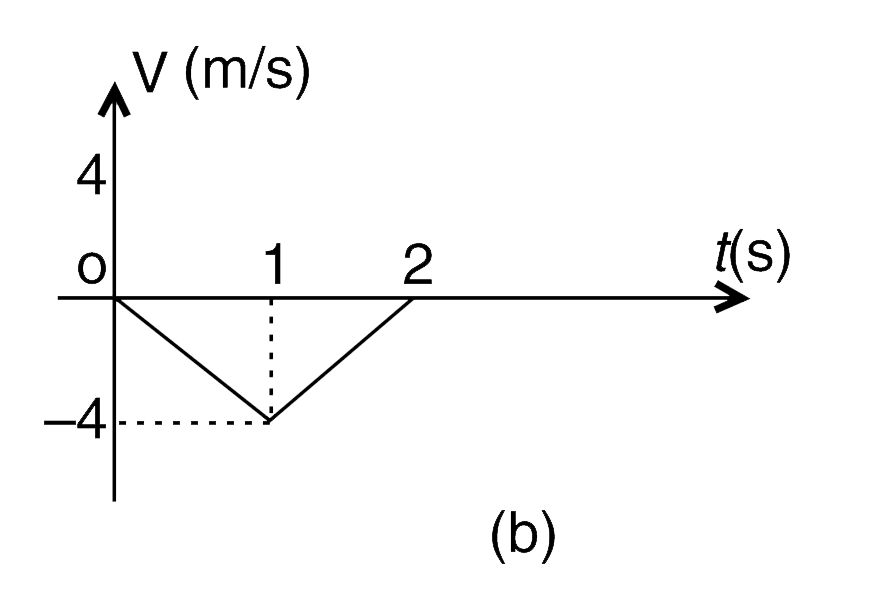
The correct Answer is:(a) particle A (b) see solution for graph
Step by step video, text & image solution for The velocity (V) – time (t) graphs for two particles A and B moving rectilinearly have been shown in the figure for an interval of 2 second. (a) At t = 1 s, which of the two particles (A or B) has received a severe blow? (b) Draw displacement (X) – time (t) graph for both of them. by Physics experts to help you in doubts & scoring excellent marks in Class 11 exams.
Updated on:21/07/2023Topper's Solved these Questions
- KINEMATICSBOOK - ARIHANTCHAPTER - KINEMATICSEXERCISE - Level 2
58 Videos
- KINEMATICSBOOK - ARIHANTCHAPTER - KINEMATICSEXERCISE - Level 3
33 Videos
- HEAT TRANSFERBOOK - ARIHANTCHAPTER - HEAT TRANSFEREXERCISE - Heat Transfer
45 Videos
- KINETIC THEORY OF GASESBOOK - ARIHANTCHAPTER - KINETIC THEORY OF GASESEXERCISE - Level 3
4 Videos
Similar Questions
Knowledge Check
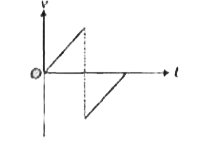
The velocity (v) - time (t) graph for a particle moving along x - axis is shown in the figure. The corresponding position (x) - time (t) is best represented by
 A
A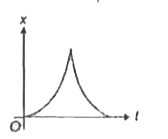 B
B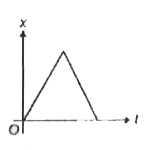 C
C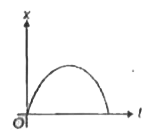 D
D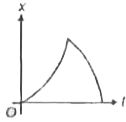
Velocity time graphs of particles A and B moving along x-axis are shown here. Both A and B start from origin:
 AMaximum separation between the particles is 8mBMaximum separation between the particles is 10mCMaximum separation between the particles occurs at t=6sDMaximum separation between the particles occurs at t=8s
The velocity -time (v−t) graph of a particle moving in a straight line is shown in figure. The acceleration of the particle at t=9 is:
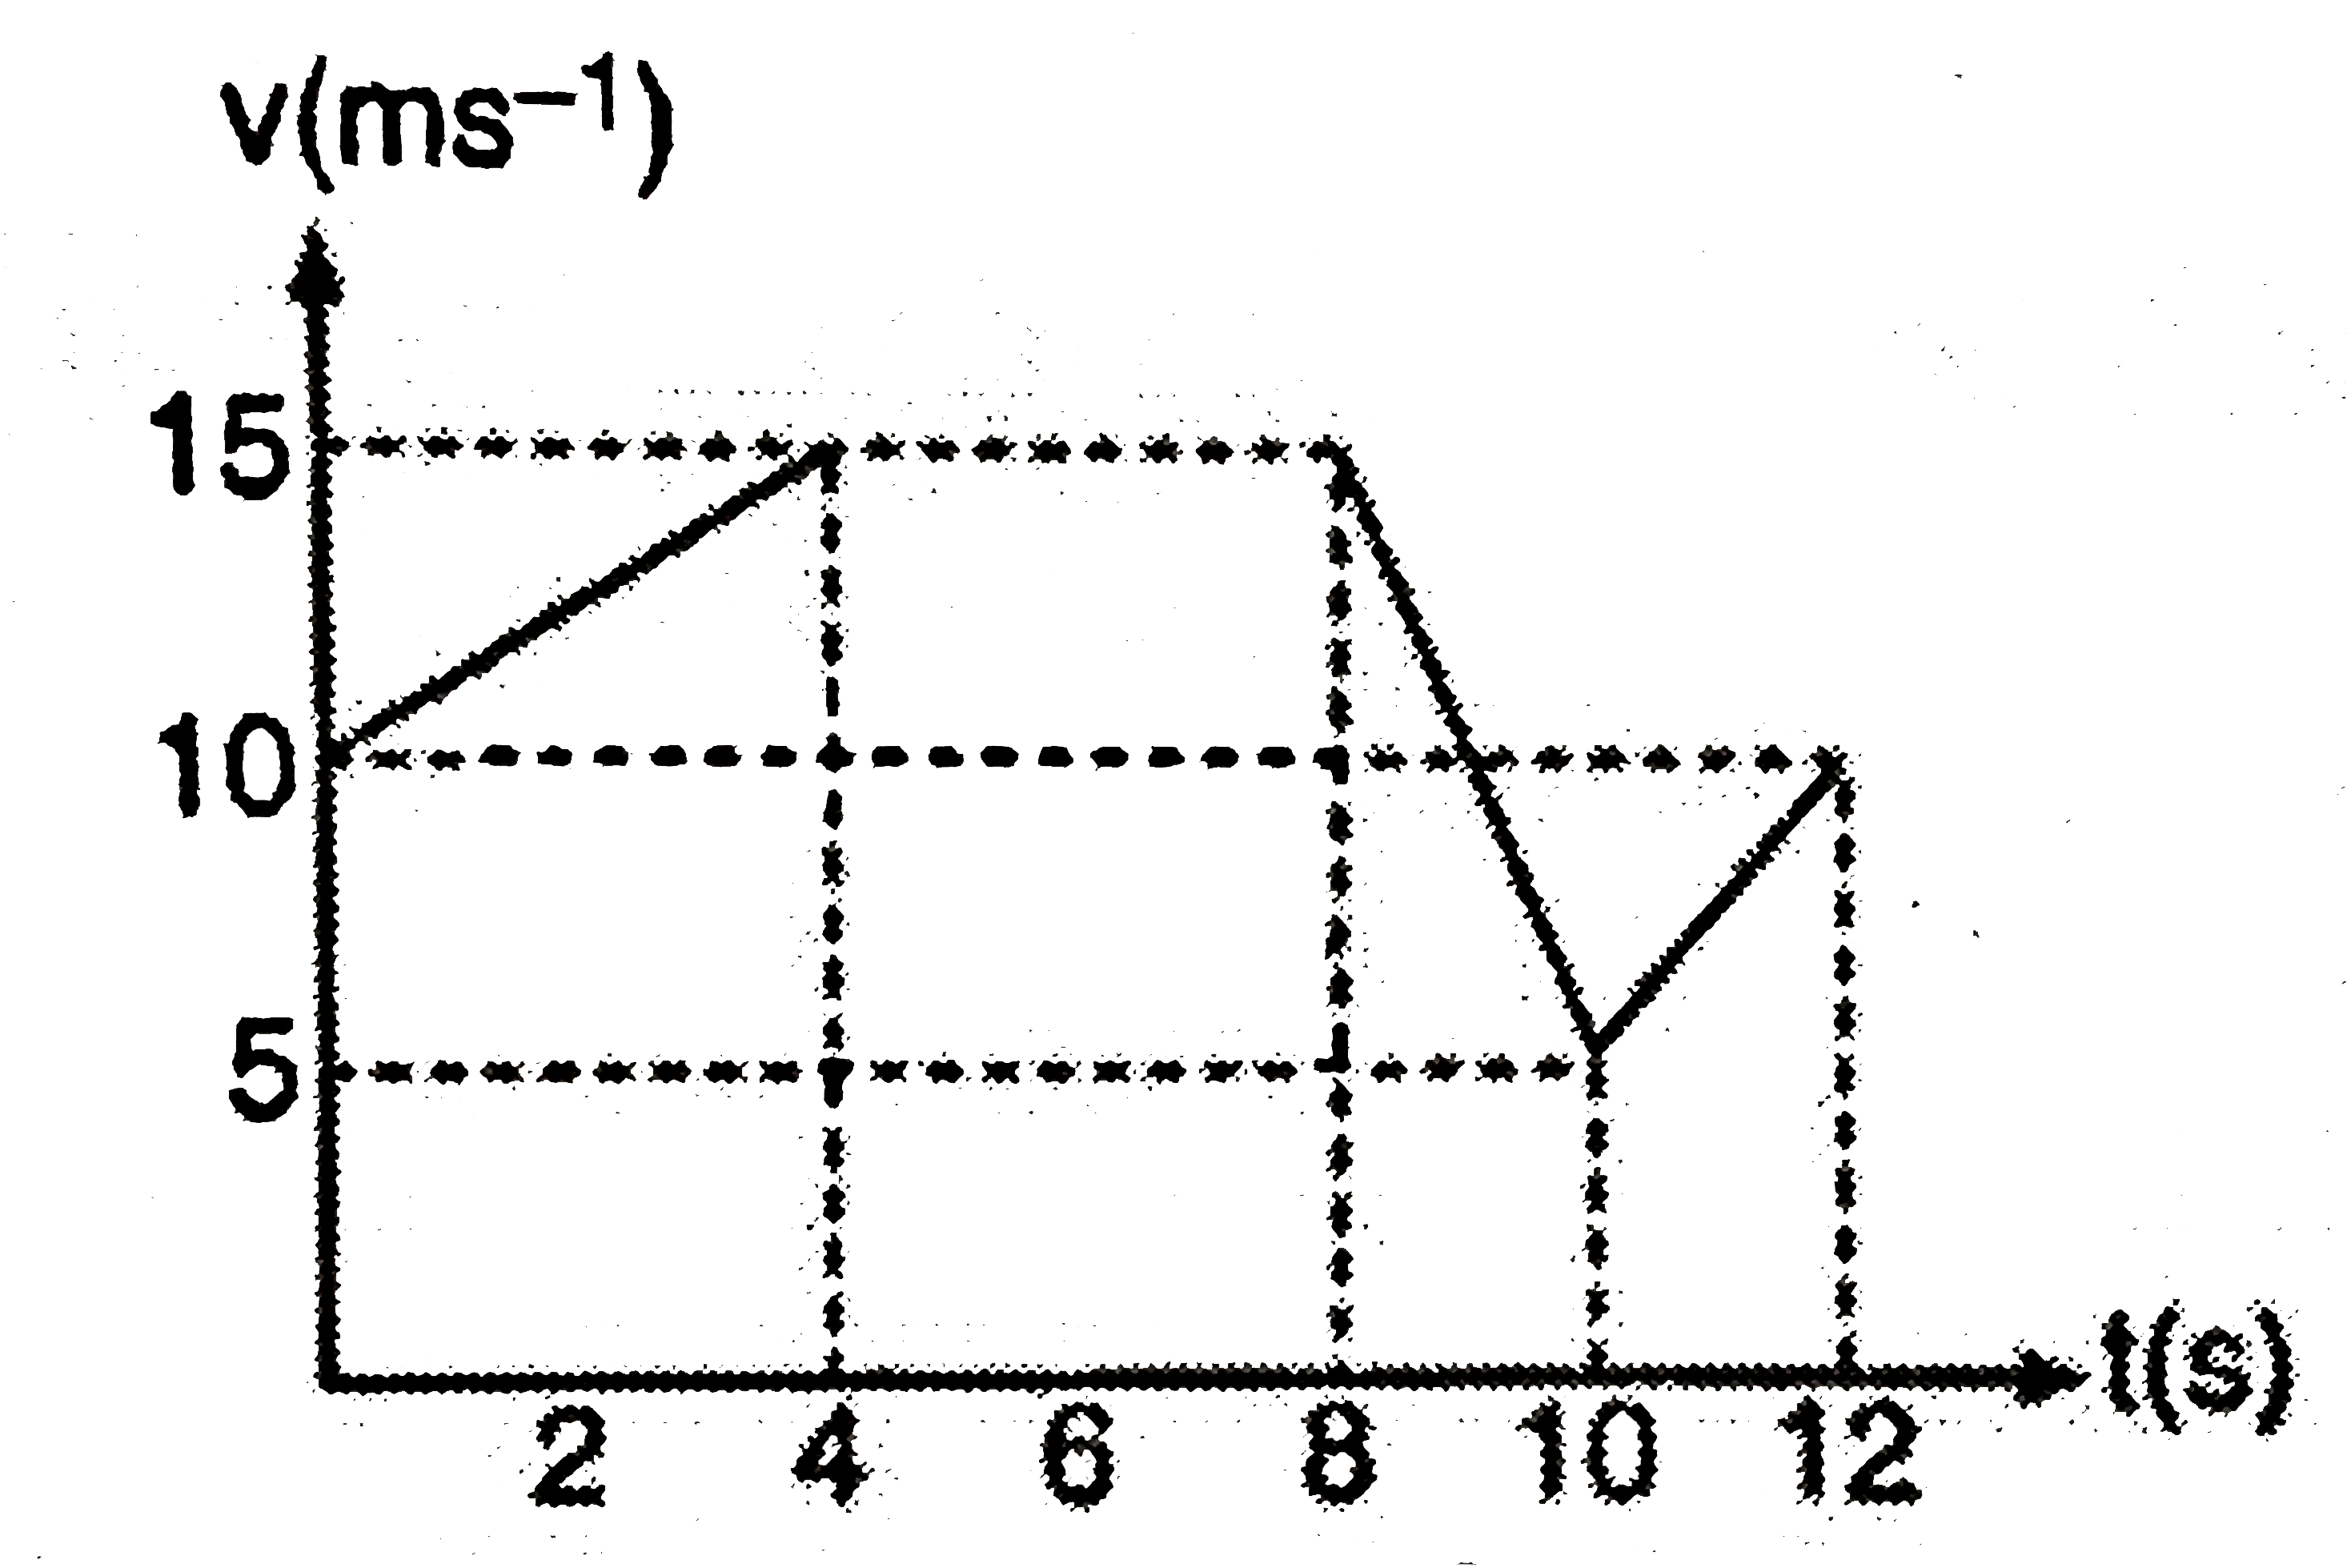 AzeroB5ms−2C−5ms2D−2ms−2
The position (x) - time (t) graph for a particle moving along a straight line is shown in figure. The average speed of particle in time interval t = 0 to t = 8 s is
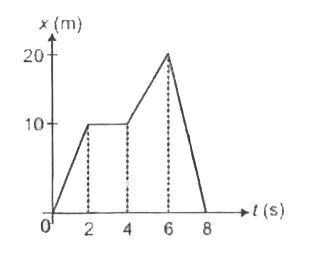
View SolutionThe velocity time graph for a particle moving along X-axis is shown in the figure. The corresponding displacement time graph is correctly shown by
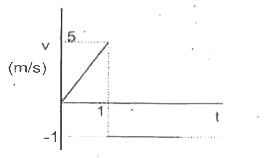
View SolutionThe velocity time graph for a particle moving along x-axis is shown in the figure. The corresponding displacement time graph is correctly shown by
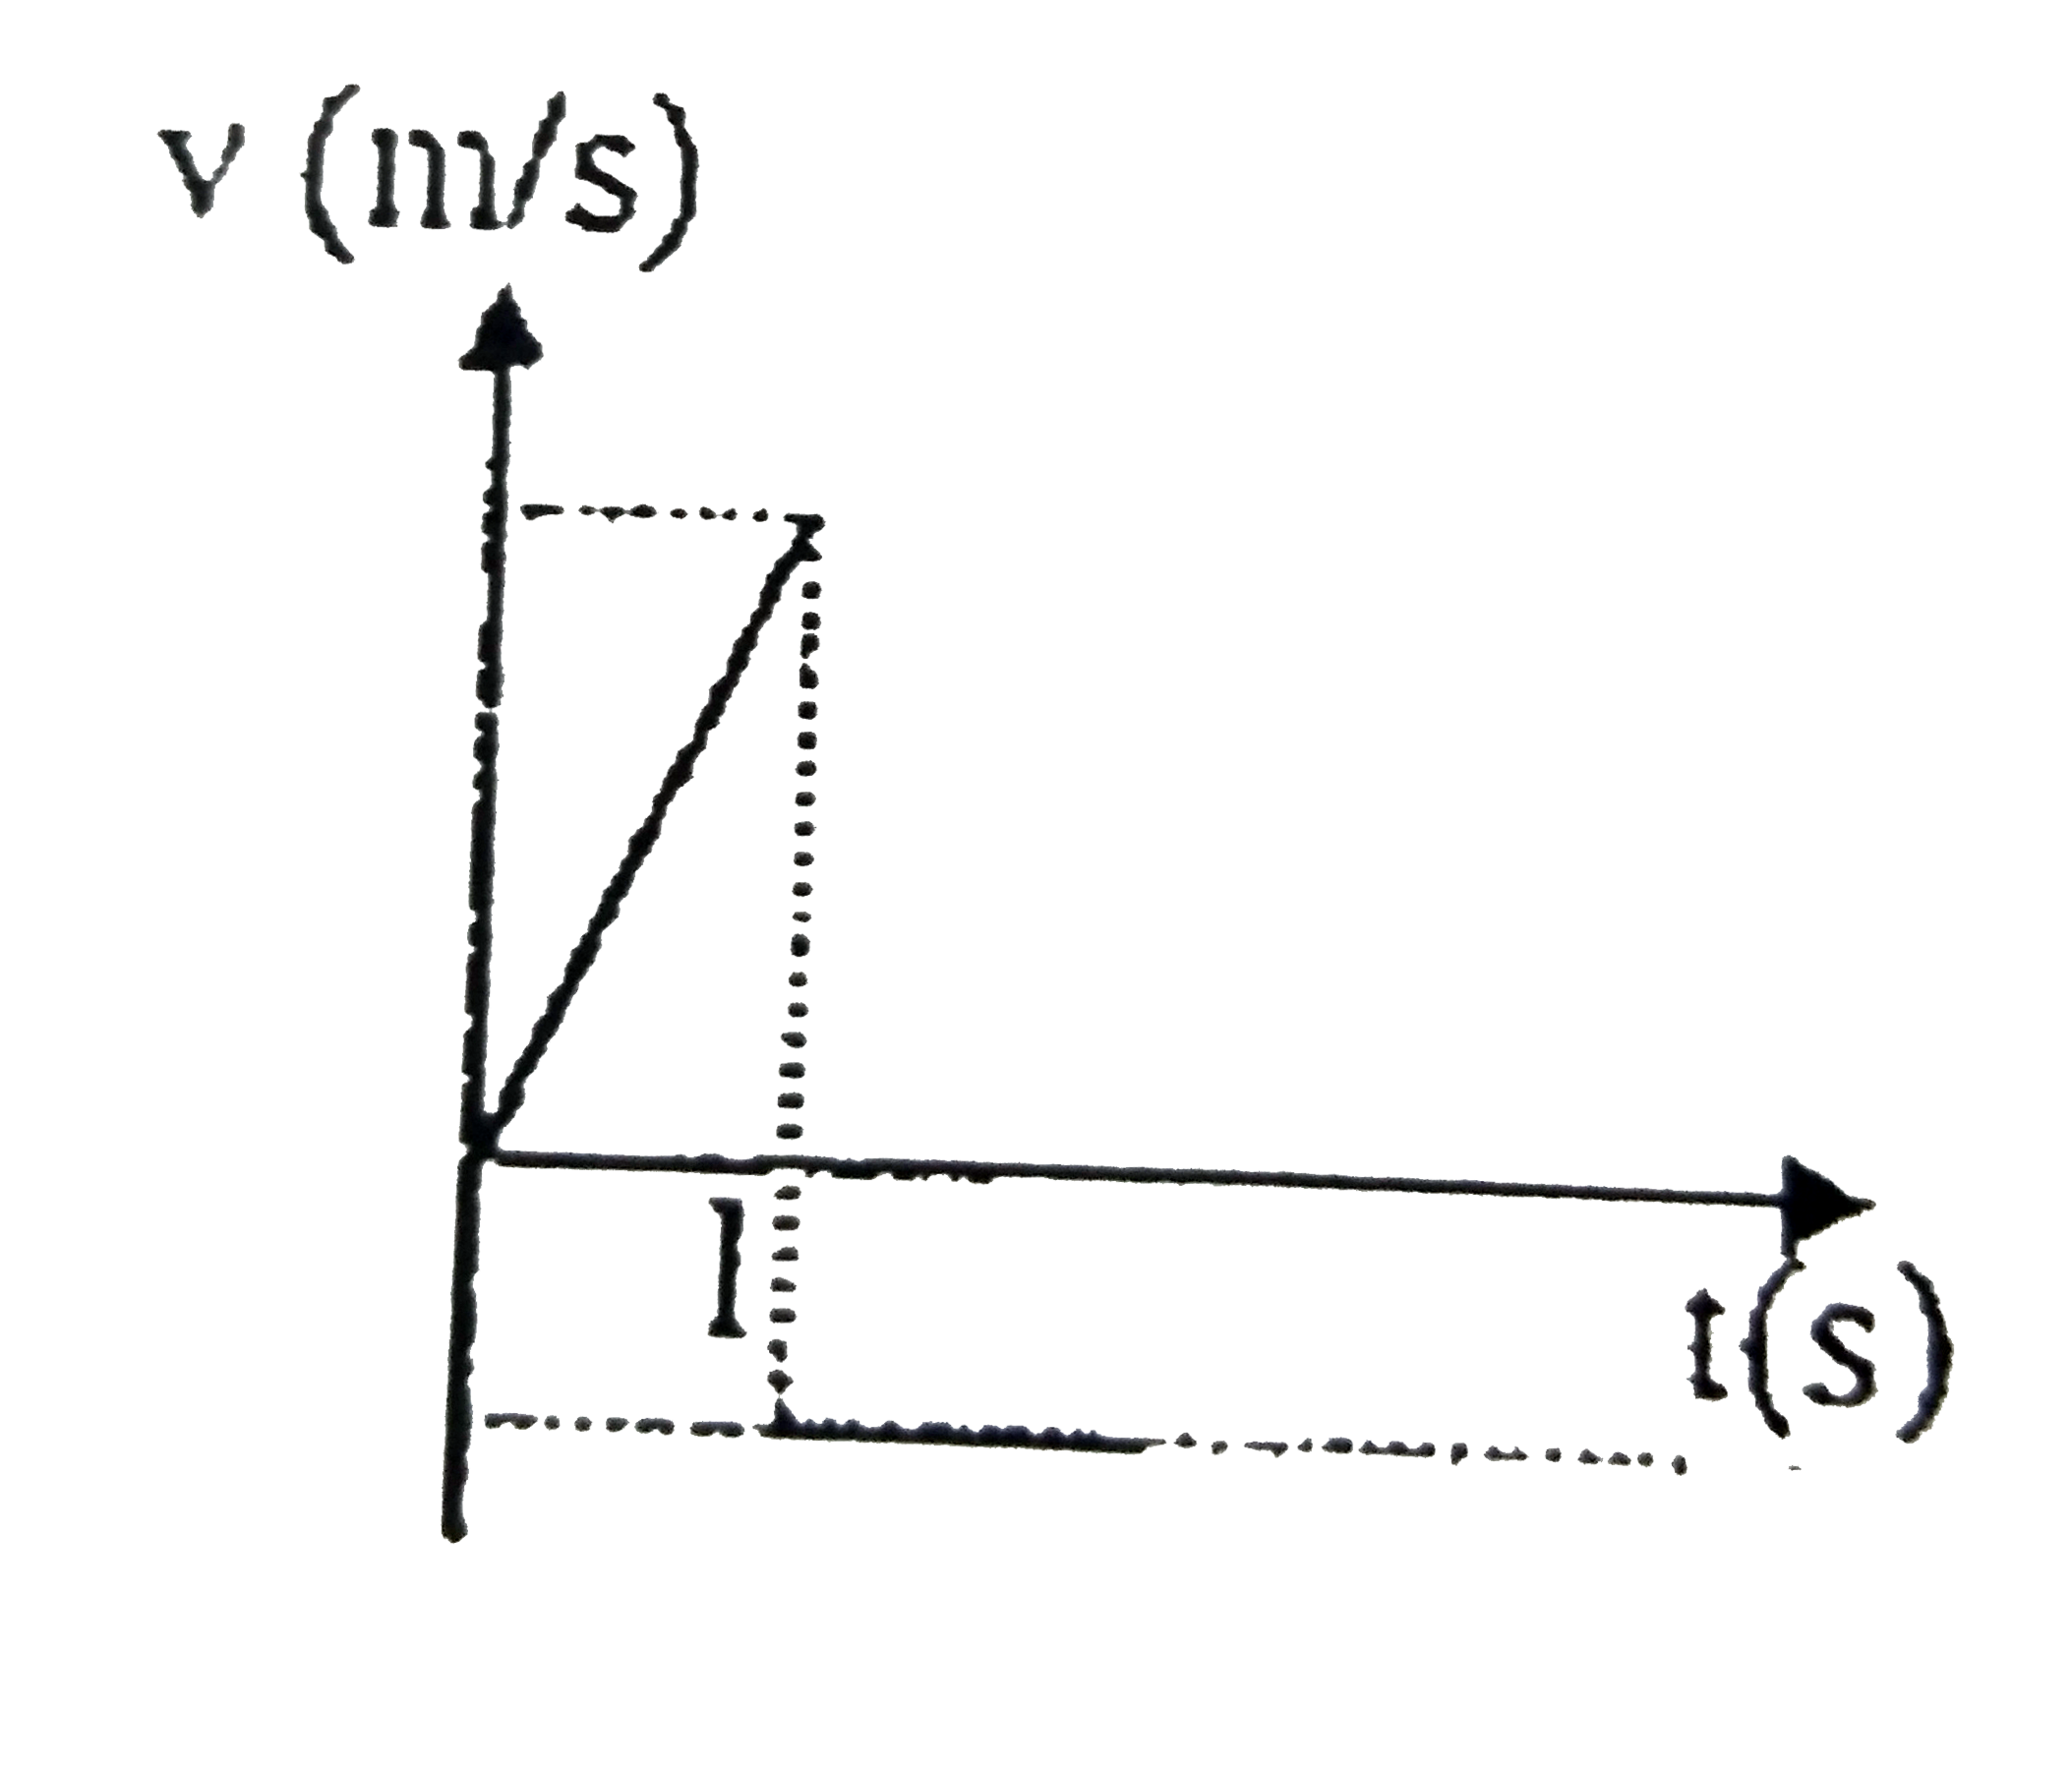
View SolutionThe velocity-time graph for a particle moving along X-axis is shown in the figure. The corresponding displacement-time graph is correctly shown by
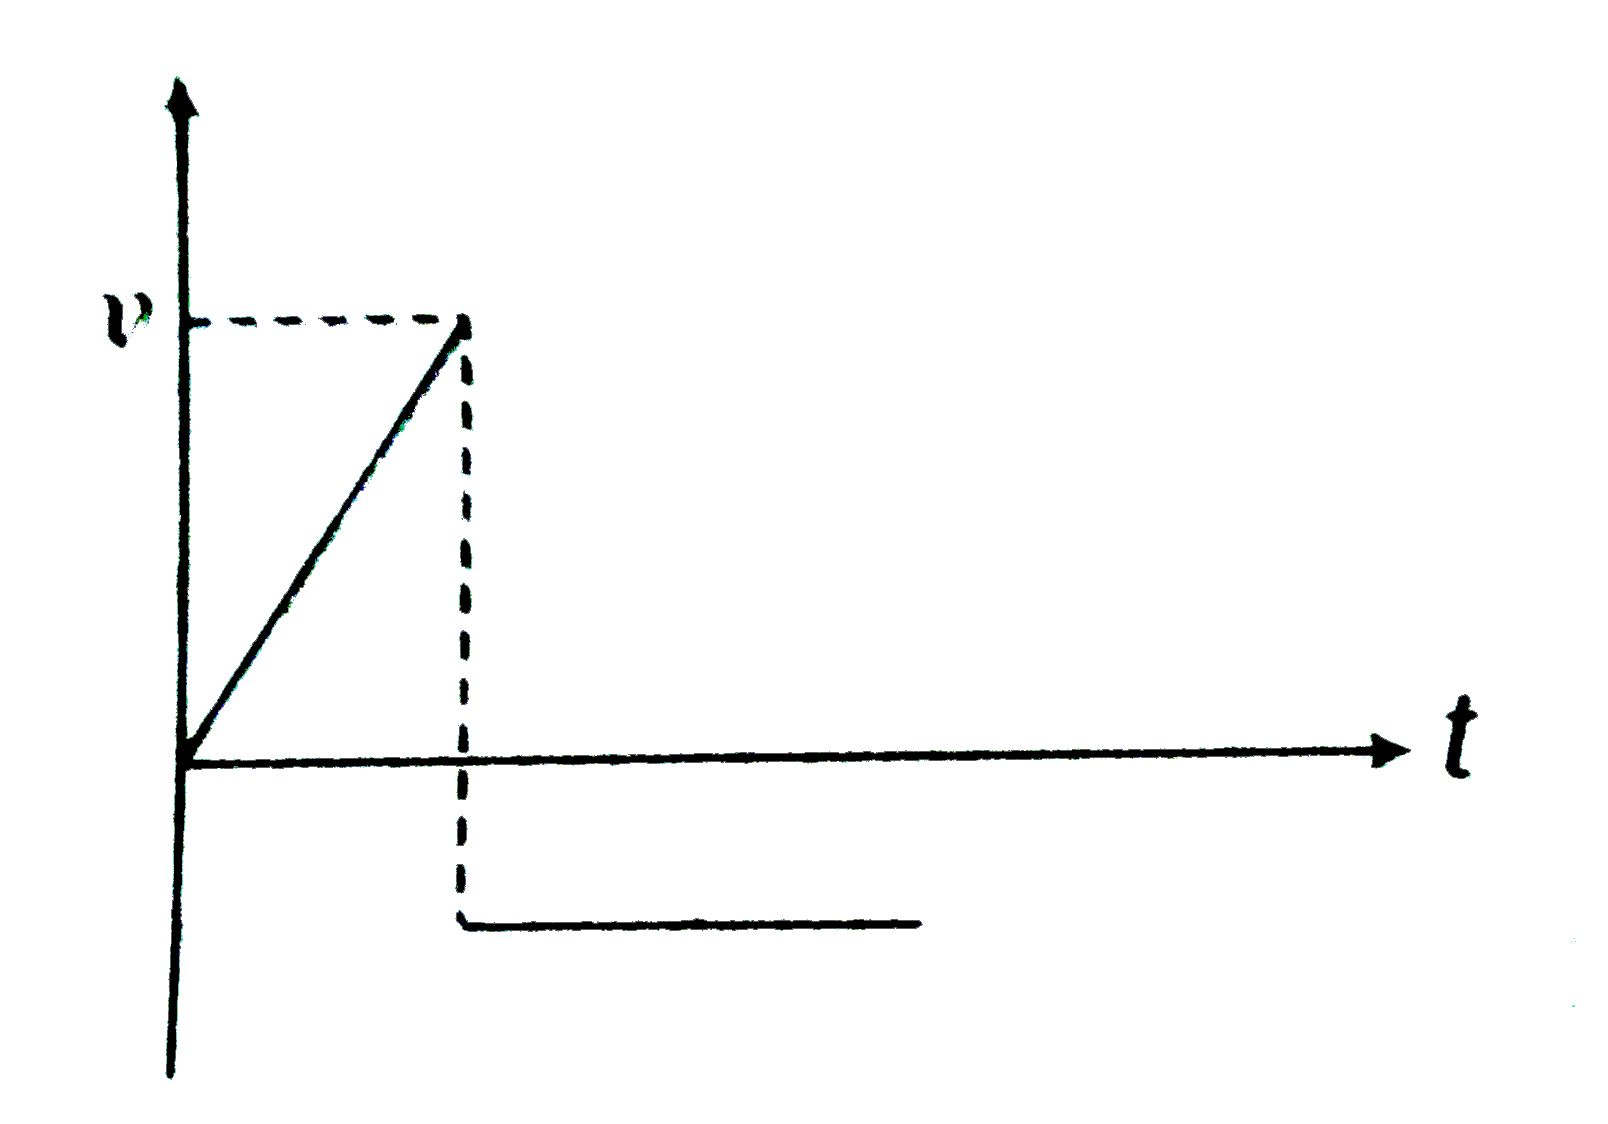
View SolutionThe velocity - time graph of a particle moving along a straight line is shown in the figure given below
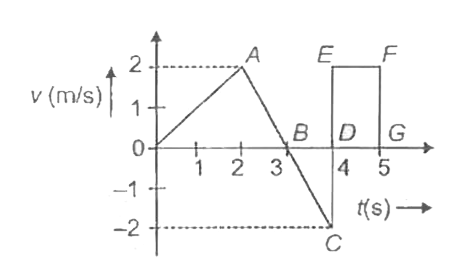
The displacement of the particle in 5 second is
View Solution

