Three containers P, Q and R made of metal are filled with chilled water, ice cubes and boiling water with vapour respectively. These containers arc kept at room temperature. Which of the following graph shows the temperature variations in all the containers correctly?
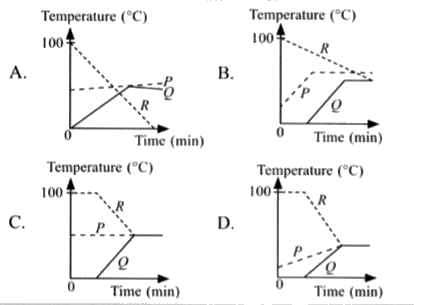
The correct Answer is:D
Initially chilled water is at some temperature greater than 0∘C but less than room temperature. Hence, temperature of chilled water increases with time. Temperature of ice cube in container Q remains zero degree centigrade for some time (till it becomes water at 0∘C) and then starts increasing with time. Temperature of boiling water with vapour in container R also remains constant for some time (till it becomes water at 100∘C) and then starts decreasing with time.
Topper's Solved these Questions
- NSO QUESTION PAPER 2017-18 SET-ABOOK - SCIENCE OLYMPIAD FOUNDATION CHAPTER - NSO QUESTION PAPER 2017-18 SET-AEXERCISE - ACHIEVERS SECTION
3 Videos
- NSO MODEL TEST PAPER -1BOOK - SCIENCE OLYMPIAD FOUNDATION CHAPTER - NSO MODEL TEST PAPER -1EXERCISE - ACHIEVERS SECTION
2 Videos
- NSO QUESTION PAPER 2017-18 SET-BBOOK - SCIENCE OLYMPIAD FOUNDATION CHAPTER - NSO QUESTION PAPER 2017-18 SET-BEXERCISE - ACHIEVERS SECTION
3 Videos
Similar Questions
In an isulated container water is stirred with a rod to increase the temperature. Which of the following is true?
View SolutionTwo thermometers A and B are dipped in water and alcohol respectively taken in two containers of similar dimensions at room temperature. Compare the temperatures shown by these two thermometers giving appropriate reasons.
View Solution
Knowledge Check
In an isulated container water is stirred with a rod to increase the temperature. Which of the following is true?
AΔU=W≠0,q=0BΔU=W=q≠0CΔU=0,W=q≠0DW=0,ΔU=q≠0Which of the following graphs shows variation between density of water and temperature?
A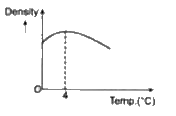 B
B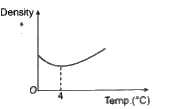 C
C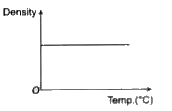 D
D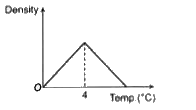
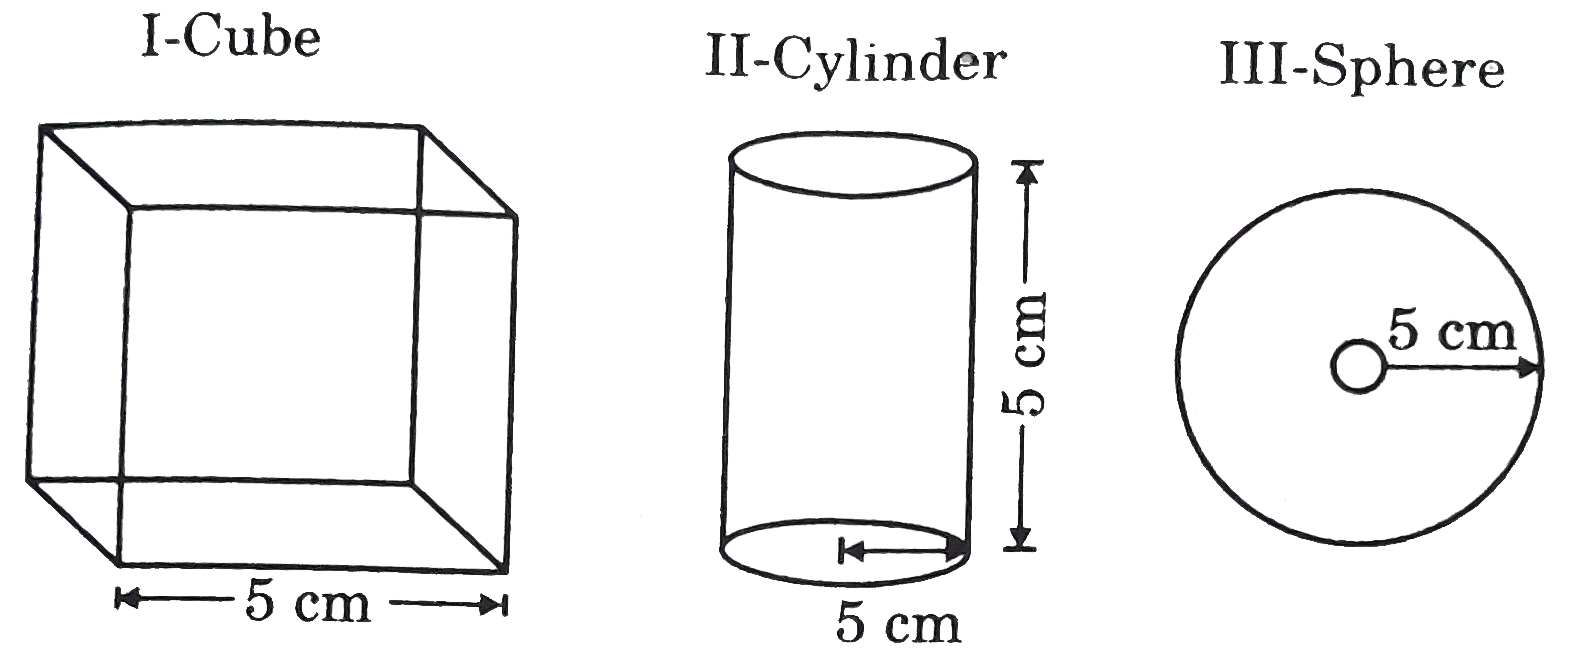
There are three closed containers in which equal moles of gas is filled if the containers are placed at the same temperature, then which of the following is correct?APressure in I is the maximum.BPressure in II is the maximum.CPressure in III is the maximum.DAll in III is the maximum.
Two thermometers A and B are dipped in water and alcohol respectively taken in two containers of similar dimensions at room temperature. Compare the temperatures shown by these two thermometers giving appropriate reasons.
View SolutionTwo containers A and B are partly filled with water and closed. The volume of A is twice that of B and it contains half the amount of water in B. If both are at the same temperature, the water vapour in the containers will have pressure in the ratio of
View SolutionIn the following experimental setup as shown in figure, equal volumes of boiling water were poured into the containers and the temperatures of both containers and contents were the same.
After an hour the temperature of container P was found to be lower than that of container Q. This shows that P is a better _____ .

View SolutionTwo containers A and B are partly filled with water and closed. The volume of A is twice that of B and it contains half the amount of water in B. If both are at the same temperature, the water vapour in the containers will have pressure in the ratio of
View SolutionThe pressure of the gas filled in thermally insulated container is P and temperature is T. If the ratio of specific heats of the gas is γ, which of the following will be constant -
View Solution
