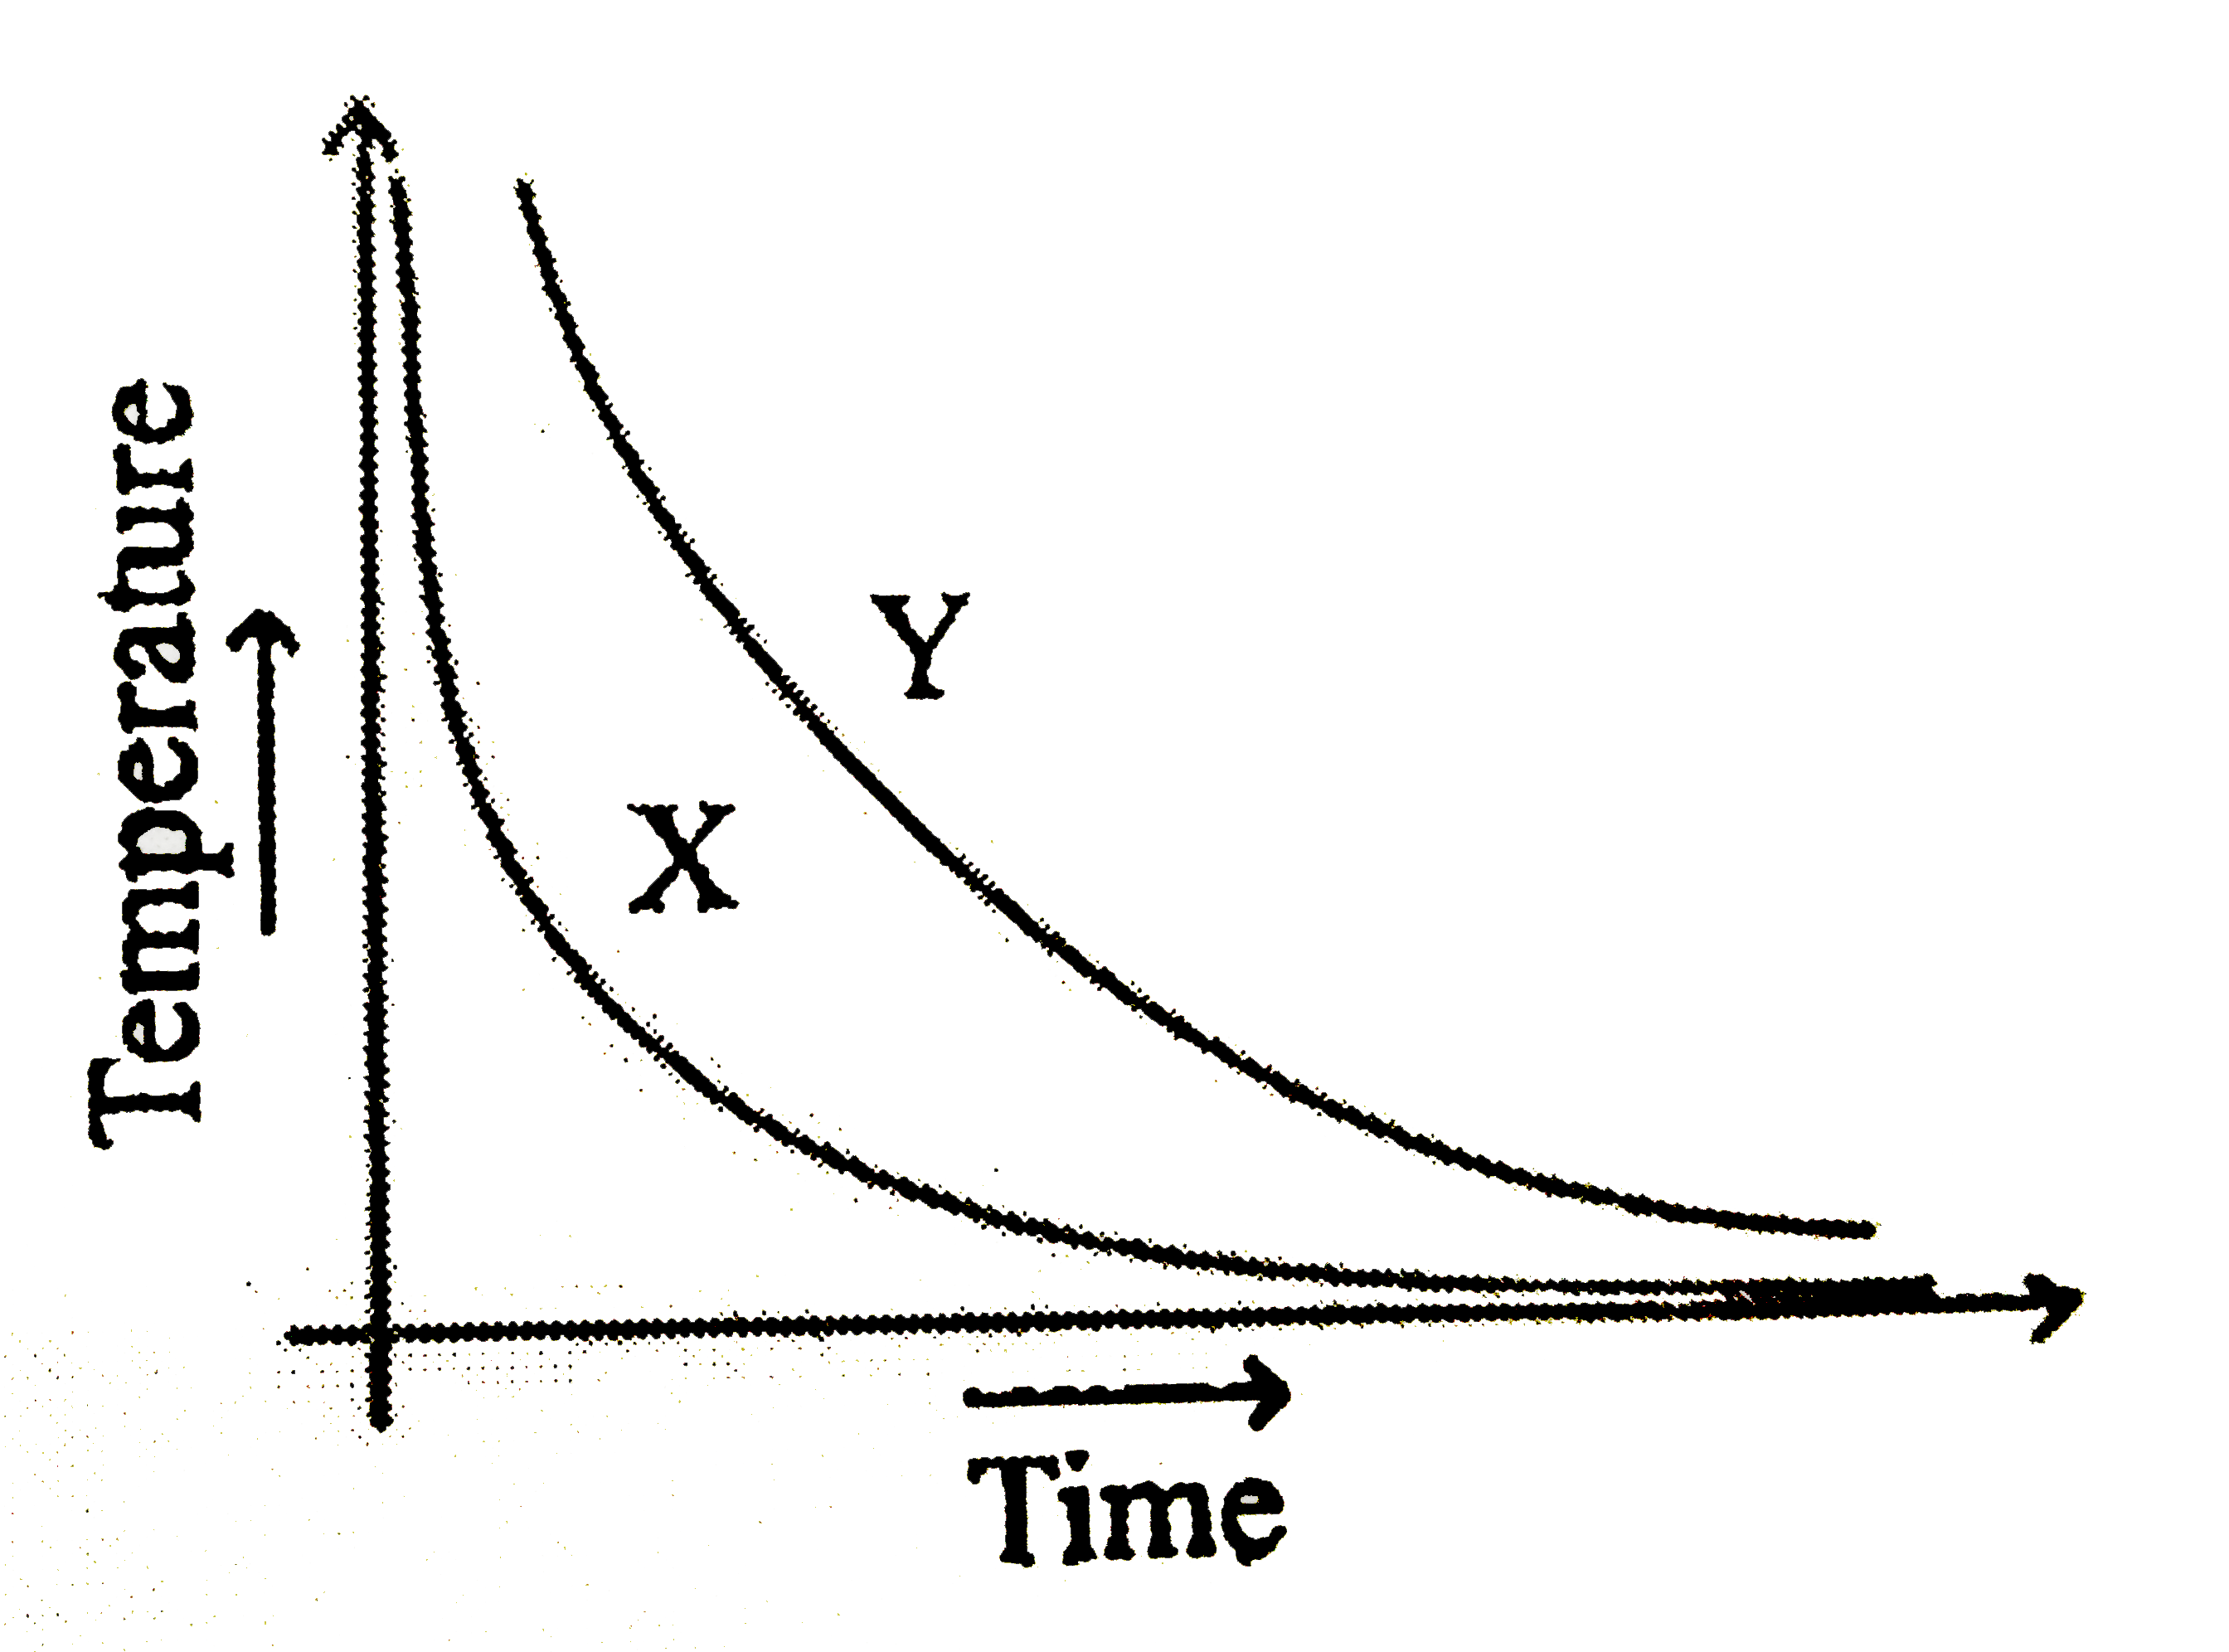
Two students X and Y have to do their experiment on plotting the temperature-time graph for a hot body as it cools to room temperature. They do their experiments in the same lab, using completely identical apparatus, take equal amounts of tap water heated up to the same temperature, start their observations simultaneously and note the temperature values at identically spaced intervals of time. Their temperature-time graphs, plotted on a given graph paper, with the same given choices of scales along the axis, are however, as shown: The following could be the reason for this difference:
(A) Use of an overhead fan by student X.
(B) Use of an overhead fan by student Y.
(C) Less frequent stirring of water by student X.
(D) Less frequent stirring of water by student Y.
The most likely reason is:

A
B
C
D
The correct Answer is:A
Step by step video, text & image solution for Two students X and Y have to do their experiment on plotting the temperature-time graph for a hot body as it cools to room temperature. They do their experiments in the same lab, using completely identical apparatus, take equal amounts of tap water heated up to the same temperature, start their observations simultaneously and note the temperature values at identically spaced intervals of time. Their temperature-time graphs, plotted on a given graph paper, with the same given choices of scales along the axis, are however, as shown: The following could be the reason for this difference: (A) Use of an overhead fan by student X. (B) Use of an overhead fan by student Y. (C) Less frequent stirring of water by student X. (D) Less frequent stirring of water by student Y. The most likely reason is: by Physics experts to help you in doubts & scoring excellent marks in Class 9 exams.
Updated on:21/07/2023Topper's Solved these Questions
- SOUNDBOOK - LAKHMIR SINGH & MANJIT KAURCHAPTER - SOUNDEXERCISE - NCERT
5 Videos
- SOUNDBOOK - LAKHMIR SINGH & MANJIT KAURCHAPTER - SOUNDEXERCISE - Value Based Questions
20 Videos
- SOUNDBOOK - LAKHMIR SINGH & MANJIT KAURCHAPTER - SOUNDEXERCISE - HOTS
8 Videos
- MOTION BOOK - LAKHMIR SINGH & MANJIT KAURCHAPTER - MOTION EXERCISE - NCERT BOOK QUESTIONS AND EXERCISES
3 Videos
- WORK AND ENERGYBOOK - LAKHMIR SINGH & MANJIT KAURCHAPTER - WORK AND ENERGYEXERCISE - Multiple Choice Questions
1 Video
Similar Questions
Knowledge Check
While doing an experiment on plotting the temperaure-time graph of hot water as it cools, we can get a good graph:
Aonly by noting the temperature of hot water every 30 seconds throughoutBonly by noting the temperature of hot water every 1 minute throughoutCby noting the temperature of hot water every 1 minute to start with and every 2 minutes later onDby noting the temperature of hot water every 2 minutes to start with and every 1 minute later onAt the time of melting the temperature of the body
Aremains constantBincreasesCdecreasesDNone of theseThe temperature-time graphs obtained in Newton's cooling experiment is
Aa straight line with positive slopeBa straight line with negative slopeCa curve with positive slopeDa curve with negative
When a hot body warms a cool one, are their temperature changes equal in magnitude?
View SolutionIf the temperature of the body θ and time of cooling 't' and room temperature of the surrounding θ0. The cooling curve is
View SolutionEqual volumes of two liquids A and B are heated to the same temperature and left in the atmosphere in identical vessels.
View SolutionFour identical copper cylinders are painted If they are all heated to the same temperature and left in vacuum which will cool most rapidly .
View SolutionA hollow and a solid sphere of same material and identical outer surface under identical condition are heated to the same temperature at the same time (both have same e, a):
View Solution
