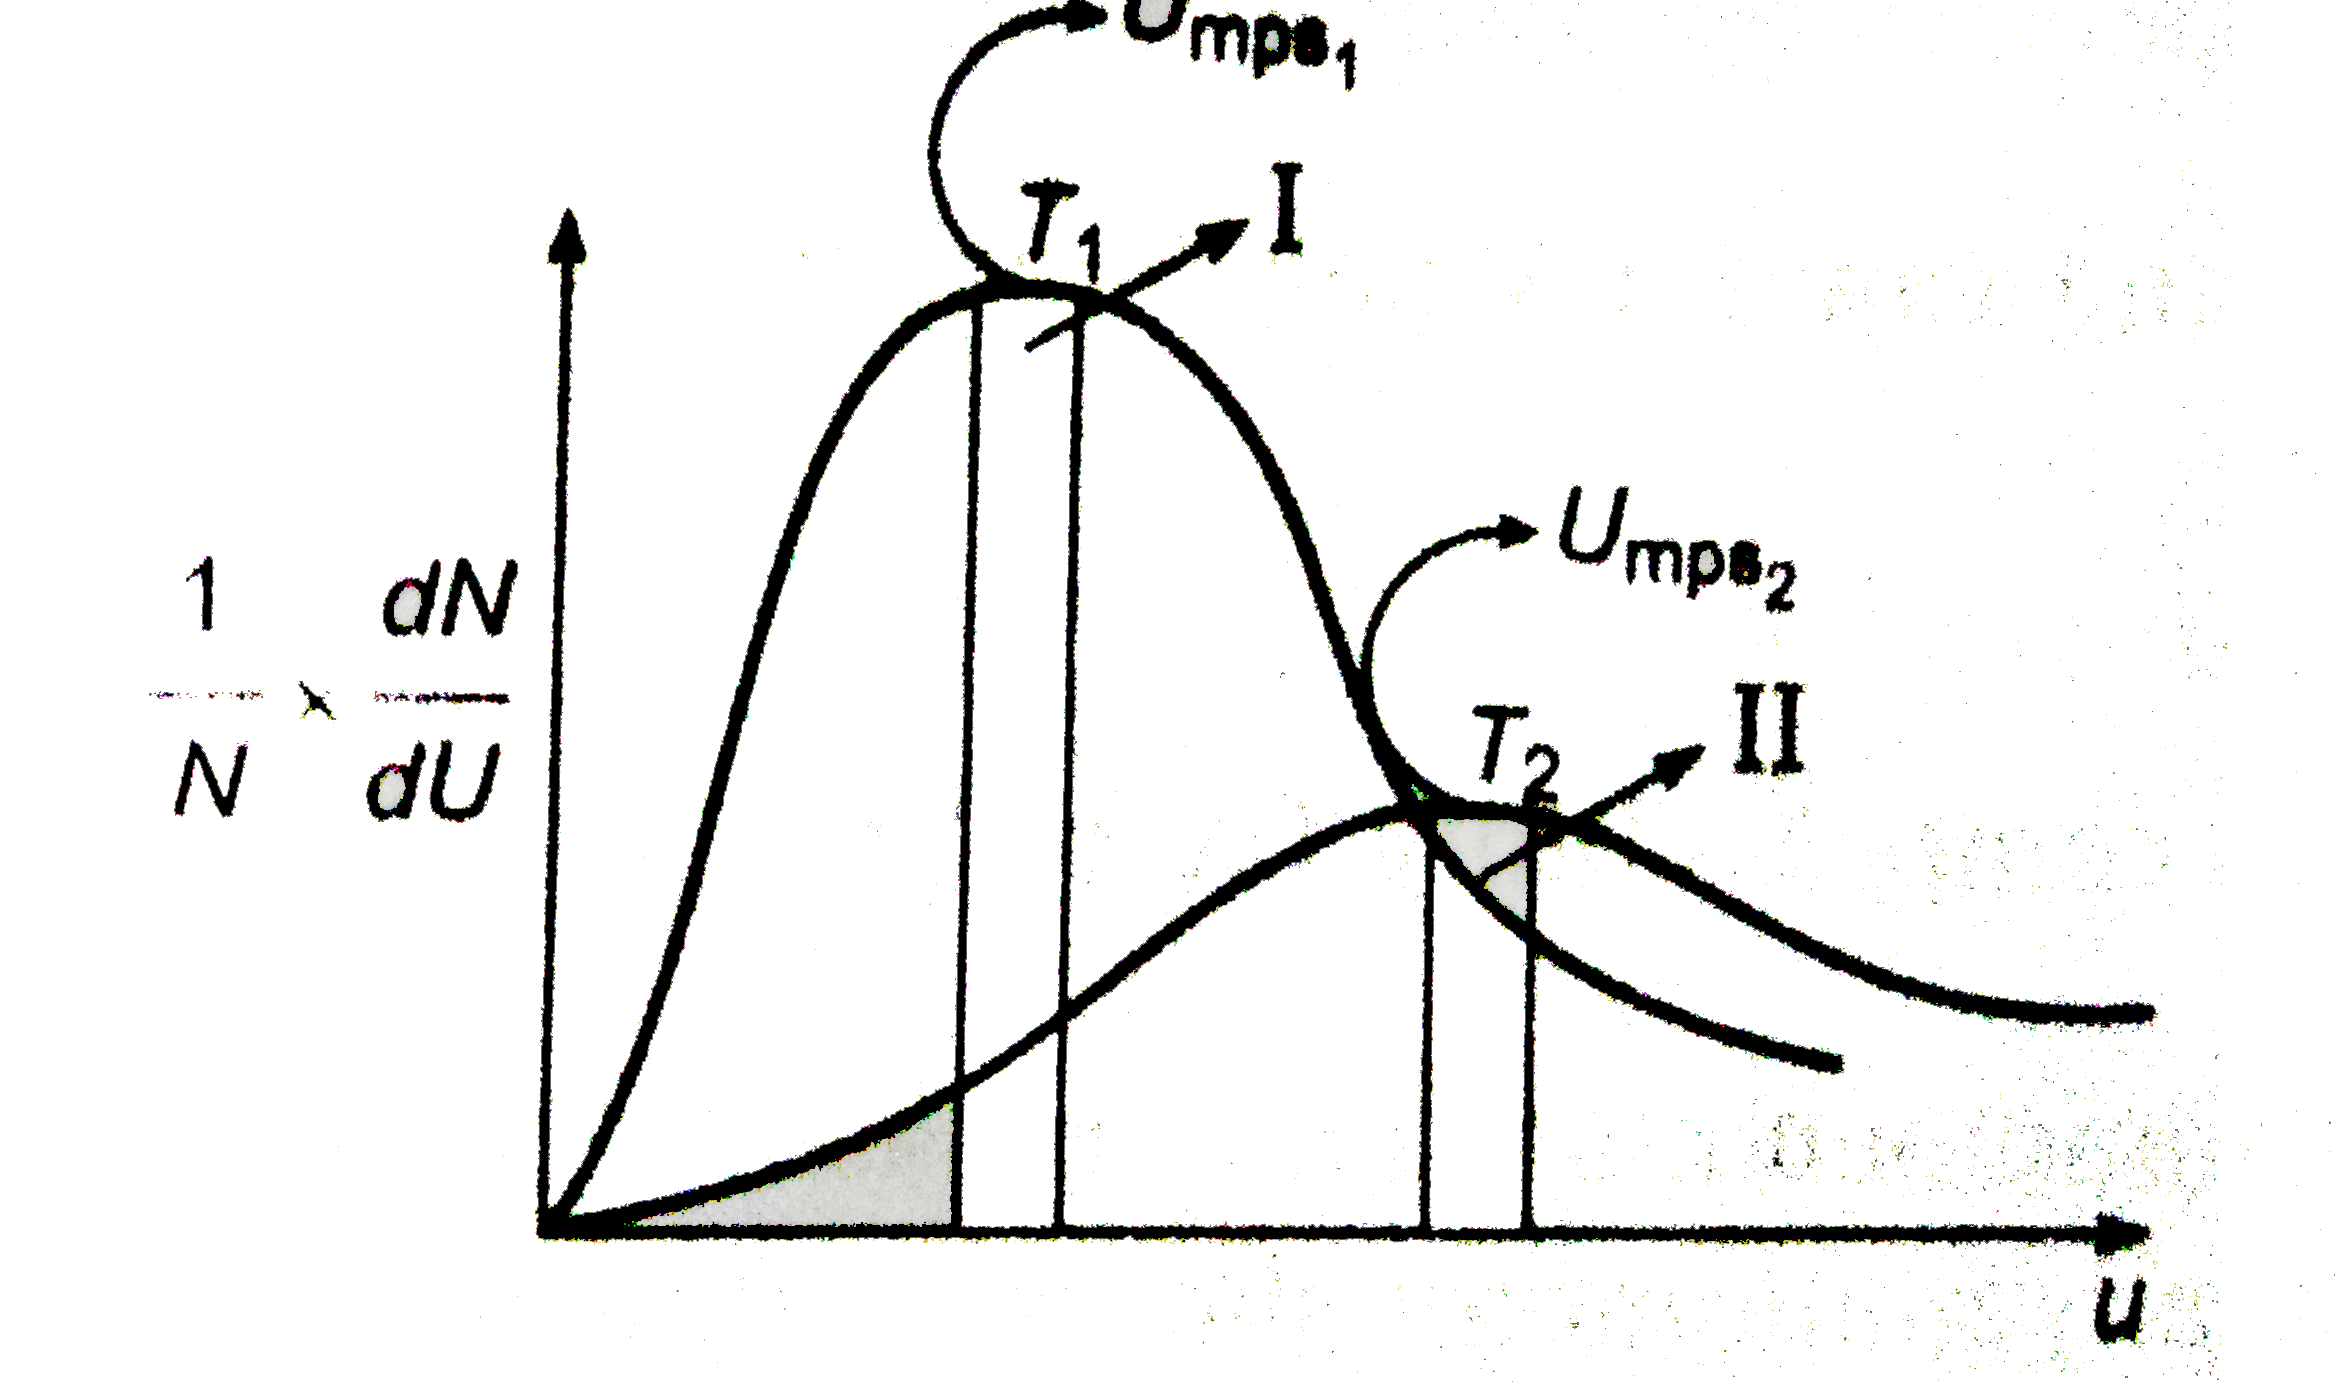
Under secondary electron emission (see Problem 4.41), the energy distribution function F(W2) for secondary electrons is represented sufficiently well by two curves (1and2) shown in the figure accompanying the problem. Which of the two curves represents the primary electrons and which, the "true" secondary electrons?
Step by step video & image solution for Under secondary electron emission (see Problem 4.41), the energy distribution function F (W_2) for secondary electrons is represented sufficiently well by two curves (1 and 2) shown in the figure accompanying the problem. Which of the two curves represents the primary electrons and which, the "true" secondary electrons? by Physics experts to help you in doubts & scoring excellent marks in Class 12 exams.
Updated on:21/07/2023Topper's Solved these Questions
Similar Questions
Which ofthe following curves may represent the energy of electron in hydrogen atom as a function of principal quantum number n:
View SolutionWhen a certain circuit consisting of a constanteuif, an inductance, and a resistance is closed, the current in it increases with time according to curve 1 (see the figure accompanying the problem). After one parumoter (G, L, or R) is changed, the increase in current follows curve 2 when the circuit is closed a second time. Which parameter was changed and in what direction?
View Solution
Knowledge Check
The diagram shows the energy levels for an electron in a certain atom. Which transition shown represents the emission of a photon with the most energy ?
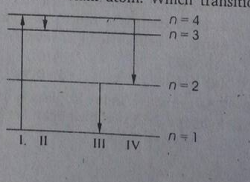 AIIIBIVCIDII
The diagram shows the energy levels for an electron in a certain atom. Which transition shown represents the emission of a photon with the most energy ?
 AIIIBIVCIDII
Shows the energy levels for an electron in a certain atom. Which transition shown represented the emission of a photon with the most energy?
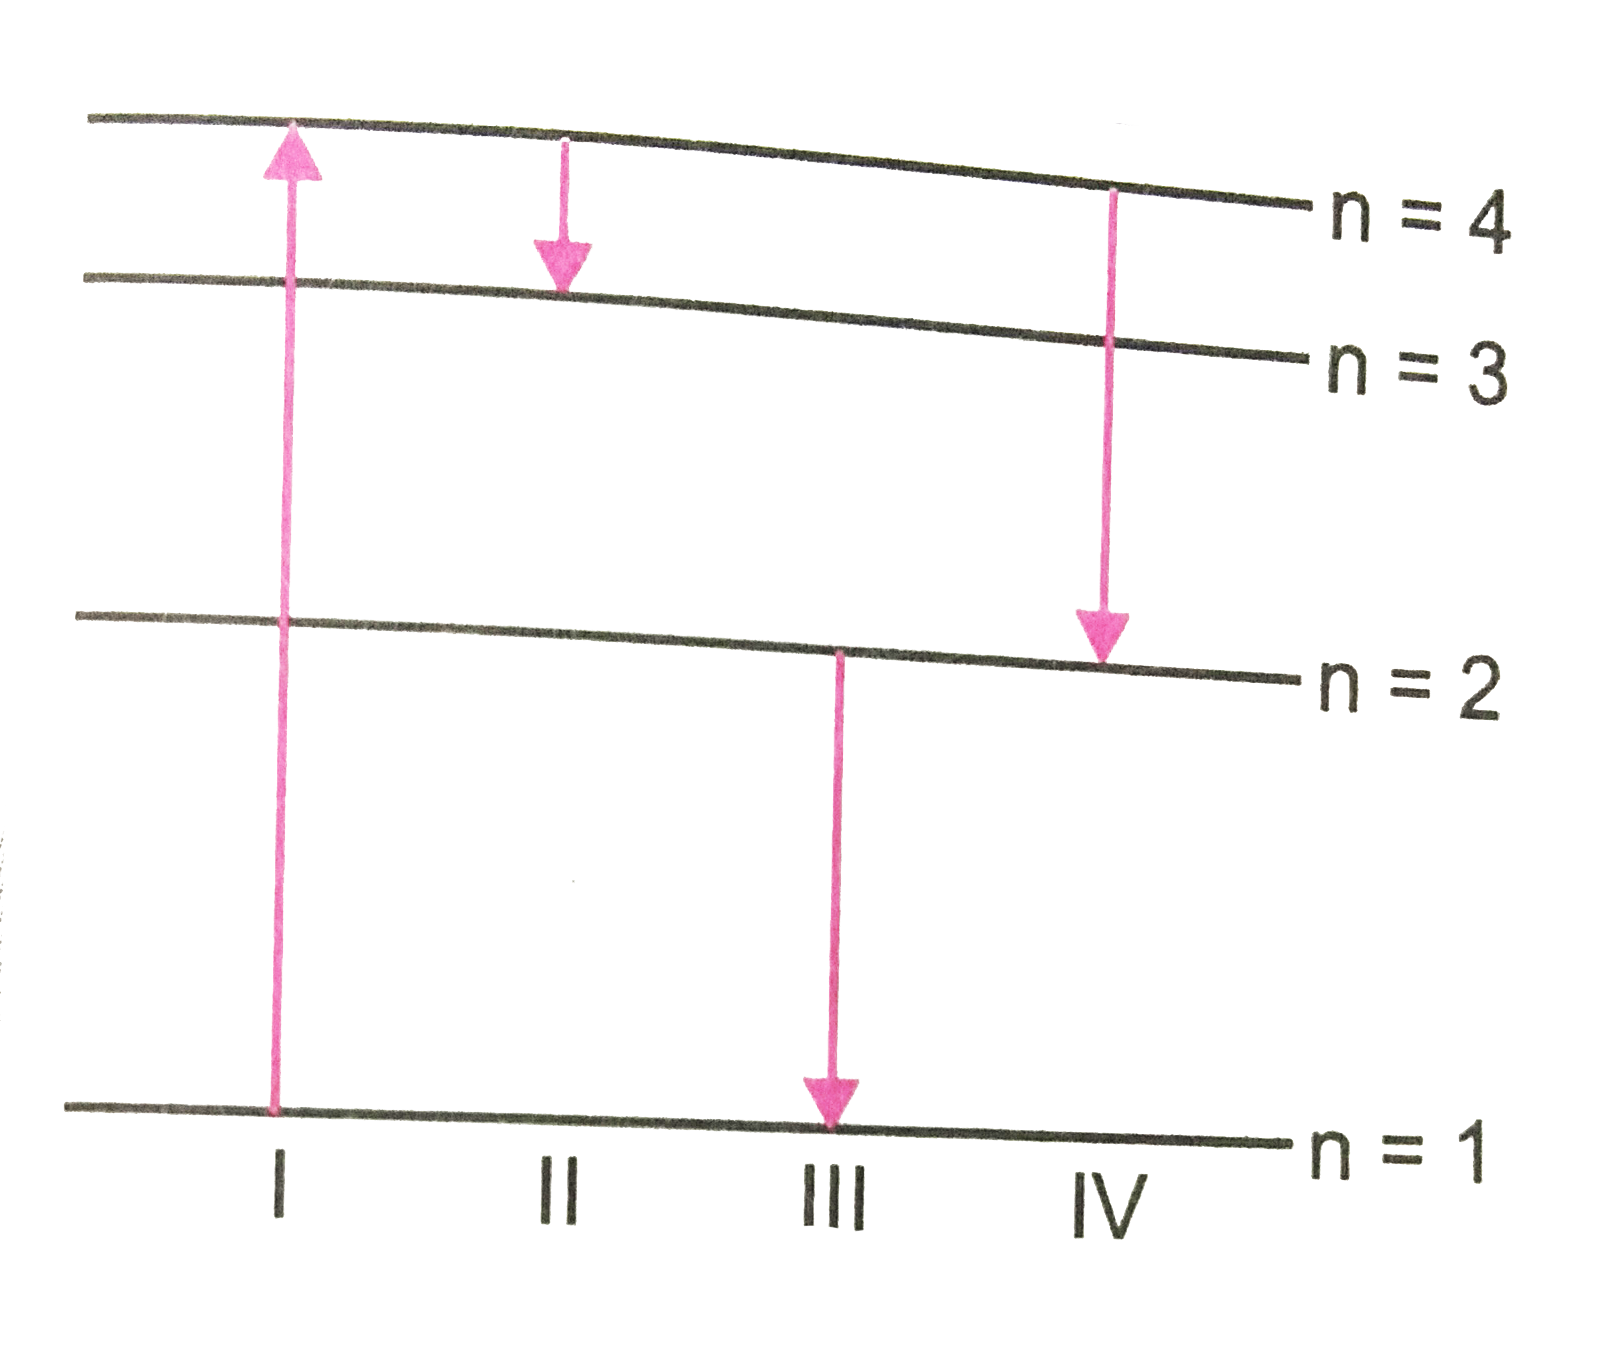 AIIBICIVDIII
The diagram shows the energy levels for an electron in a certain atom. Which transition shown represents the emission of photon with the most enegy ?
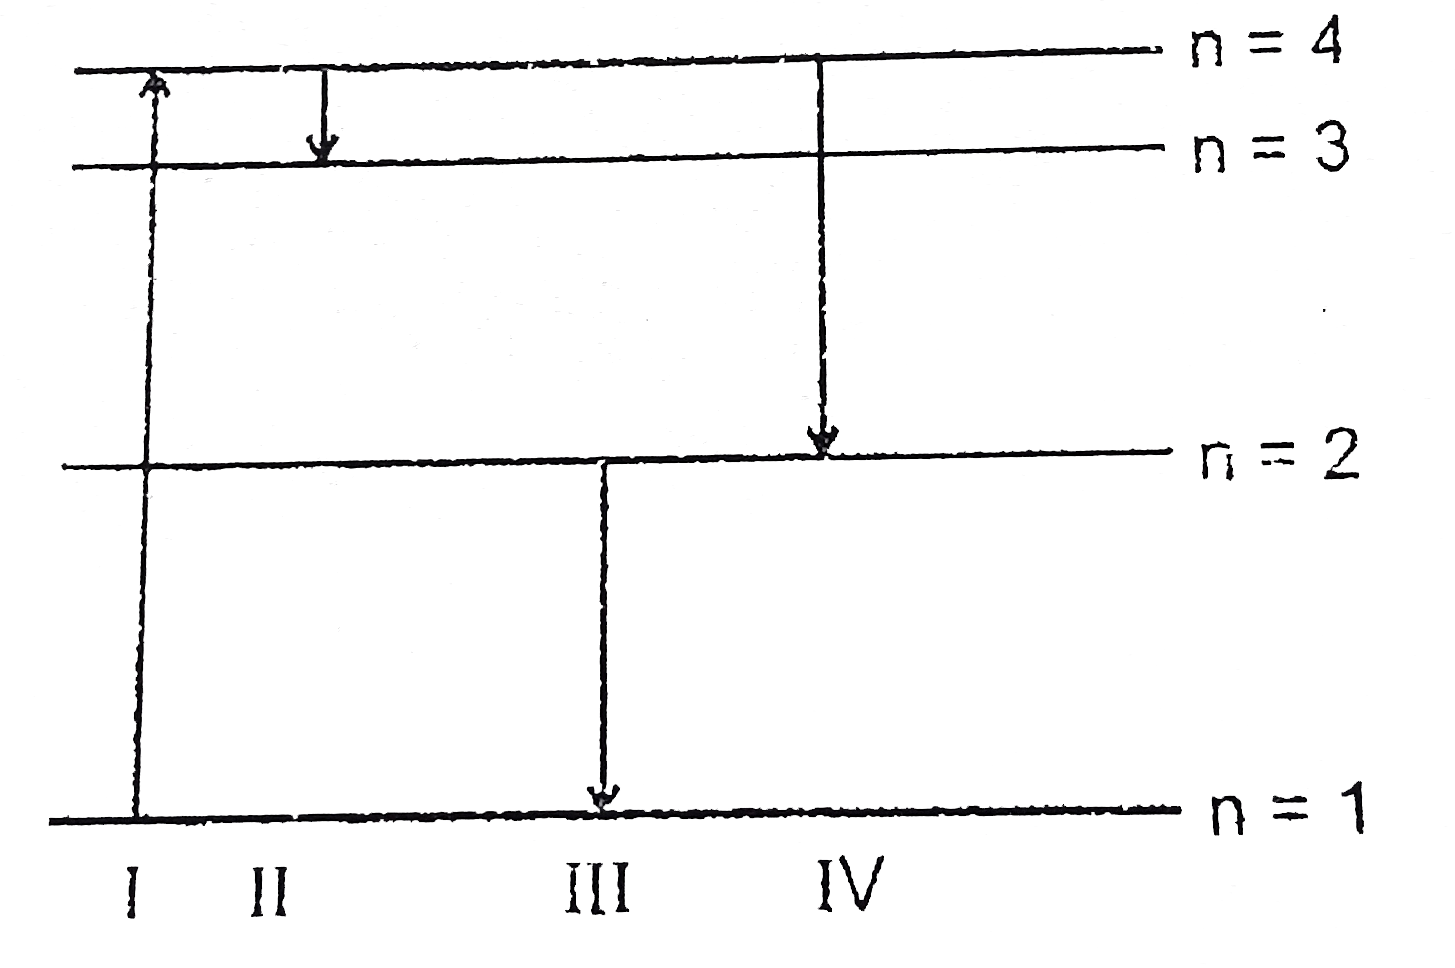
View SolutionThe diagram shows the energy level for an electron in a hydrogen atom. Which transition, shown here, represents the emissions of a photon of maximum energy?
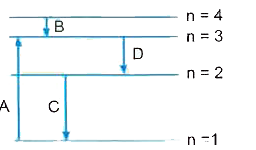
View SolutionWhich of the following curves may represent the speed of the electron in a hydrogen atom as a function of the principal quantum number n ?
View SolutionFollowing represents the Maxwell distribution curve for an ideal gas at two temperature T1 and T2 . Which of the following option(s) is/are true?
View SolutionTwo students perform experiments on two given resistors R1andR2 and plot the following V-I graphs. If R1>R2, which of the diagrams correctly represent the situation on the plotted curves?
View Solution
