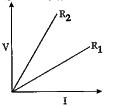
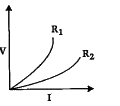
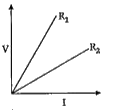
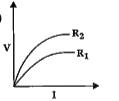
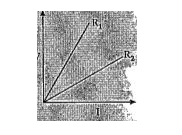
Two students perform experiments on two given resistors and plot the following V-I graphs. If , which of the diagrams correctly represent the situation on the plotted curves?
The correct Answer is:A
Diagram 1 is correct as is large so the slope of V-I graph (V/I) is greater in diagram and correct represebted as .
Similar Questions
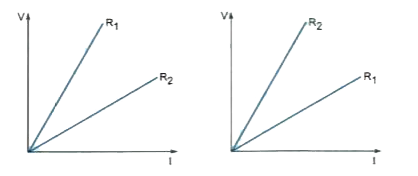
Two students perform experiments on two given resistors R1 and R2 and plot the following V-I graphs. If R1>R2 which of the two diagrams correctly represent the situation on the plotted curves? Justify your answer.
 View Solution
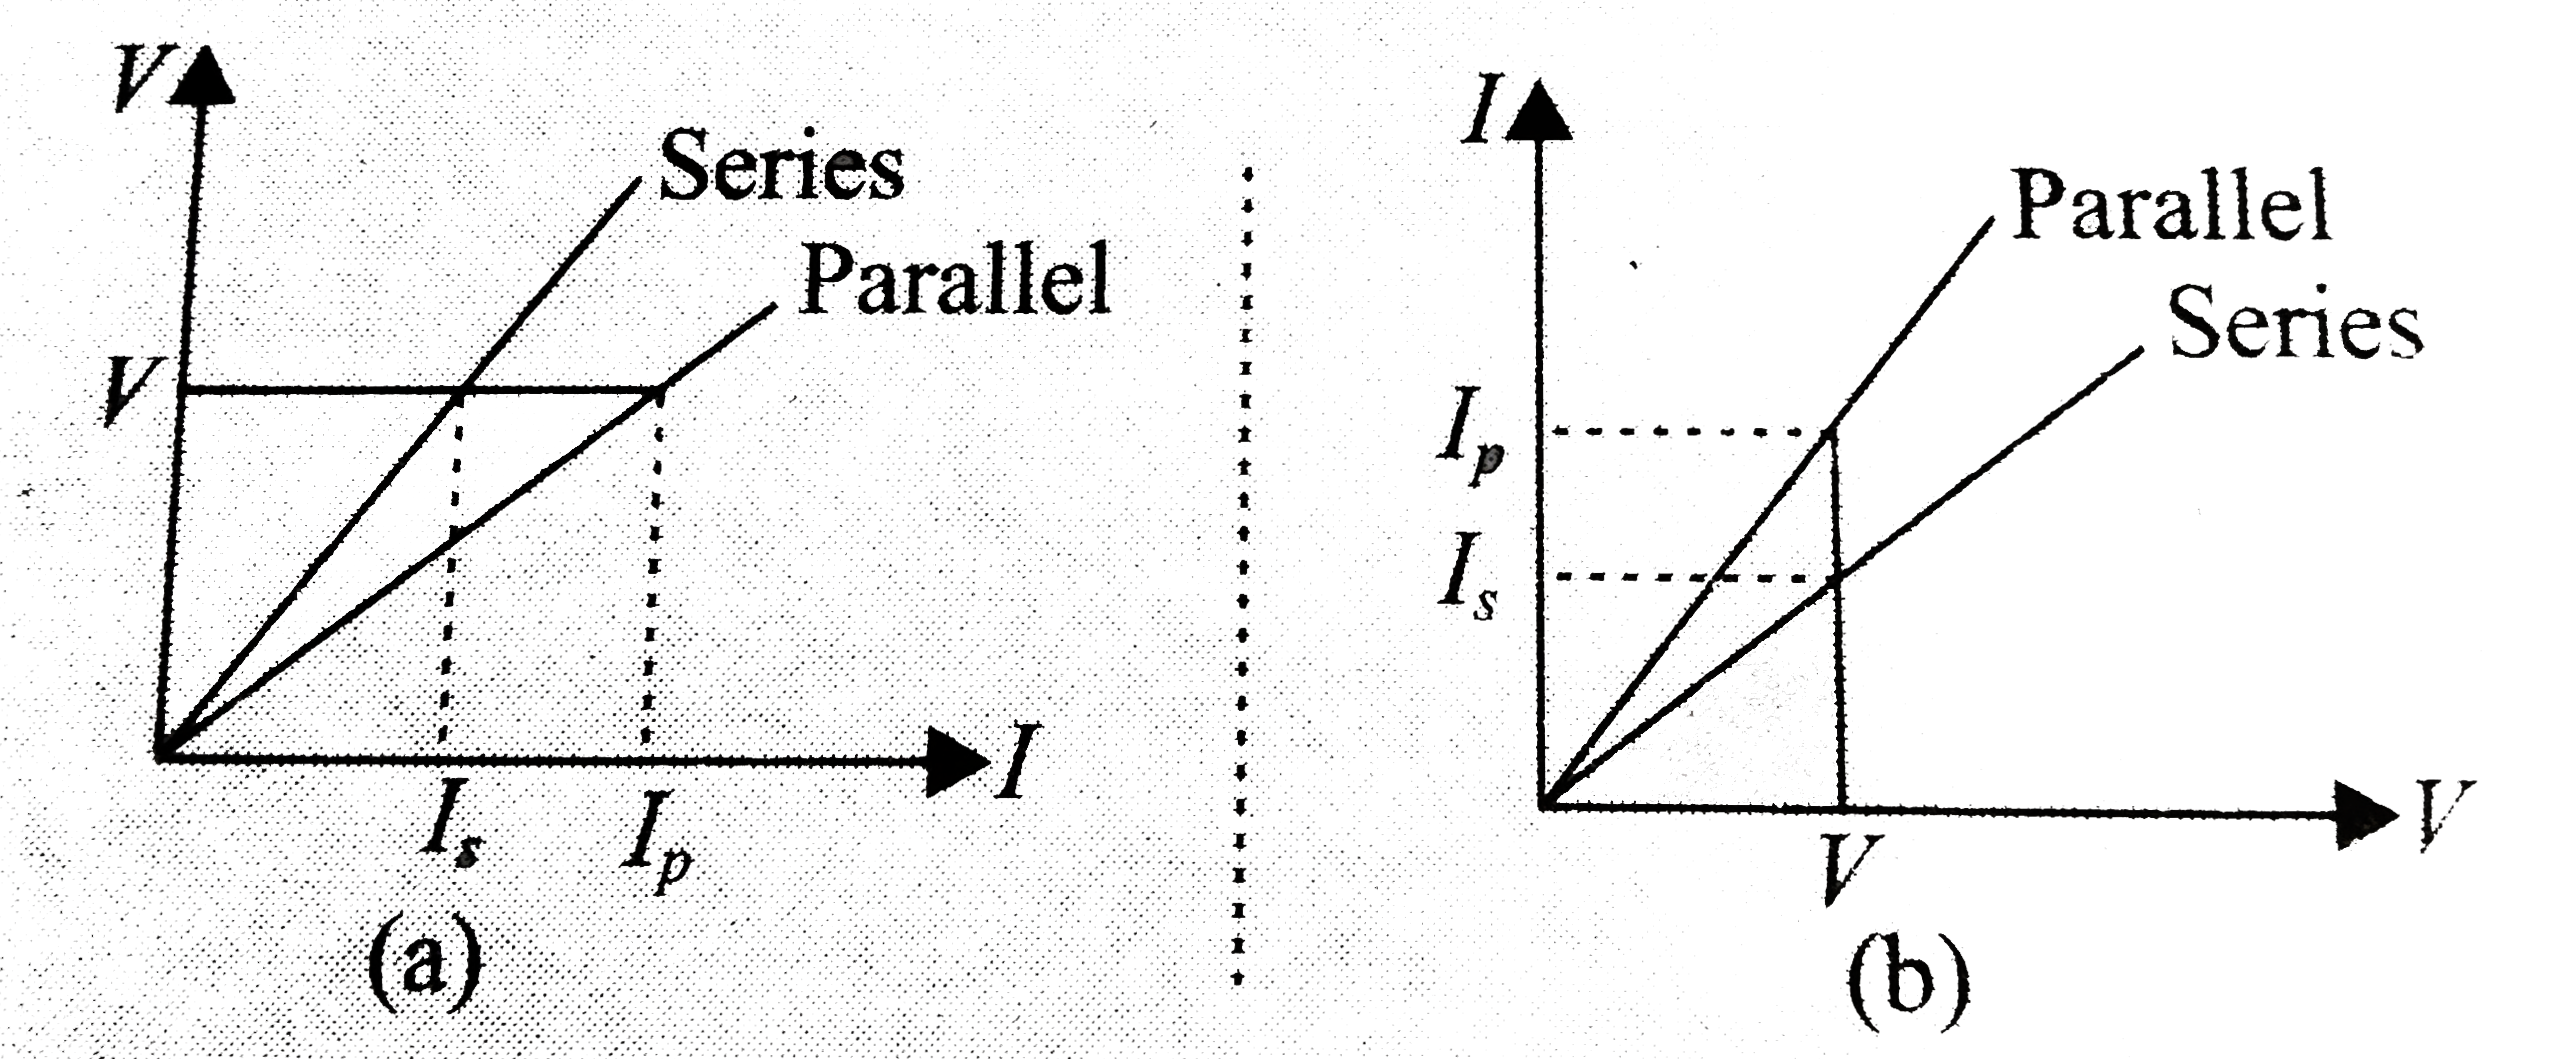
Two students perform experiments on series and parallel combinations of two given resistors R1andR1 and plot the following V -1 graphs [Fig. 5.24.]. Which of the graphs is/are correctly labeled in terms of the words 'series' and 'parallel'? Justify your answer.
 View Solution
Knowledge Check
- Question 1 - Select One
For students performed experiments on series and parallel combination of two given resistors R1and R2 which obey Ohm's law and plotted the following V-I graphs :

Which of the graphs is correctly labelled in terms of 'series' and 'parallel' ?Agraph ABgraph BCgraph CDgraph D - Question 2 - Select One
Consider two resistors R1 and R2 in series. The current flowing through R1 and R2 is
AR1=/,R2=2/BR1=/2,R2=1/2CR1=/,R2=/DR1=1/2,R2=2/ - Question 3 - Select One
Two Cu wires of radii R1 and R2 are such that (R1>R2) . Then which of the following is true ?
ATransverse wave travels faster in thicker wireBTransverse wave travels faster in thinner wireCTravels with the same speed in both the wiresDDoes not travel
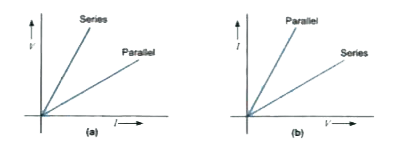
Two students perform the experiment on series and parallel combinations of two given resistors R1 and R2 and plot the following V-I graphs (a) and (b).
Which of the graphs is (are) correctly labelled in terms of the words 'series' and 'parallel'? Justify your answer.
 View Solution
A student did the experiment to find the equivalent resistance of two given resistors, R1 and R2 first when they are connected in series and next when they are connected in parallel. The two values of the equivalent resistance obtained by him were Rs and Rp respectively. Compare Rs and Rp.
View SolutionA student did the experiment to find the equivalent resistance of two given resistors, R1 and R2 first when they are connected in series and next when they are connected in parallel. The two values of the equivalent resistance obtained by him were Rs and Rp respectively. Compare Rs and Rp.
View SolutionIn the given circuit, if I1andI2 be the current in resistances R1andR2, respectively, then
 . View Solution
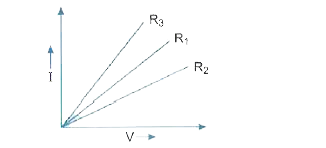
A student plots V-I graphs for three samples of nichrome wire with resistances R1, R2 and R3.
Choose from the following the statement that holds true for this graph.
 View Solution

