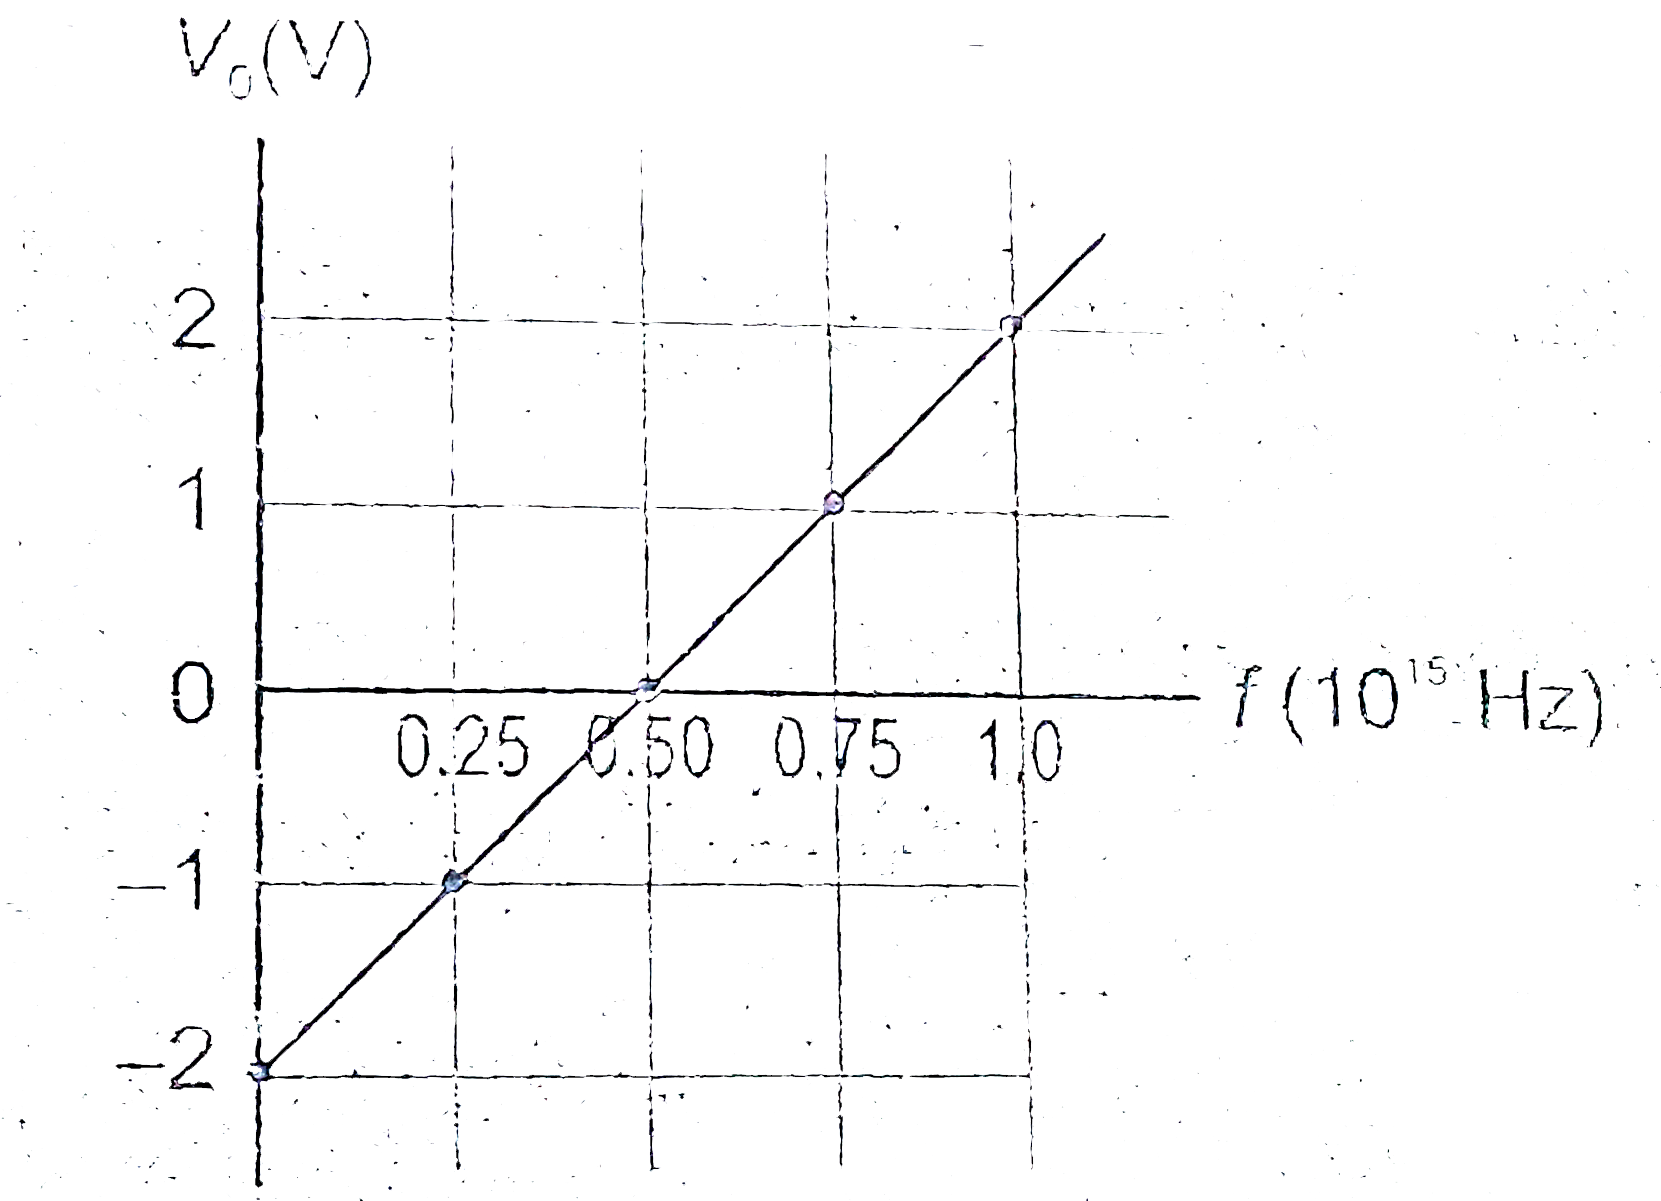
Using the graph shown in the figure for stopping potential vs. the incident frequency of photons, calculate Planck.s constant.
Apply the relation KE=hv−ϕ0,ϕ0=hv0, then calculate h.
Similar Questions
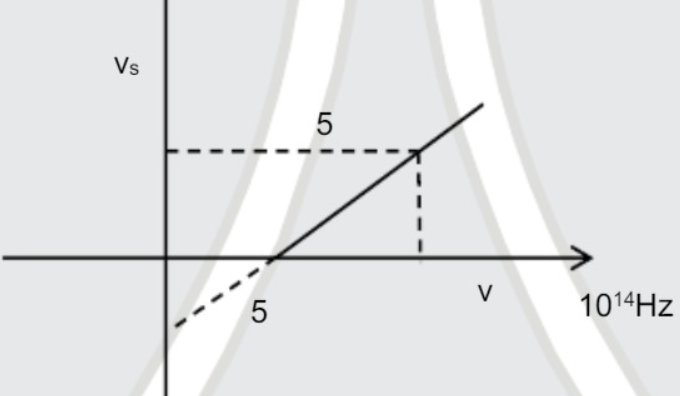
Figure shows the graph of stopping potential verus that frequency of a photosensitive metal. The plank's constant and work funcation of the metal are
_S01_035_Q01.png)
View SolutionThe slope of the graph drawn between stopping potential and frequency of incident radiation will be
View SolutionSketch the graphs, showing the variation of stopping potential Vs with frequency v of the incident radiations for two photosensitive materials A and B having threshold frequencies v0>v'0 respectively.
(i) which of the two metals A or B has higher work function?
(ii) What information do you get from the slope of the graphs?
(iii) What does the value of the intercept of graph A on the potential axis represent?
View SolutionWhen a high frequency electromagnetic radiation is incident on a metallic surface, electrons are emitted from the surface. Energy of emitted photoelectrons depends only on the frequency of incident electromagnetic radiation and the number of emitted electrons depends only on the intensity of incident light.
Einstein's protoelectron equation [Kmax=hv−ϕ} correctly explains the PE, where υ= frequency of incident light and ϕ= work function.
Q. The slope of the graph between stopping potential and frequency is [here h is the Planck's constant and e is the charge of an electron] is
View SolutionGraph of incident freuency with stopping potential in photoelectric effect is
View SolutionThe following figure shows a graph for the stopping potential as a function of the frequency of incident light illuminating a metal surface. Find the photoelectric work function for this surface.

View SolutionThe surface of cesium is illuminated with monochromatic light of various wavelengths and the stopping potential for the wavelength are measured. The results of this experiment is plotted as shown in the figure Estimate the value of work function of the cesium and Planck's constant.
_E01_165_Q01.png)
View SolutionGraph between stopping potential and frequency of photon is given in figure
_2019_CBT7_E01_021_Q01.png)
Find out work function of metal:
View SolutionGraph between stopping potential and frequency of light as shown find the work function

View SolutionThree metals have work functions in the ratio 2 3:4. Graphs are drawn for all connecting stopping potential and incident frequency. The graphs have slopes in the ratio
View Solution
