The stopping potential vs frequency plot for a substance is shown in the figure. The work function of the substance is
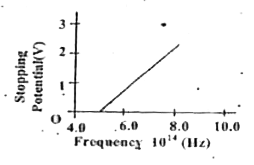
3.331 eV
4.02 eV
2.07 eV
3.02e V
The correct Answer is:C
Step by step video, text & image solution for The stopping potential vs frequency plot for a substance is shown in the figure. The work function of the substance is by Physics experts to help you in doubts & scoring excellent marks in Class 12 exams.
Topper's Solved these Questions
- BOOK - FIITJEECHAPTER - ELECTROMAGNETIC WAVE & WAVE OPTICSEXERCISE - SOLVED PROBLEMS Objective: Level-II10videos
ELECTROMAGNETIC WAVE & WAVE OPTICS
- BOOK - FIITJEECHAPTER - ELECTROMAGNETIC WAVE & WAVE OPTICSEXERCISE - ASSIGNMENT PROBLEMS(Subjective: Level-I)36videos
ELECTROMAGNETIC WAVE & WAVE OPTICS
- BOOK - FIITJEECHAPTER - ELECTROMAGNETIC WAVE & WAVE OPTICSEXERCISE - SOLVED PROBLEMS (subjective )31videos
ELECTROMAGNETIC WAVE & WAVE OPTICS
- BOOK - FIITJEECHAPTER - ELECTROMAGNETIC INDUCTION AND AC CURRENTEXERCISE - Example15videos
ELECTROMAGNETIC INDUCTION AND AC CURRENT
- BOOK - FIITJEECHAPTER - ELECTROSTANTICSEXERCISE - MATRIX MATCH TYPE1videos
ELECTROSTANTICS
Similar Questions
The stopping potential (V0) versus frequency (v) plot of a substance is shown in figure, the threshold wavelength is
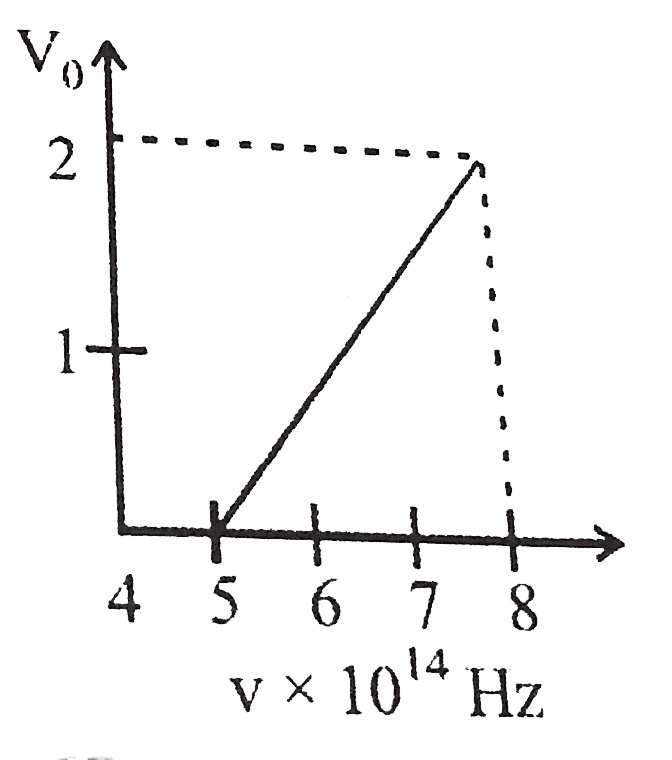 View Solution
The stopping potential V0 (in volt) as a function of frequency (v) for a sodium emitter, is shown in the figure. The work function of sodium, from the data plotted in the figure, will be:
(Given : Planck’s constant)
(h)=6.63×10⁻³⁴Js electron charge e=1.6×10⁻¹⁹C)
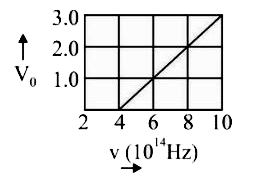 View Solution
Knowledge Check
- Question 1 - Select One
Graph between stopping potential and frequency of photon is given in figure
_2019_CBT7_E01_021_Q01.png)
Find out work function of metal:A0.82B0.92C0.72D0.62 - Question 2 - Select One
Graph between stopping potential and frequency of light as shown find the work function
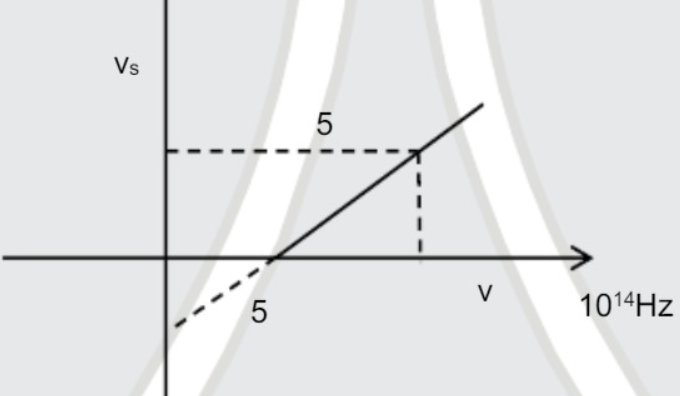 A4.01 evB2.07 evC5.01 evD2.09 ev
 - Question 3 - Select One
Light of frequency v is incident on a certain photoelectric substance with threshold frequency v. The work function for the substance is
AhvBhv0Ch(v−v0)Dh(v+v0)
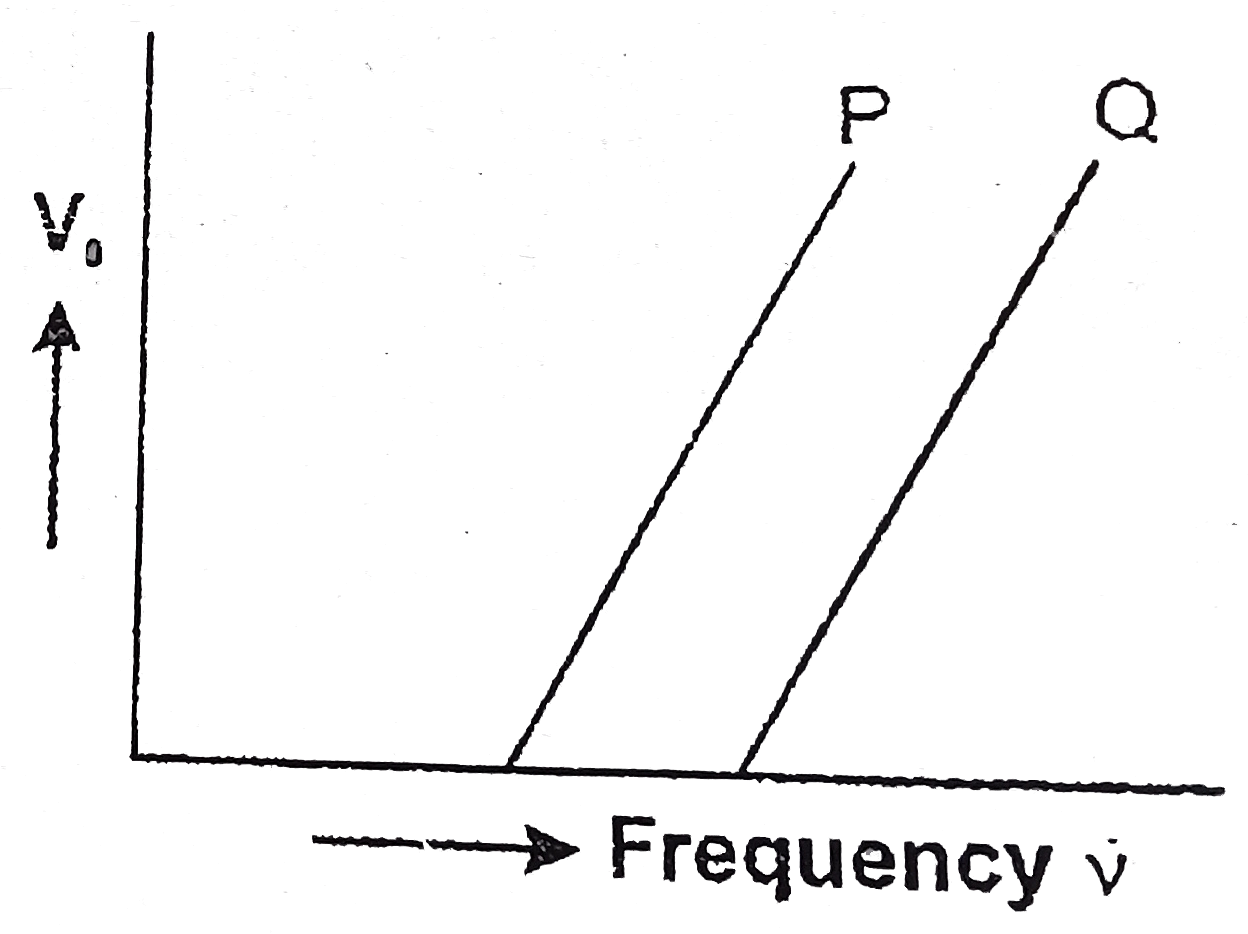
The graph between the stopping potential V0 and frequency v for two different metal plates P and Q are shown in the figure. Which of the metals has greater threshold wavelength and work function.
 View Solution
The surface of cesium is illuminated with monochromatic light of various wavelengths and the stopping potential for the wavelength are measured. The results of this experiment is plotted as shown in the figure Estimate the value of work function of the cesium and Planck's constant.
_E01_165_Q01.png) View Solution
View SolutionThe given graph shows the variation of KE with frequency of incident radiations for two surfaces A and B.
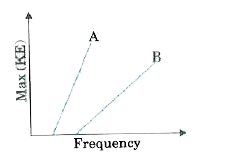
(a) Which of the metals has greater work function ? For which of the metals will stopping potential be more for the same frequency of incident radiation ?
(b) The work function caesium metal is 2.14 eV. When light of frequency 6×10¹⁴ Hz. incident on the metal surface , what is the maximum KE of the photoelectrons and stopping potential ?View SolutionA student performs an experiment on photoelectric effect using two materials A and B. A plot of stopping potential (V0) vs frequency (ν) is as shown in the figure.
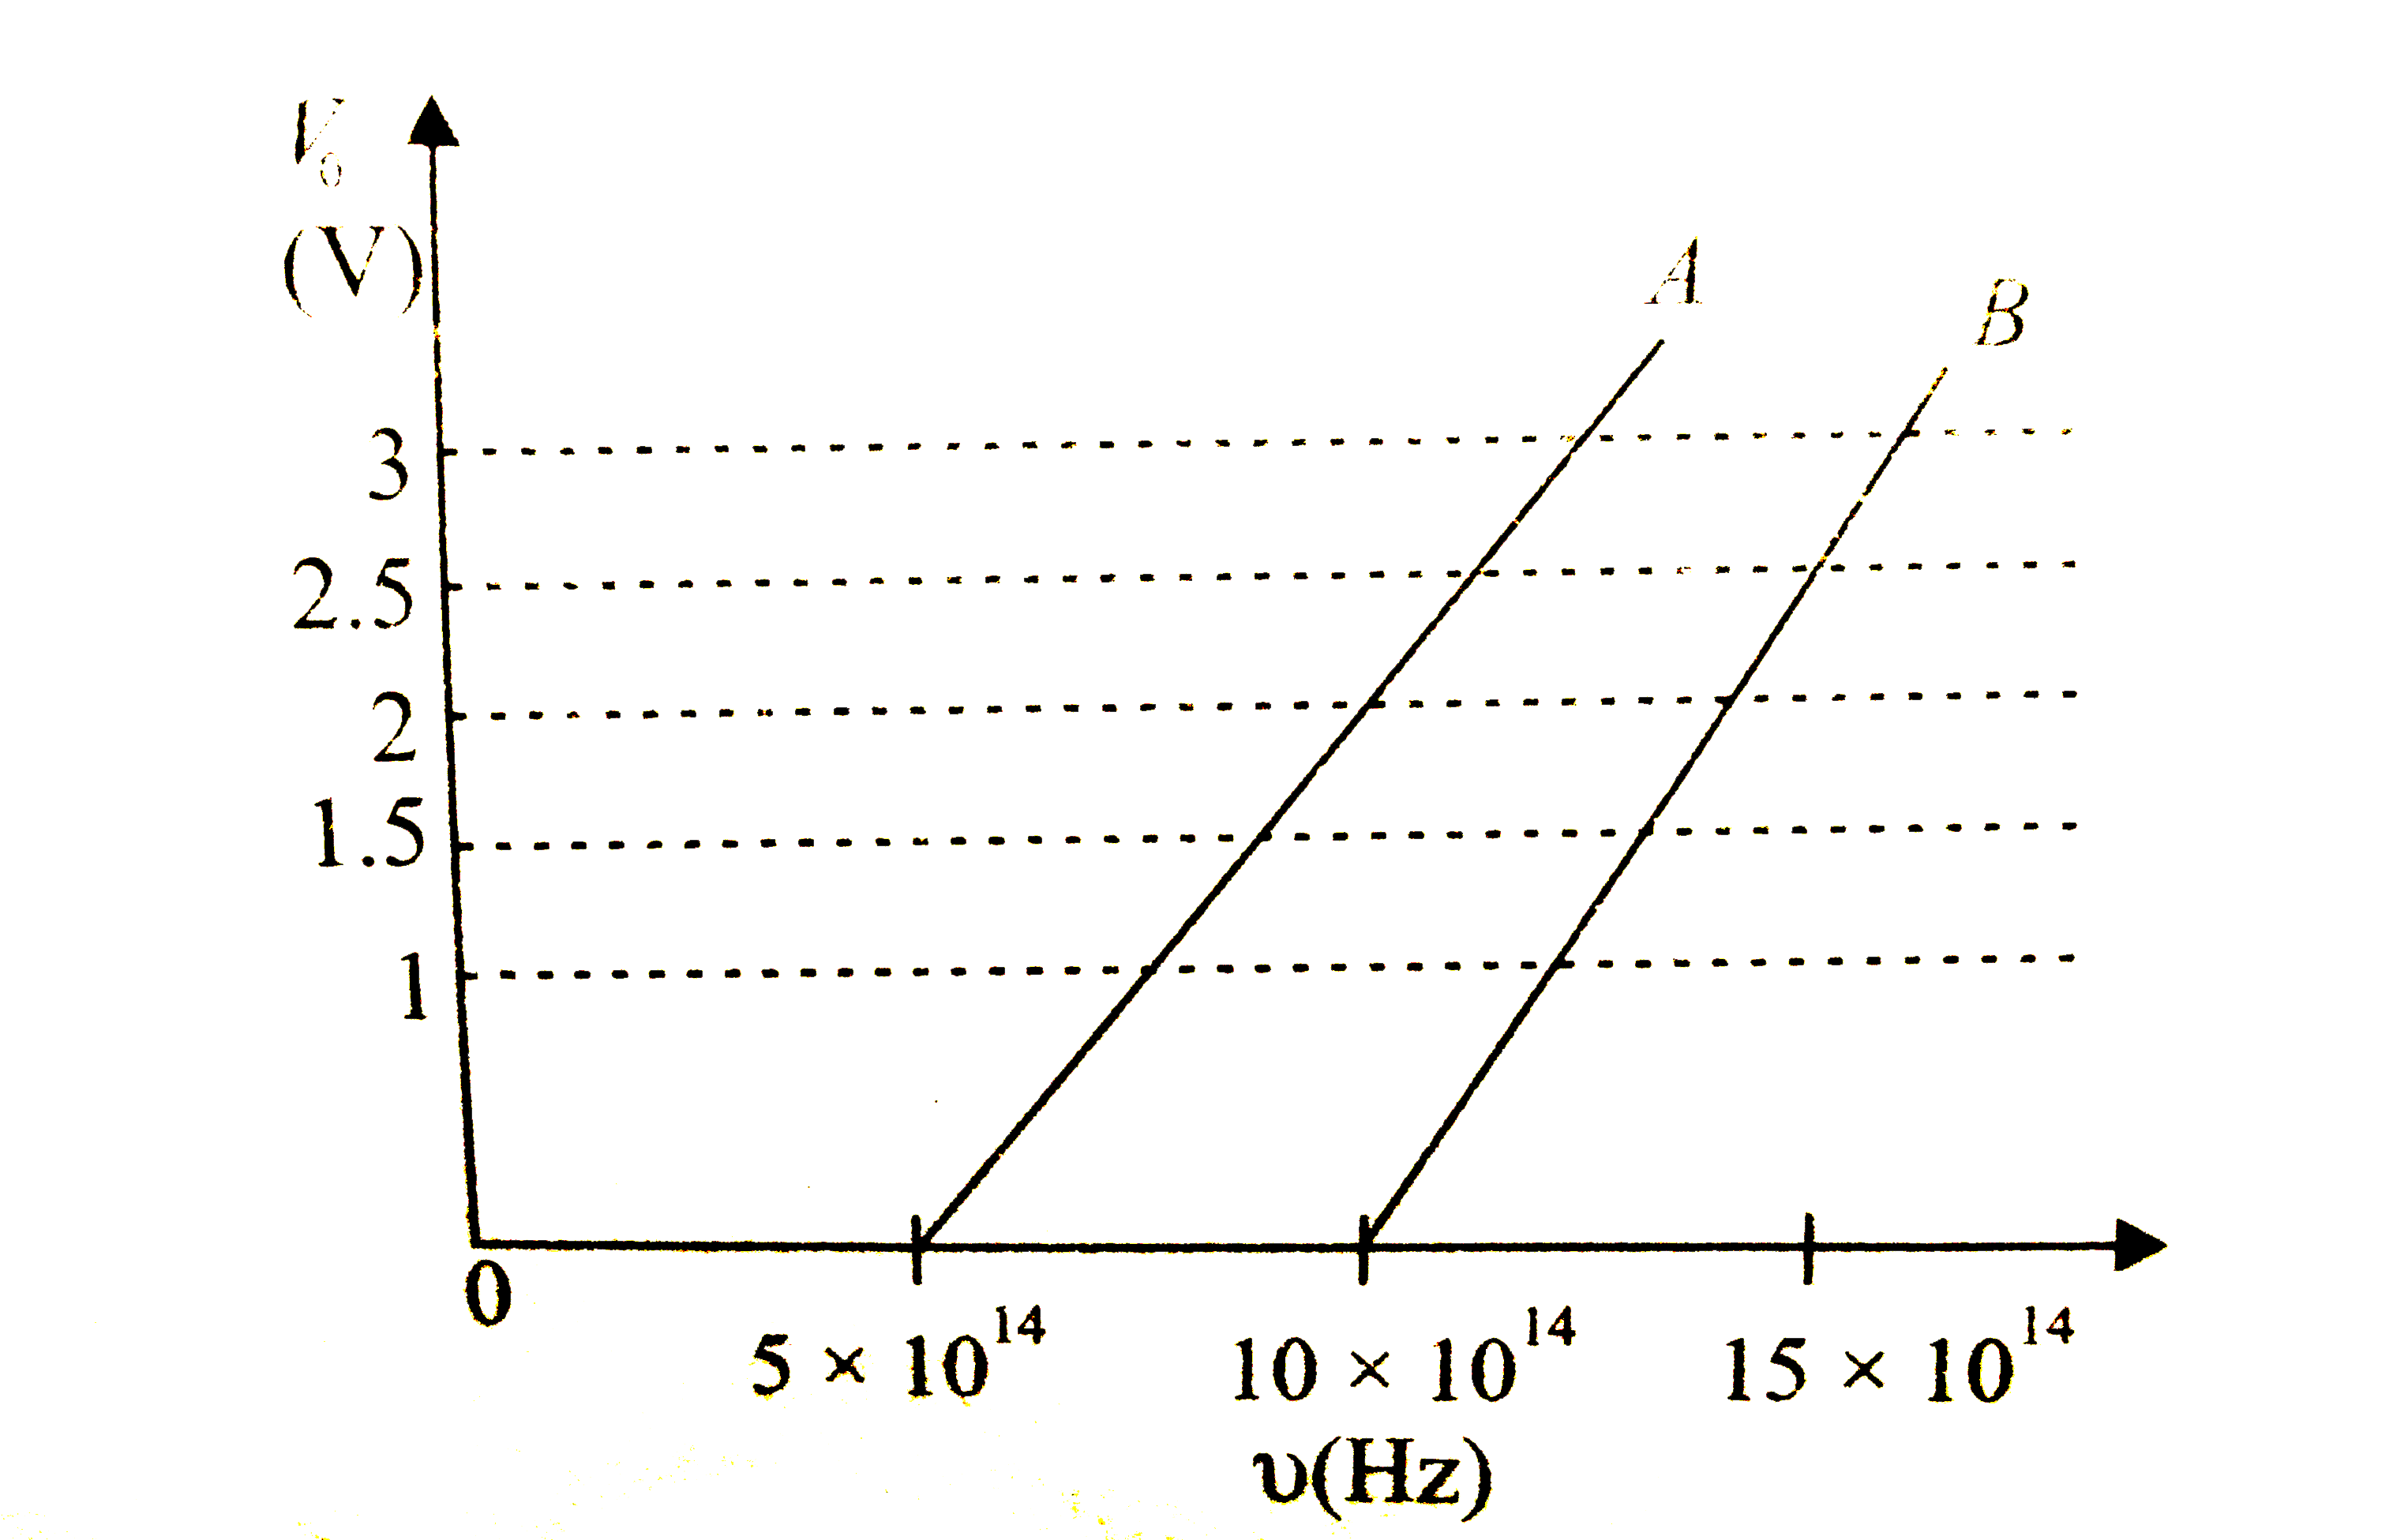
The value of Planck's constant obtained from the experiment for both A and B respectively is
(Given electric charge of an electron =1.6×10⁻¹⁹C)View SolutionFigure shows the graph of stopping potential verus that frequency of a photosensitive metal. The plank's constant and work funcation of the metal are
_S01_035_Q01.png) View Solution
View Solution

