What type of graph do you expect between (i) L and T and (ii) L and T^2 ?
Video Solution
Text Solution
The correct Answer is:A, B, C
L=(g4π2)T2.
|
Topper's Solved these Questions
- EXPERIMENTSBOOK - DC PANDEYCHAPTER - EXPERIMENTSEXERCISE - Exercise 3.4
2 Videos
- EXPERIMENTSBOOK - DC PANDEYCHAPTER - EXPERIMENTSEXERCISE - Exercise 3.5
2 Videos
- EXPERIMENTSBOOK - DC PANDEYCHAPTER - EXPERIMENTSEXERCISE - Exercise 3.2
2 Videos
- ELECTROSTATICSBOOK - DC PANDEYCHAPTER - ELECTROSTATICSEXERCISE - Integer
17 Videos
- FLUID MECHANICSBOOK - DC PANDEYCHAPTER - FLUID MECHANICSEXERCISE - Medical entranes gallery
49 Videos
Similar Questions
Knowledge Check
What type of waves do you expect in vacuum
AlongitudinalBtransverseCboth (a) and (b)Dno wavesThe graph between L and T2 is
A B
B C
C D
D
The graph between L and T2 is
A B
B C
C D
D
What type of bonding would you expect between the following pairs of elements?
(i). Calcium and Oxygen
(ii). Carbon and Chlorine
(iii). Hydrogen and Chlorine
View SolutionThe graph between L and T is correctly shown by
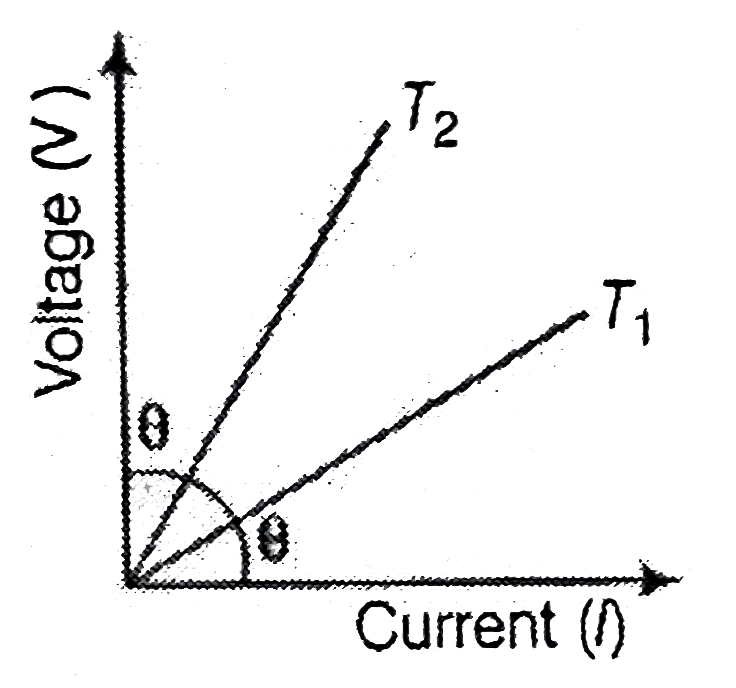
View SolutionThe V-l graph for a conductor at temperatures T1 and T2 are as shown in the figure. The term T2−T1 is proportional to

View SolutionFor a simple pendulum, the graph between T2andL (where T is the time period & Lis the length) is
View SolutionThe graph between time period (T) and length (l) of a simple pendulum is
View Solution
