The graph between L and T is correctly shown by
A

B

C

D

Text Solution
The correct Answer is:B
|
Similar Questions
Knowledge Check
The graph between L and Tis correctly shown by (Fig. 7.2)
A B
B C
C D
D
If p and E represent linear momentum and kinetic energy respectively, then the graph between E and pis correctly shown by
A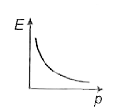 B
B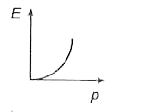 C
C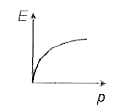 D
D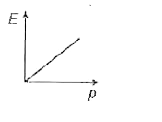
The graph between L and T2 is
A B
B C
C D
D
The graph between L and T2 is
View SolutionThe x-t graph of a particle moving along a straight line is shown in figure
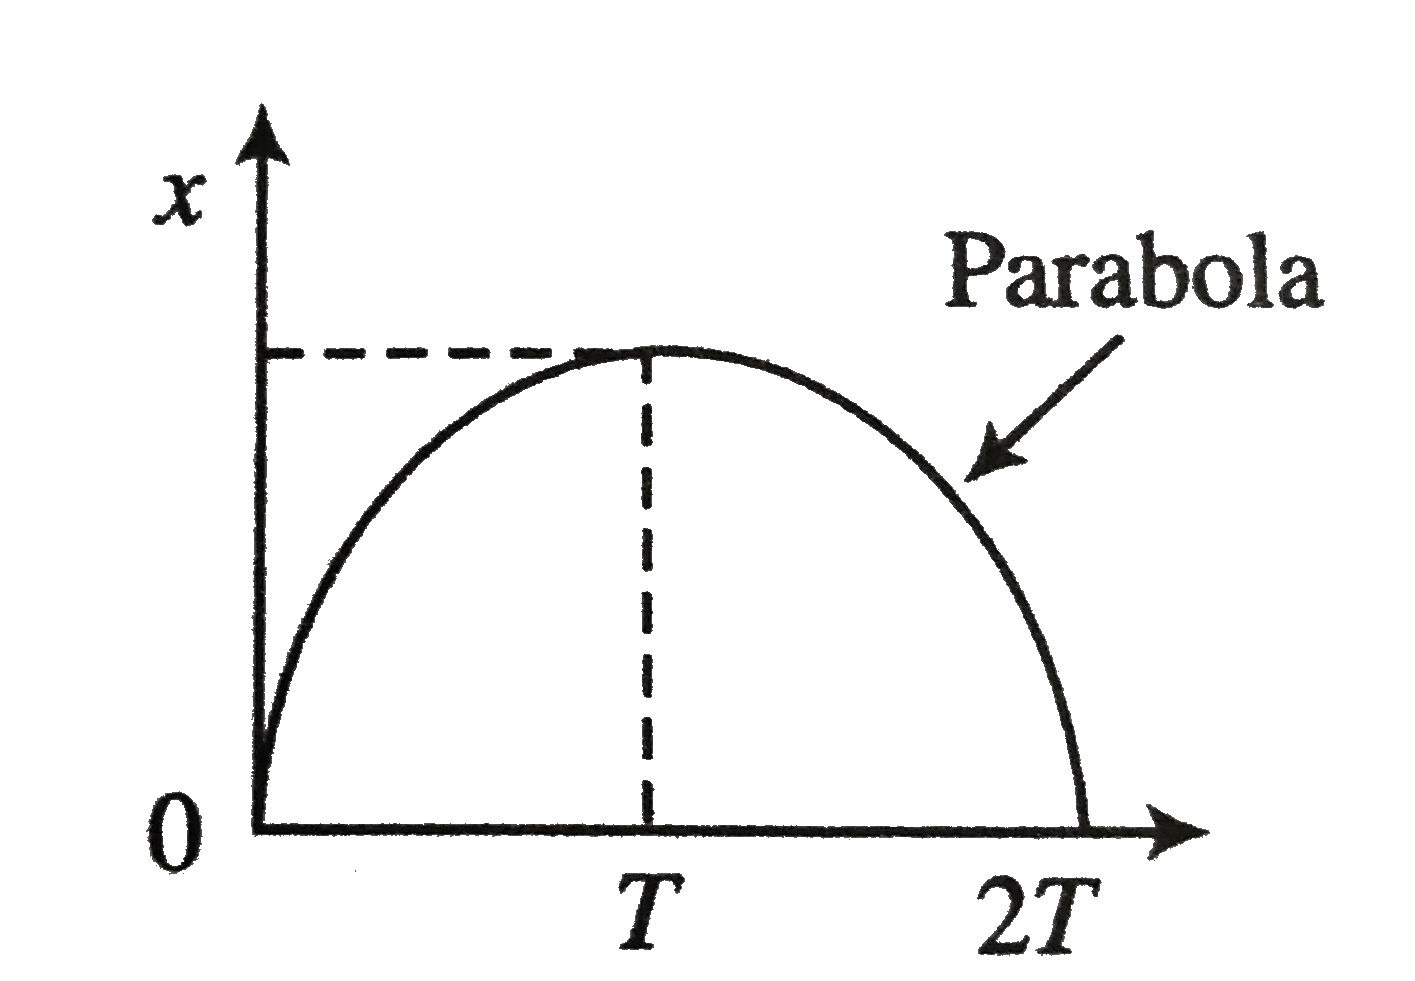
The speed-time graph of the particle is correctly shown by
View SolutionThe x-t graph of a particle moving along a straight line is shown in figure

The v-t graph of the particle is correctly shown by
View SolutionThe x−t graph of particle moving along a straight line is shown in figure
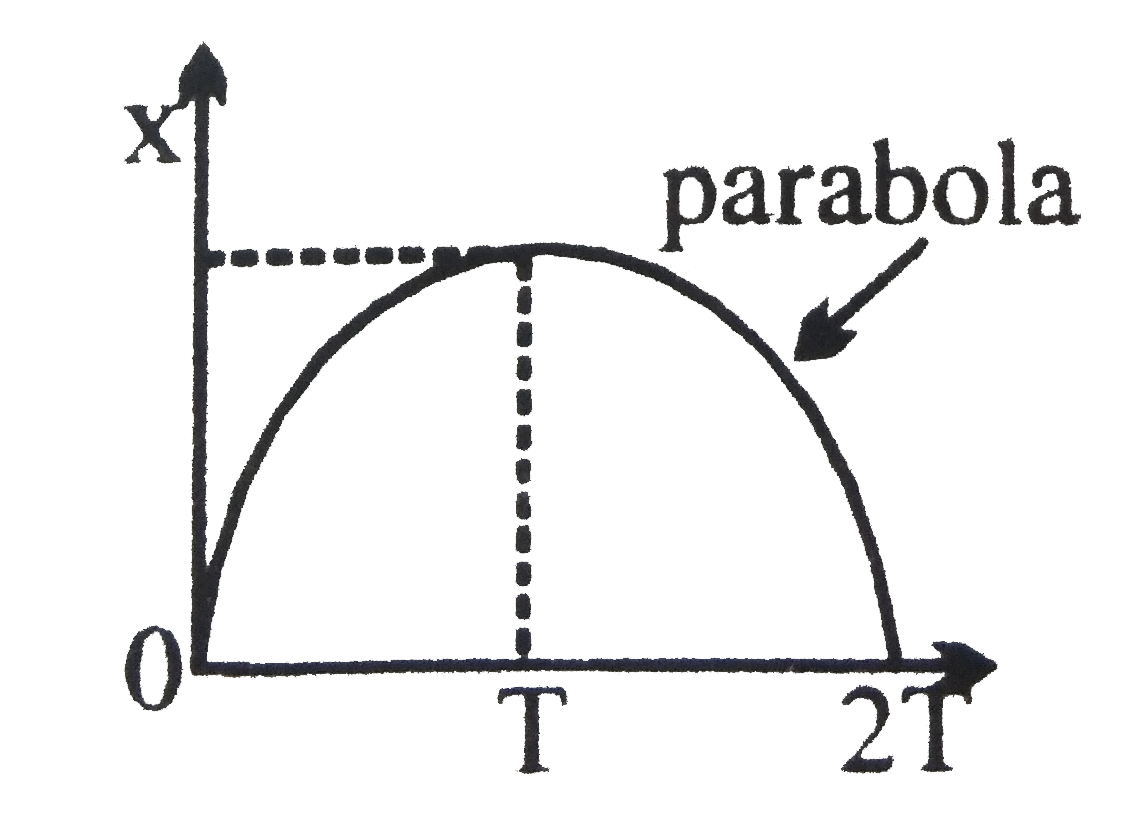
The v−t graph of the particles is correctly shown by
View SolutionThe x−t graph of particle moving along a straight line is shown in figure
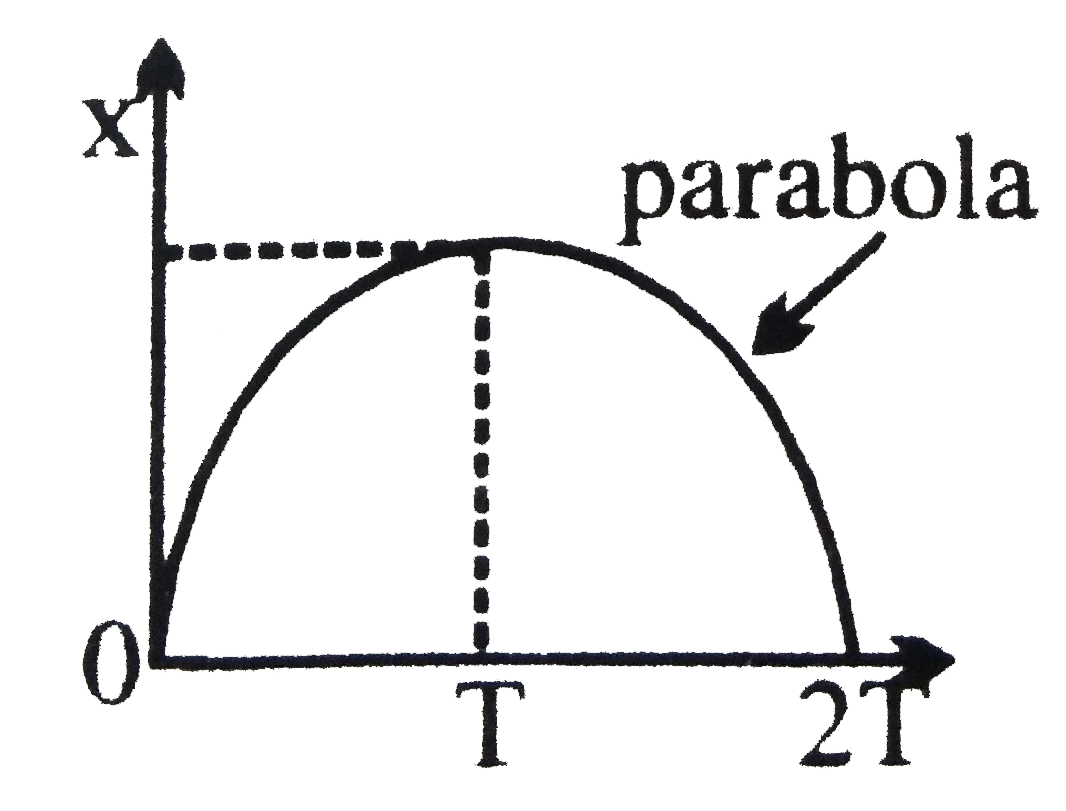
The a−t graph of the particle is correctly shown by
View Solution
