What type of graph do you expect between (i) L and T and (ii) L and T^2 ?
The correct Answer is:A, B, C
To solve the question regarding the expected type of graphs between (i) L and T and (ii) L and T² for a simple pendulum, we can follow these steps:
1. Understanding the Relationship:
- The time period T of a simple pendulum is given by the formula:
T=2π√Lg
where L is the length of the pendulum and g is the acceleration due to gravity.
2. Graph between L and T:
- Rearranging the formula, we can express T in terms of L:
T∝√L
- This indicates that T is directly proportional to the square root of L. Therefore, if we plot T on the y-axis and L on the x-axis, we expect a curve that rises but flattens out as L increases. This is because the relationship is not linear but rather a square root function.
3. Graph between L and T²:
- Squaring both sides of the original formula gives:
T2=4π2Lg
- From this equation, we can see that:
T2∝L
- This indicates that T2 is directly proportional to L. Therefore, if we plot T2 on the y-axis and L on the x-axis, we expect a straight line that passes through the origin. The slope of this line will be 4π2g.
Summary of Expected Graphs
- (i) The graph between L and T is a curve (specifically, a square root curve).
- (ii) The graph between L and T2 is a straight line passing through the origin.
- The time period T of a simple pendulum is given by the formula:
T=2π√Lg
where L is the length of the pendulum and g is the acceleration due to gravity.
- Rearranging the formula, we can express T in terms of L:
T∝√L
- This indicates that T is directly proportional to the square root of L. Therefore, if we plot T on the y-axis and L on the x-axis, we expect a curve that rises but flattens out as L increases. This is because the relationship is not linear but rather a square root function.
- Squaring both sides of the original formula gives:
T2=4π2Lg
- From this equation, we can see that:
T2∝L
- This indicates that T2 is directly proportional to L. Therefore, if we plot T2 on the y-axis and L on the x-axis, we expect a straight line that passes through the origin. The slope of this line will be 4π2g.
- (i) The graph between L and T is a curve (specifically, a square root curve).
- (ii) The graph between L and T2 is a straight line passing through the origin.
Topper's Solved these Questions
- EXPERIMENTSBOOK - DC PANDEY ENGLISHCHAPTER - EXPERIMENTSEXERCISE - Exercise 3.4
2 Videos
- EXPERIMENTSBOOK - DC PANDEY ENGLISHCHAPTER - EXPERIMENTSEXERCISE - Exercise 3.5
2 Videos
- EXPERIMENTSBOOK - DC PANDEY ENGLISHCHAPTER - EXPERIMENTSEXERCISE - Exercise 3.2
2 Videos
- ELECTROSTATICSBOOK - DC PANDEY ENGLISHCHAPTER - ELECTROSTATICSEXERCISE - Integer
17 Videos
- FLUID MECHANICSBOOK - DC PANDEY ENGLISHCHAPTER - FLUID MECHANICSEXERCISE - Medical entranes gallery
49 Videos
Similar Questions
Knowledge Check
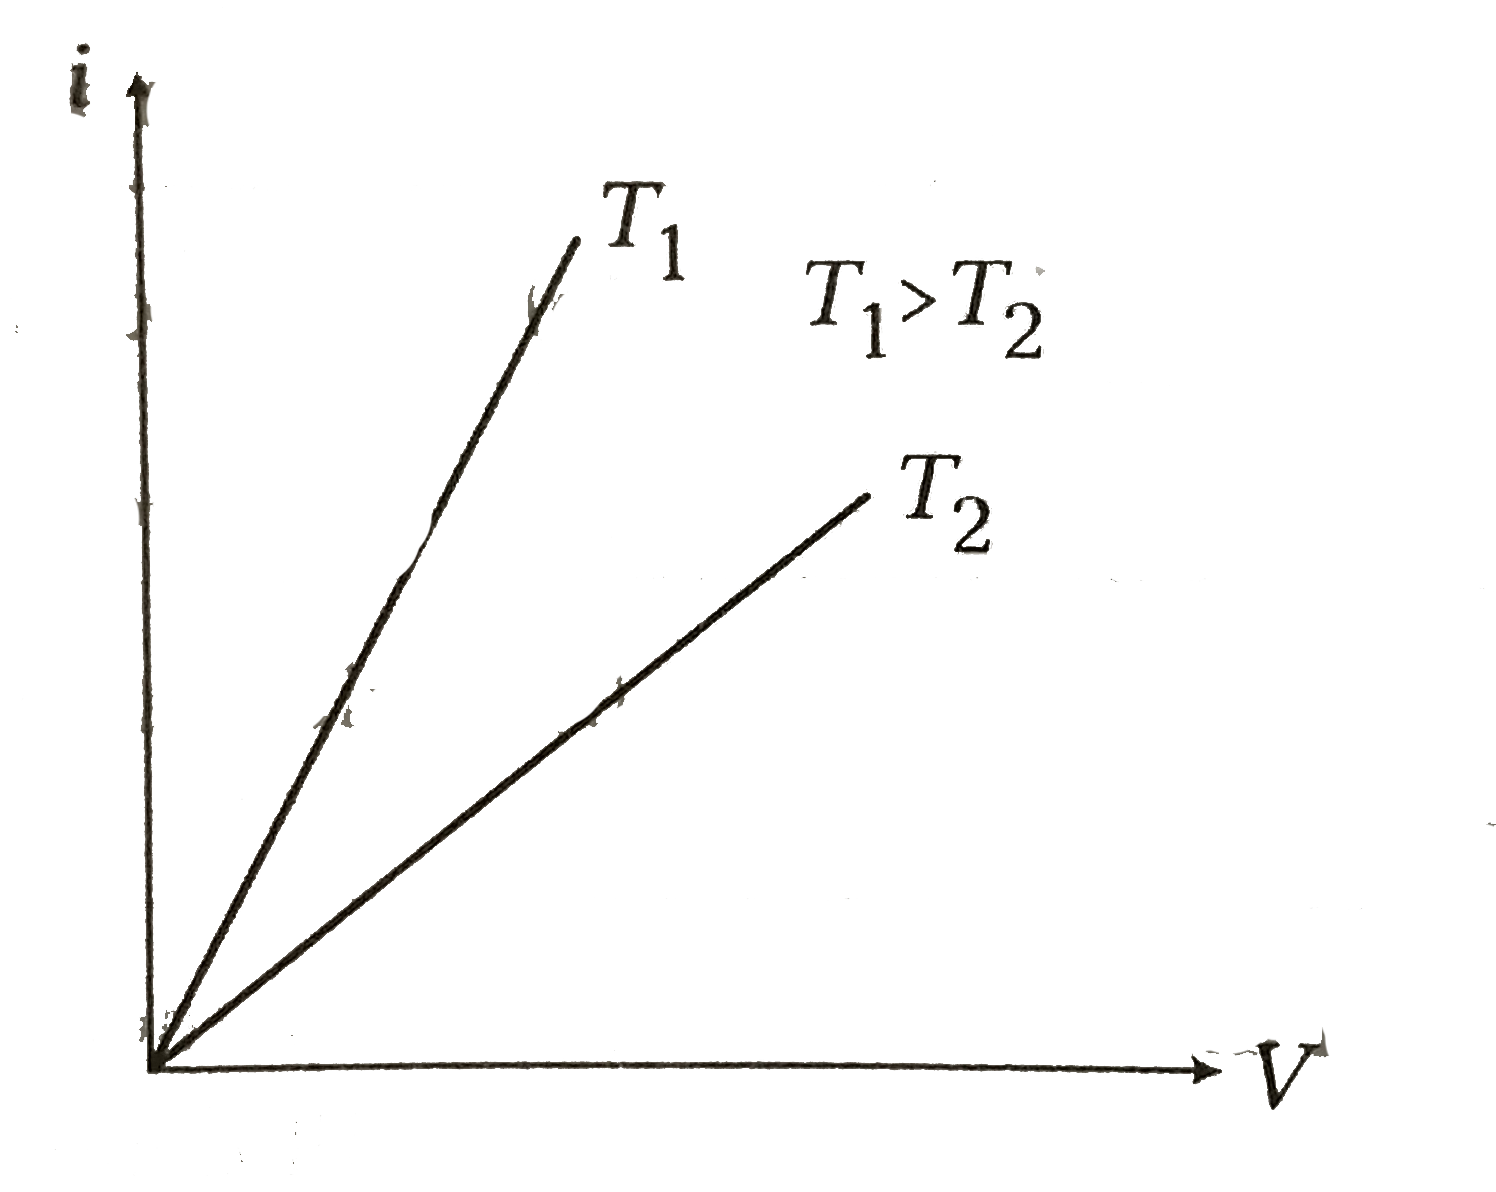
Assertion : Current versus potential difference (i-V) graph for a conductor at two different temperatures T1 and T2 is shown in figure. Hence T1>T2.

Reason : Resistance of a conductor increases with rise in temperature.Acos2θBsin2θCcot2θDtan2θ
The graph between (P/T) and T for a gas at constant volume will be:
View SolutionAn element L consists of molecules.
When L is heated with iron metal, it forms a compound FeL. What type of chemical term would you use for the change undergone by L ?
View SolutionThe graph between time period (T) and length (l) of a simple pendulum is
View SolutionYou are given three lenses L1,L2andL3 each of focal length 10 cm. An object is kept at 15 cm in front of L1, as shown. The final real image is formed at the focus 'T' of L3. Find the separations between L1,L2andL3.

View SolutionWhat do you understand by S.T.P. ?
View SolutionAn element L consists of molecules. [i]What type of bonding is present in the particles that make up L. [ii] When L is heated with ieon metal, it forms a compound FeL. What chemical term would you use to describe the change undergone by L.
View SolutionYou are given three lenses L1,L2andL3 each of focal length 20 cm. An object is kept at 40 cm in front of L1, as shown. The final real image is formed at the focus 'I' of L3. Find the separations between L1,L2andL3.

View Solution
