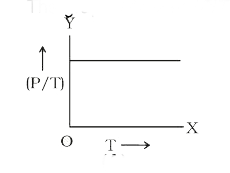
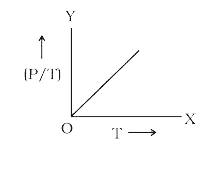
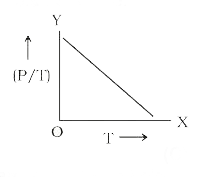
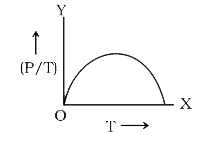
The graph between (P/T) and T for a gas at constant volume will be:
The correct Answer is:A
To solve the question regarding the graph between (P/T) and T for a gas at constant volume, we can follow these steps:
Step 1: Understand the Ideal Gas Law
The ideal gas law is given by the equation:
PV=nRT
where:
- P = pressure of the gas
- V = volume of the gas
- n = number of moles of the gas
- R = ideal gas constant
- T = temperature of the gas in Kelvin
Step 2: Rearrange the Ideal Gas Law
At constant volume, we can rearrange the ideal gas law to express pressure in terms of temperature:
P=nRTV
Step 3: Divide Pressure by Temperature
To find the relationship between P/T and T, we divide both sides of the equation by T:
PT=nRV
Step 4: Analyze the Equation
From the equation PT=nRV, we can see that:
- PT is constant at constant volume (since n and R are constants, and V is also constant).
- This shows that PT does not depend on T.
Step 5: Graphical Representation
Since PT is constant, the graph of PT versus T will be a horizontal line. This means that as temperature increases, the value of PT remains the same.
Conclusion
The correct graph between PT and T for a gas at constant volume is a horizontal line along the x-axis.
---
The ideal gas law is given by the equation:
PV=nRT
where:
- P = pressure of the gas
- V = volume of the gas
- n = number of moles of the gas
- R = ideal gas constant
- T = temperature of the gas in Kelvin
At constant volume, we can rearrange the ideal gas law to express pressure in terms of temperature:
P=nRTV
To find the relationship between P/T and T, we divide both sides of the equation by T:
PT=nRV
From the equation PT=nRV, we can see that:
- PT is constant at constant volume (since n and R are constants, and V is also constant).
- This shows that PT does not depend on T.
Since PT is constant, the graph of PT versus T will be a horizontal line. This means that as temperature increases, the value of PT remains the same.
The correct graph between PT and T for a gas at constant volume is a horizontal line along the x-axis.
Topper's Solved these Questions
- GASEOUS STATE & THERMODYNAMICSBOOK - VMC MODULES ENGLISHCHAPTER - GASEOUS STATE & THERMODYNAMICSEXERCISE - JEE MAIN (ARCHIVE )
81 Videos
- GASEOUS STATE & THERMODYNAMICSBOOK - VMC MODULES ENGLISHCHAPTER - GASEOUS STATE & THERMODYNAMICSEXERCISE - JEE ADVANCED (ARCHIVE )
111 Videos
- GASEOUS STATE & THERMODYNAMICSBOOK - VMC MODULES ENGLISHCHAPTER - GASEOUS STATE & THERMODYNAMICSEXERCISE - Level - 1
75 Videos
- ENERGY & MOMENTUMBOOK - VMC MODULES ENGLISHCHAPTER - ENERGY & MOMENTUMEXERCISE - JEE ADVANCE (ARCHIVE) - TRUE/FALSE TYPE
1 Videos
- GRAVITATIONBOOK - VMC MODULES ENGLISHCHAPTER - GRAVITATIONEXERCISE - JEE Advance (Archive) TRUE/FALSE
1 Videos
Similar Questions
The ideal gas equation for 1 mol of ideal gas is PV = nRT
graph between P and T at constant volume, i.e. isochores are plotted as under
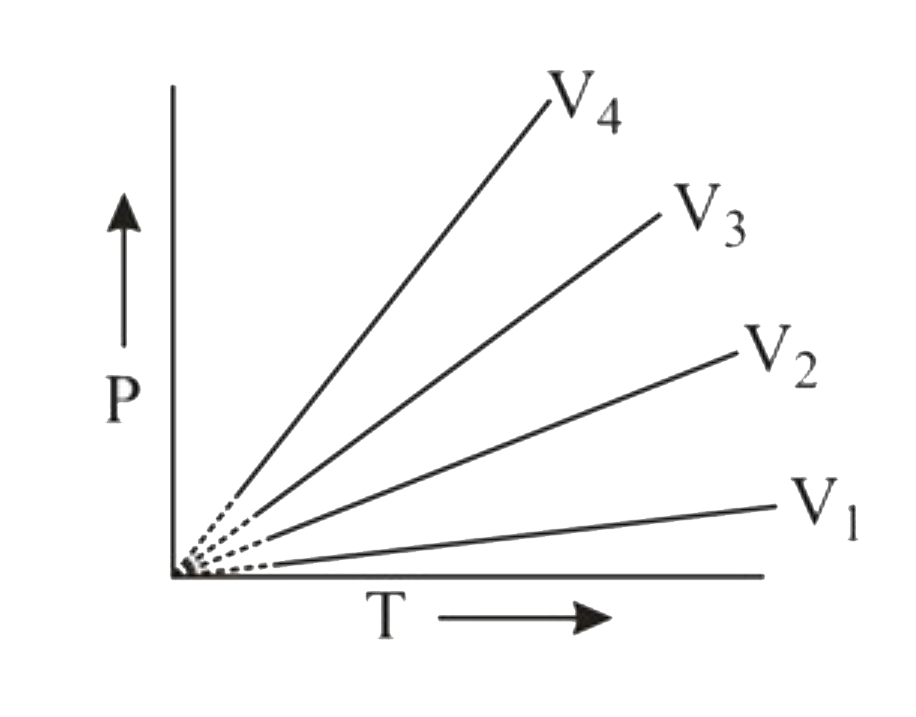
Which of the following order of volume is correct ?
View SolutionIf P is doubled and T is reduced to half at constant volume, what will be its effect on the mean free path (λ) of a gas molecule?
View Solution
Knowledge Check
Given is the graph between PVT and P for 1 gm of oxygen gas at two different temperatures T1andT2 Fig. Given, density of oxygen =1.427kgm−3. The value of (PV)/(T) at the point A and the relation between T1andT2 are respectively :
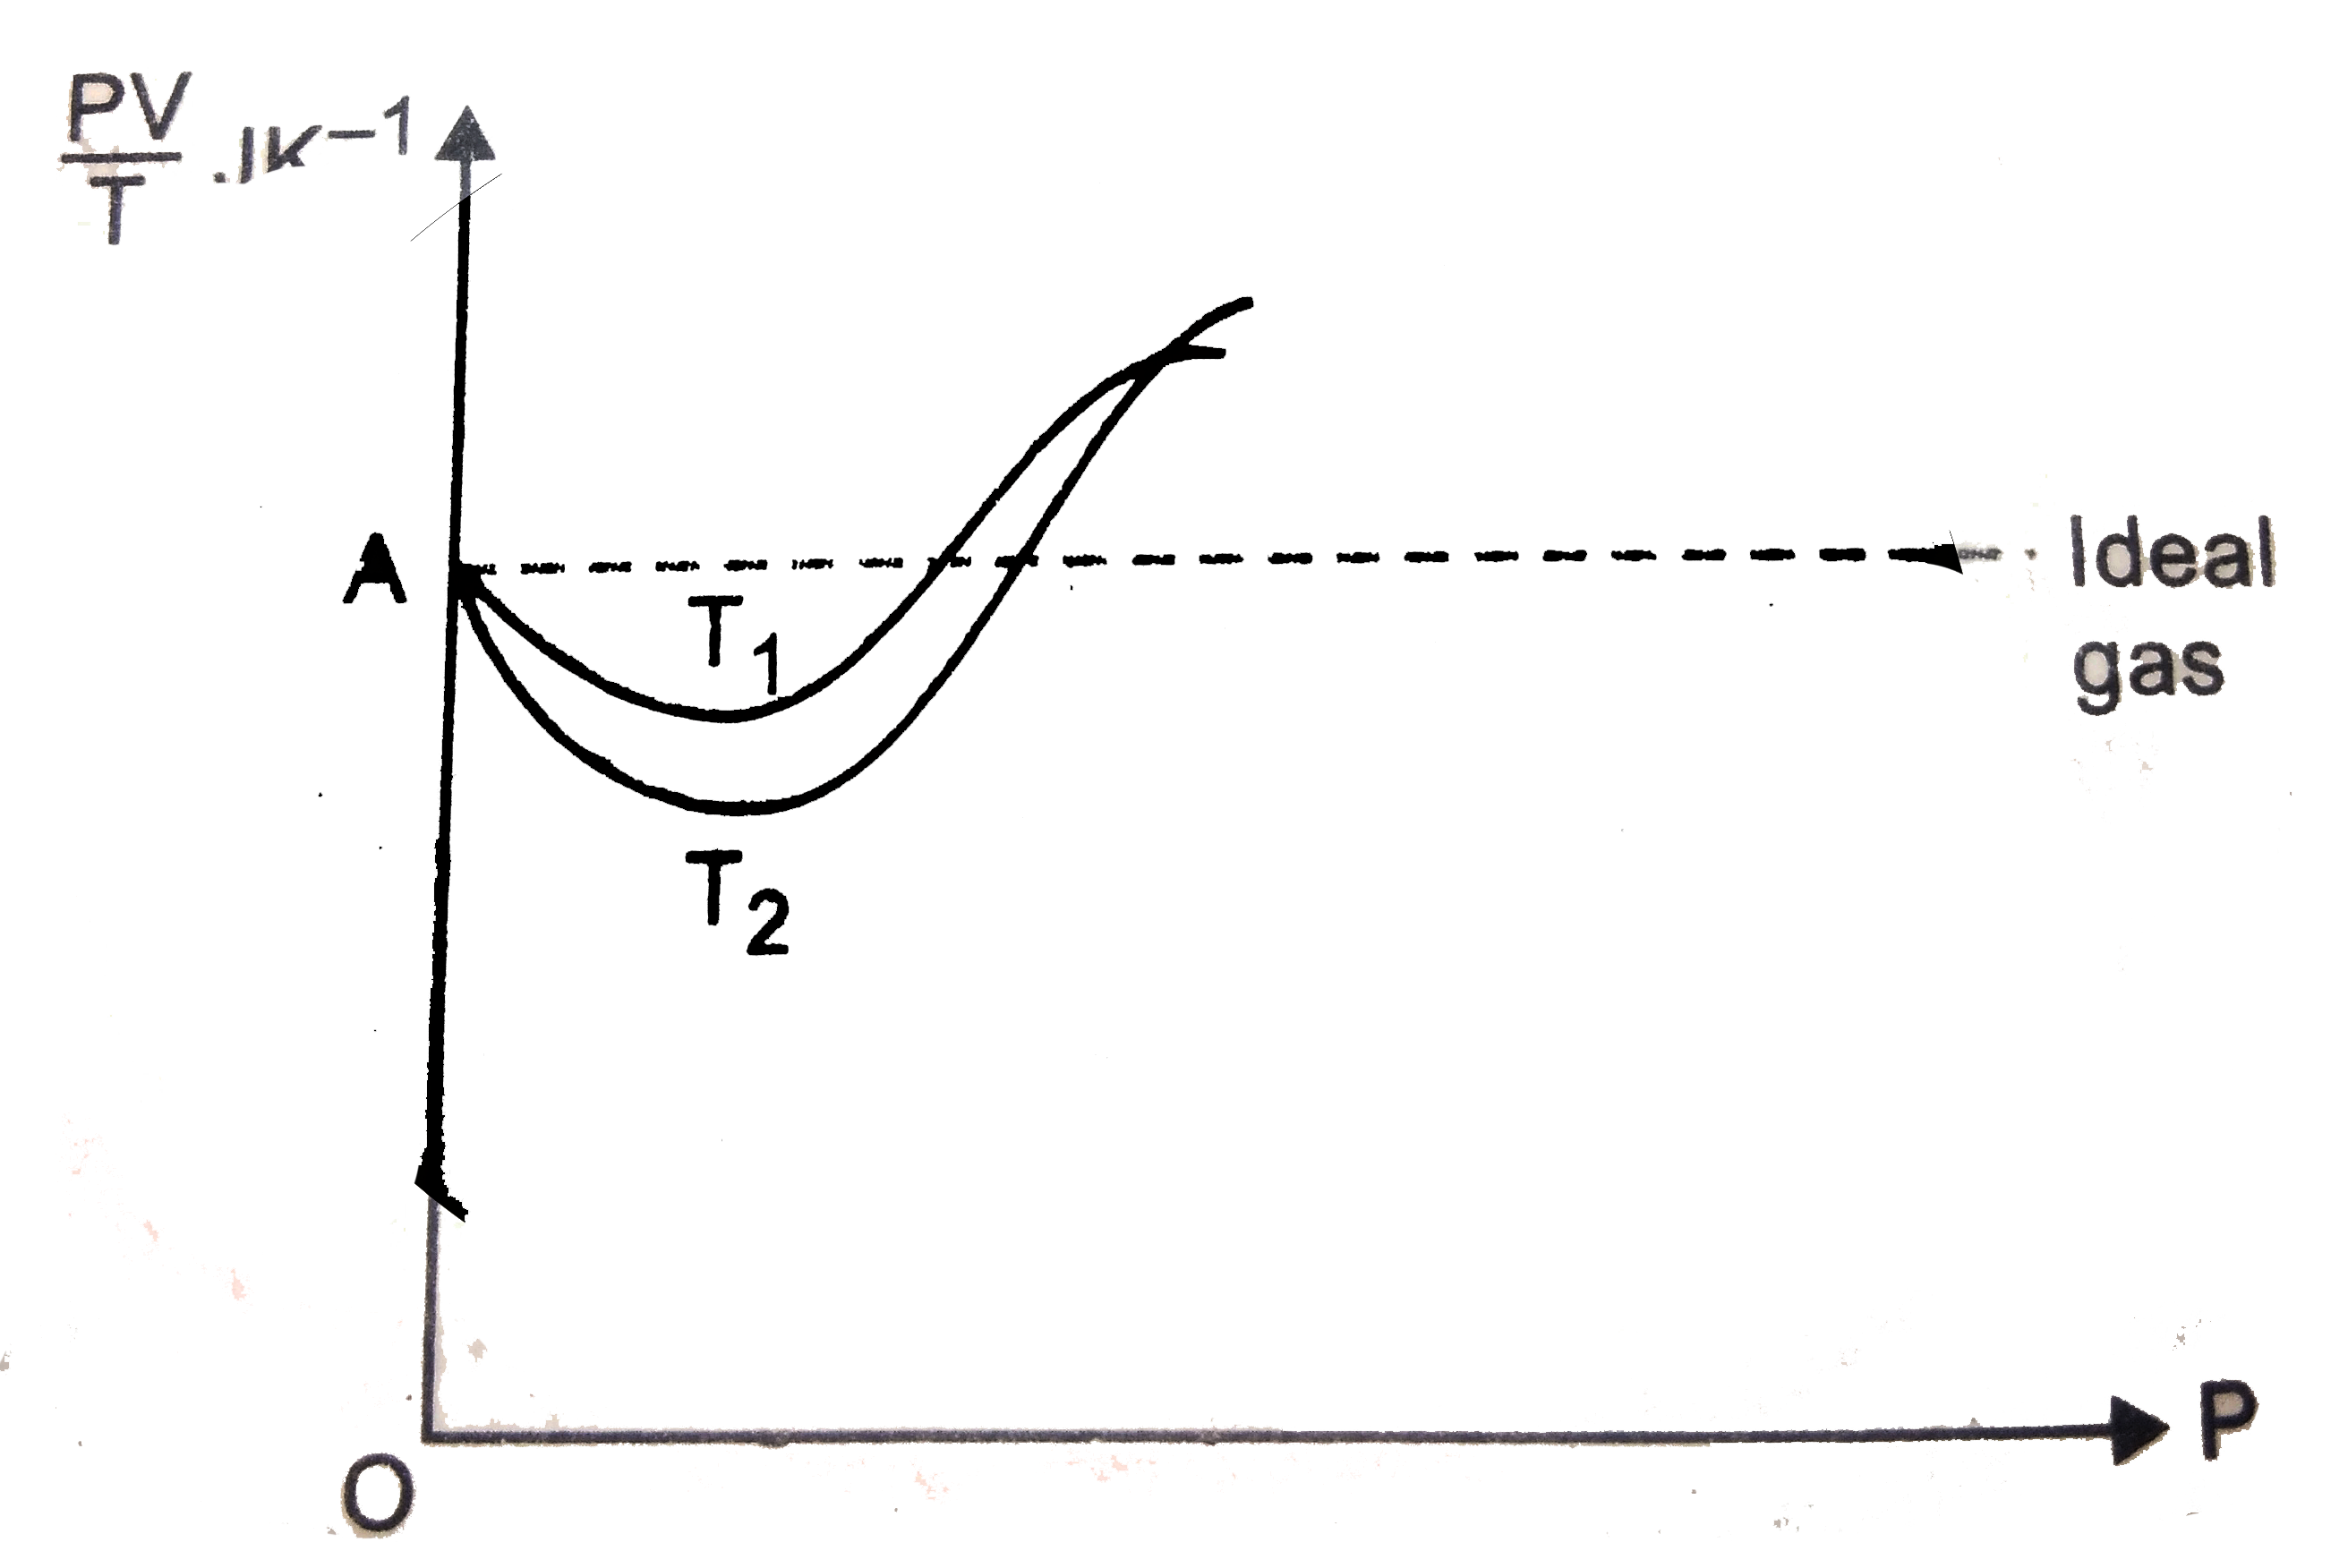 A0.259JK−1andT1<T2B8.314gJmol−1K−1andT1>T2C0.259JK−1andT1>T2D4.28gJK−1andT1<T2
The graph pressure versus temperature (T) at constant volume is a straight line.(T/F)
View SolutionThe molar heat capacity for a gas at constant T and P is
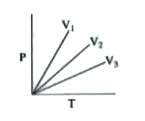
View SolutionUnder isochoric condition, graphs between P and T are shown below.Then volumes of gases are related as
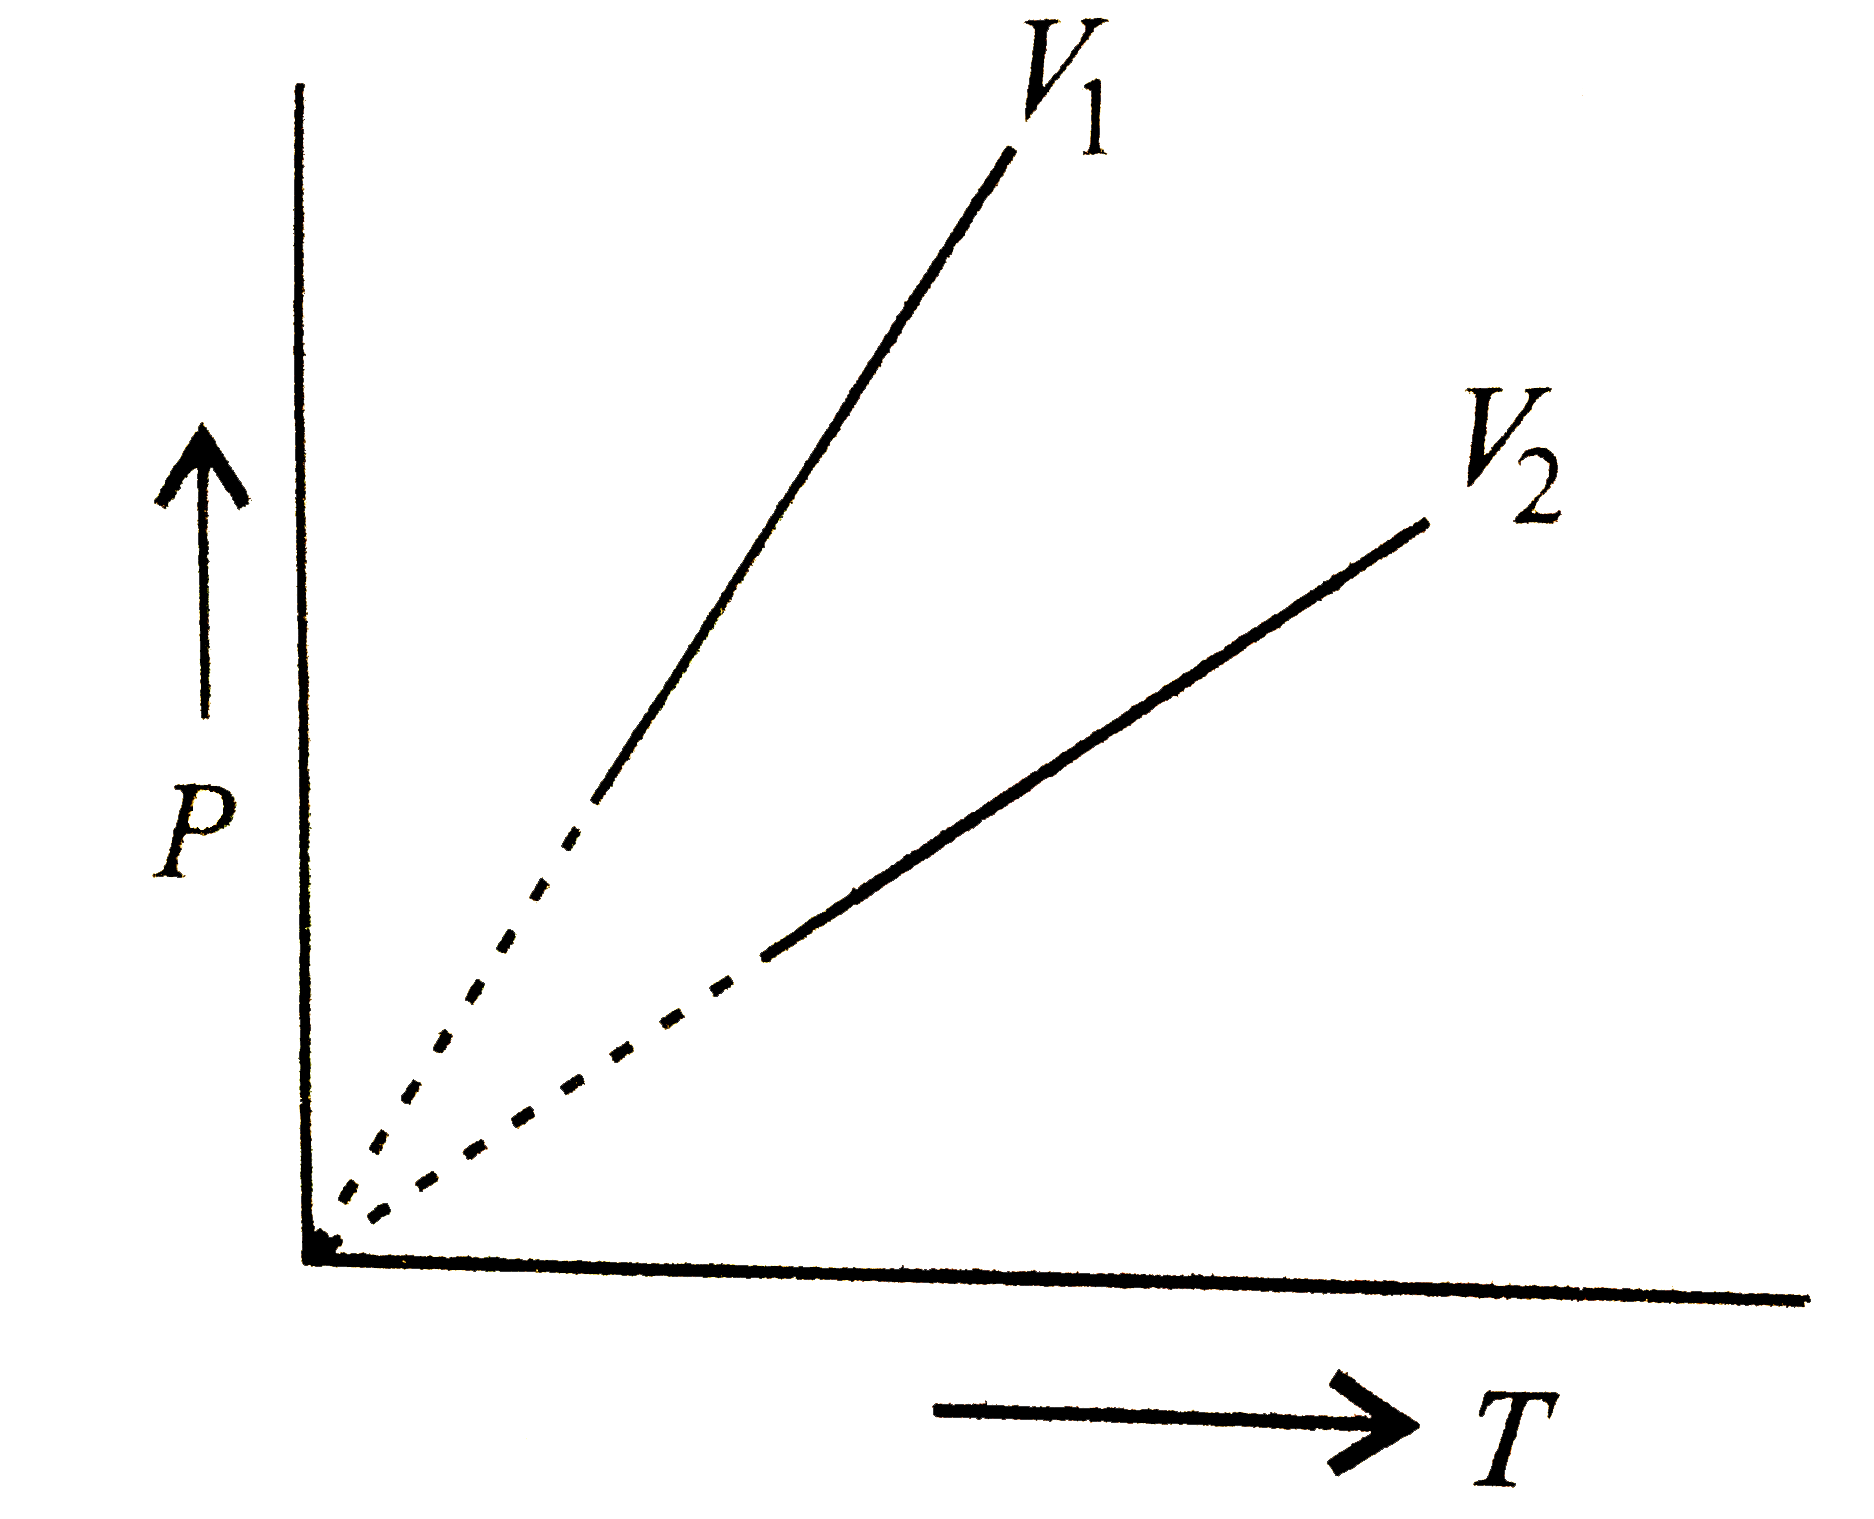
View SolutionA plot of P vs T for a given mass of gas at constant volume is a straight line . P vs T at constant volumes V1 and V2 for an ideal gas are shown below :
Which of the following is correct ?
View SolutionThe graph between the (velocity2) and temperature T of a gas is
View SolutionAn ideal gas has a molar heat capacity Cv at constant volume. Find the molar heat capacity of this gas as a function of its volume V, if the gas undergoes the following process :
(a) T=T0eαv ,
(b) p=p0eαv,
where T0,p0, and α are constants.
View SolutionIf heat energy is given to an ideal gas at constant pressure, then select the graph which best represents the variation of VT with temperature (T).
View Solution
