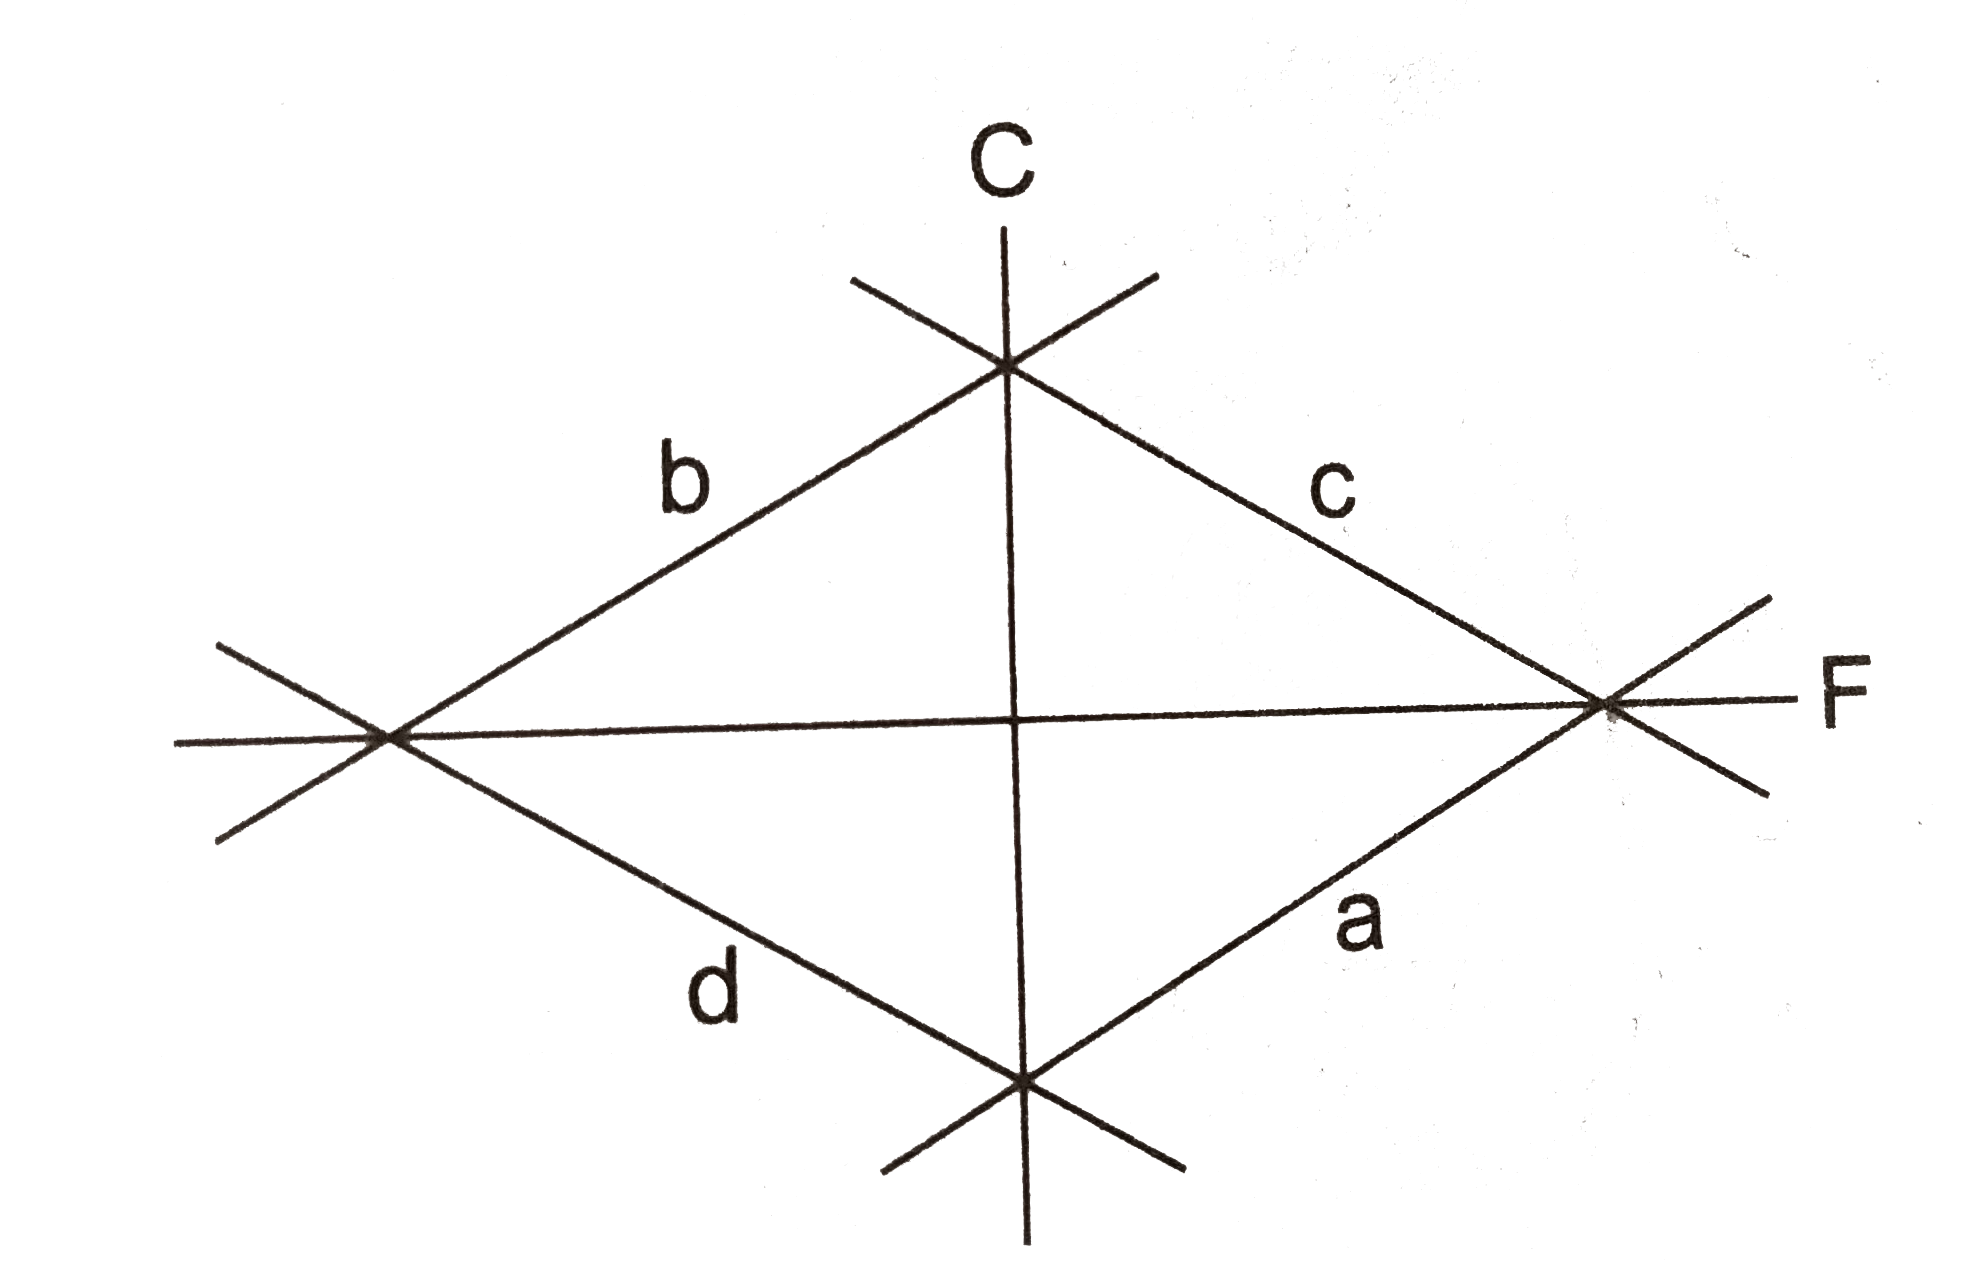
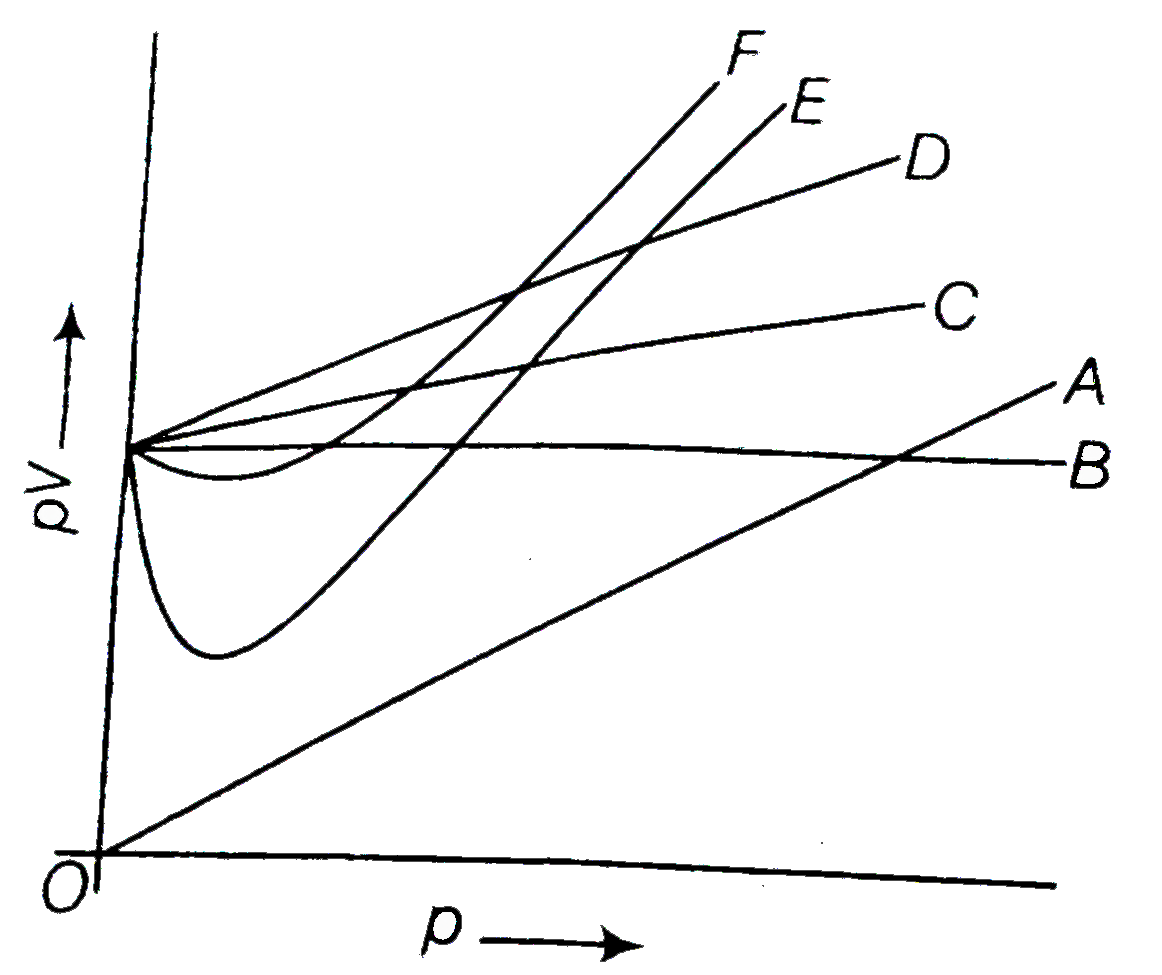
Which of the curves in figure represents the relation between Celsius and Fahrenheit temperatures? 
Video Solution
Text Solution
The correct Answer is:A
|
Answer
Step by step video & image solution for Which of the curves in figure represents the relation between Celsius and Fahrenheit temperatures? by Physics experts to help you in doubts & scoring excellent marks in Class 11 exams.
Updated on:21/07/2023Topper's Solved these Questions
- HEAT AND TEMPERATUREBOOK - HC VERMA ENGLISHCHAPTER - HEAT AND TEMPERATUREEXERCISE - Exercise
34 Videos
- HEAT AND TEMPERATUREBOOK - HC VERMA ENGLISHCHAPTER - HEAT AND TEMPERATUREEXERCISE - Question for Shor Answer
13 Videos
- HEAT AND TEMPERATUREBOOK - HC VERMA ENGLISHCHAPTER - HEAT AND TEMPERATUREEXERCISE - Worked out Examples
15 Videos
- GRAVITATIONBOOK - HC VERMA ENGLISHCHAPTER - GRAVITATIONEXERCISE - Question for short Answers
18 Videos
- HEAT TRANSFERBOOK - HC VERMA ENGLISHCHAPTER - HEAT TRANSFEREXERCISE - QUESTIONS FOR SHORT ANSWER
11 Videos
Similar Questions
Knowledge Check
A certain medication must be stored at a temperature, t, that may range between a low at 45∘ Fahrenheit a high of 85∘ Fahreheit. Which inequality represents the allowable range of Fahrenheit temperature?
A|t−65|≤20B|t+20|≤65C|t+65|≤20D|t−20|≤85In certain greenhouse for plants, the Fahrenheit temperature, F, is controlled so that it does not vary from 79∘ by more than 7∘. Which of the following best expresses the possible range in Fahrenheit temperature of the greenhouse?
A|F−79|≤7B|F−79|>7C|F−7|≤79D|F−7|>79
Celsius, Fahrenheit, Thermometer are?
View SolutionDifference between Celsius scale and Fahrenheit scale
View SolutionHow are the Celsius and Fahrenheit scales inter related ?
View SolutionWhat is the relationship between the Celsius and the Kelvin scales of temperature ?
View SolutionWhat is the Fahrenheit scale of temperature ?
View SolutionWhat is the Celsius scale of temperature ?
View Solution

