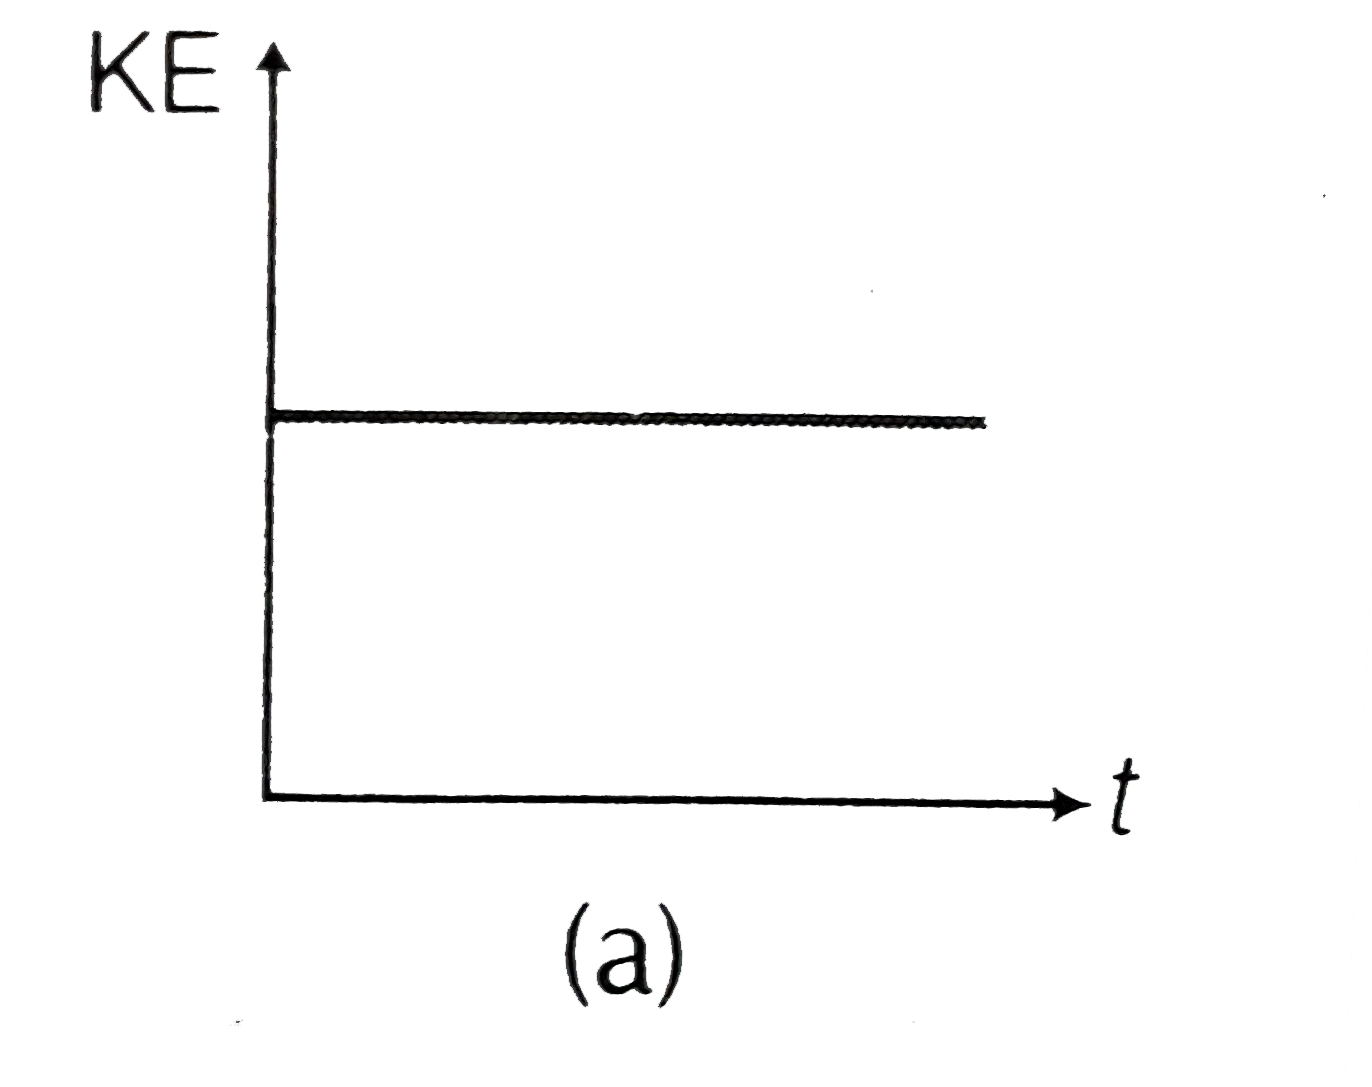
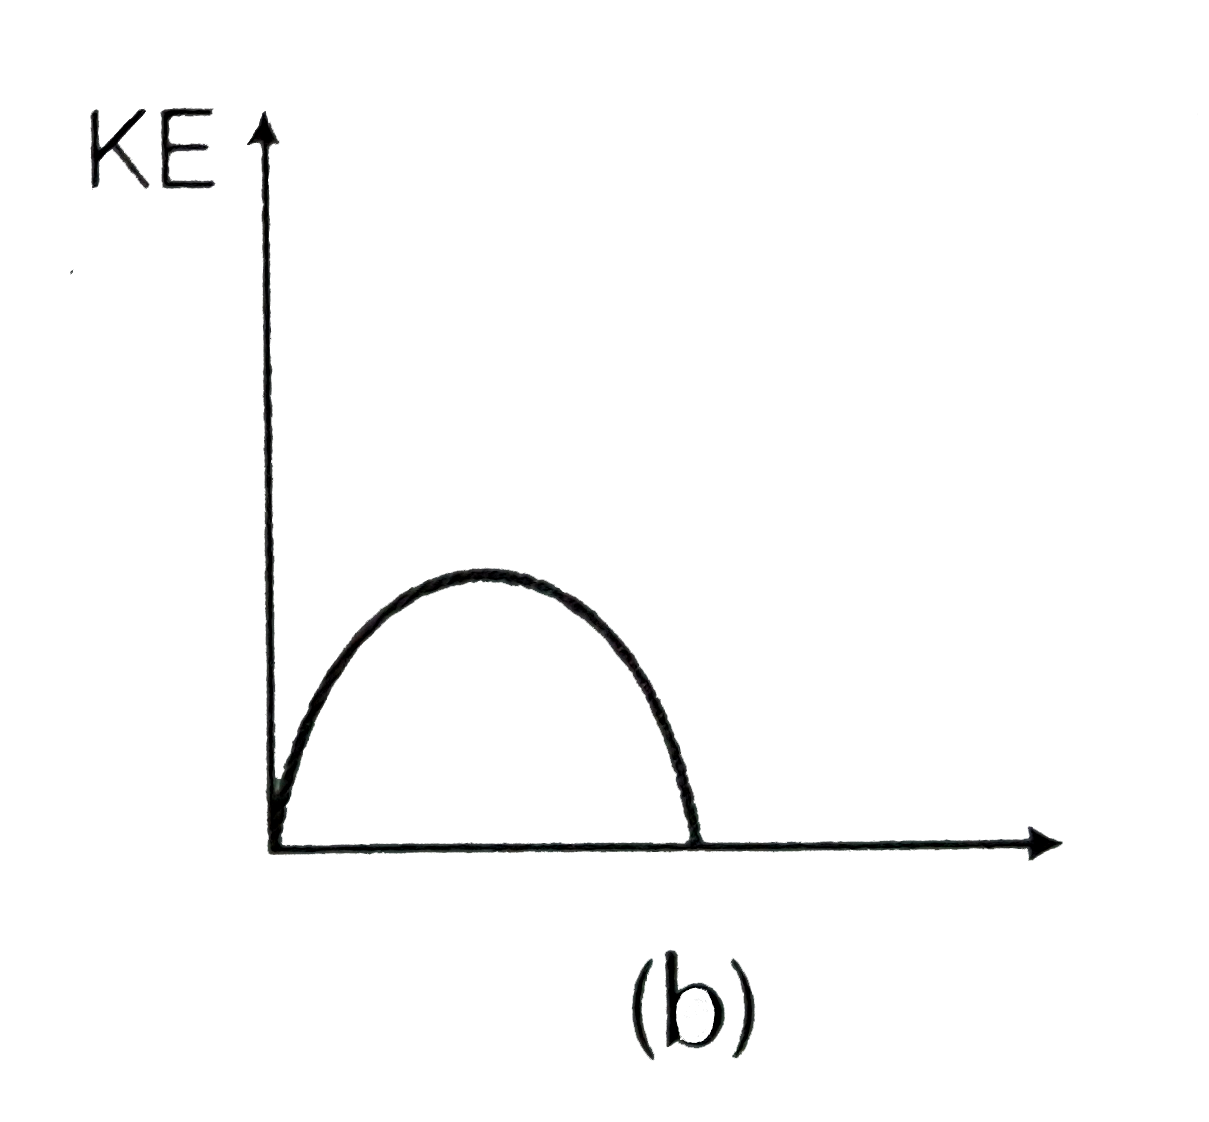
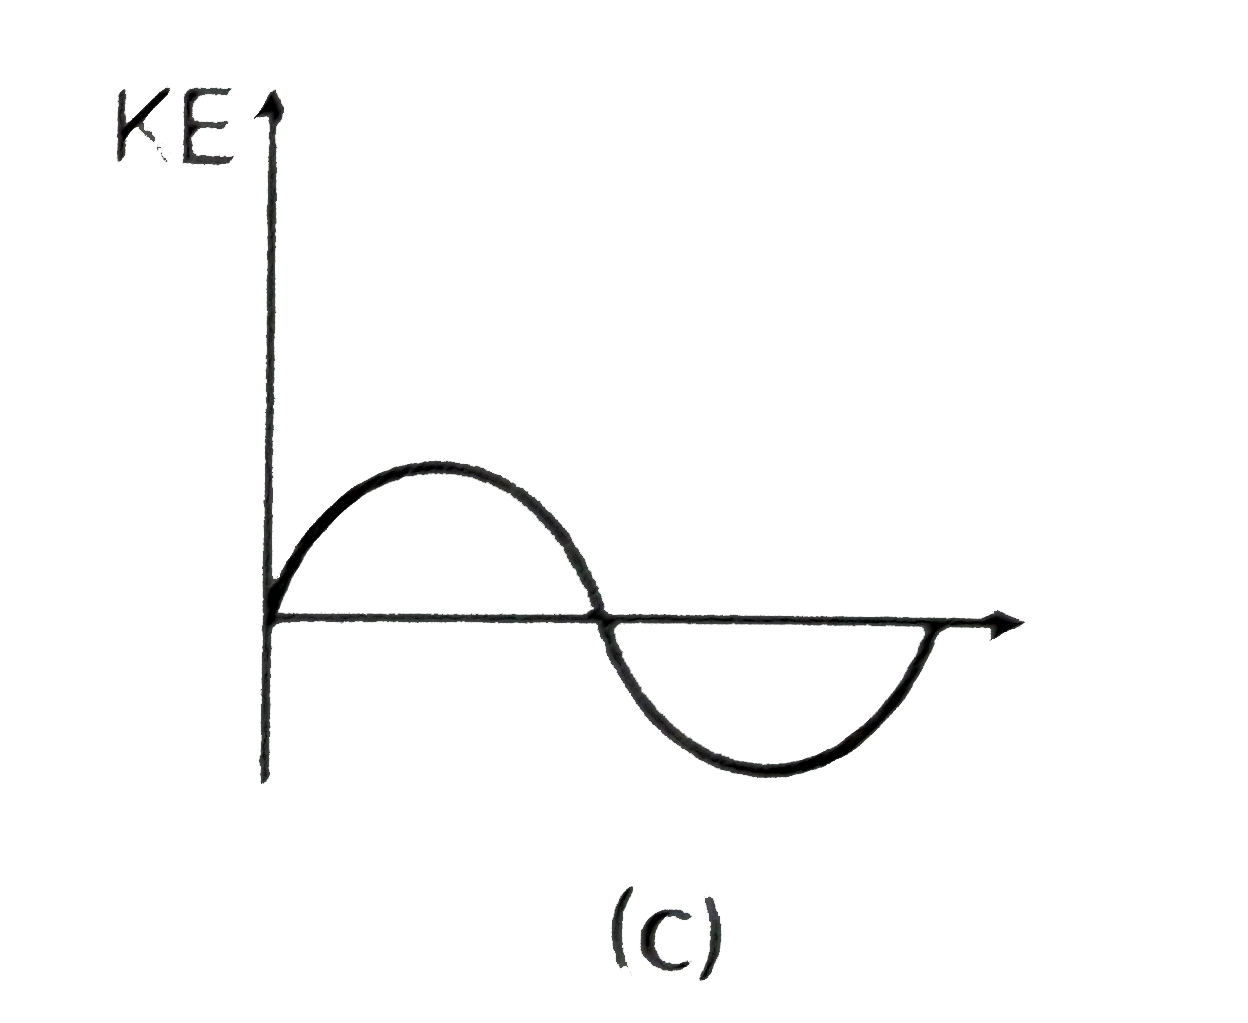
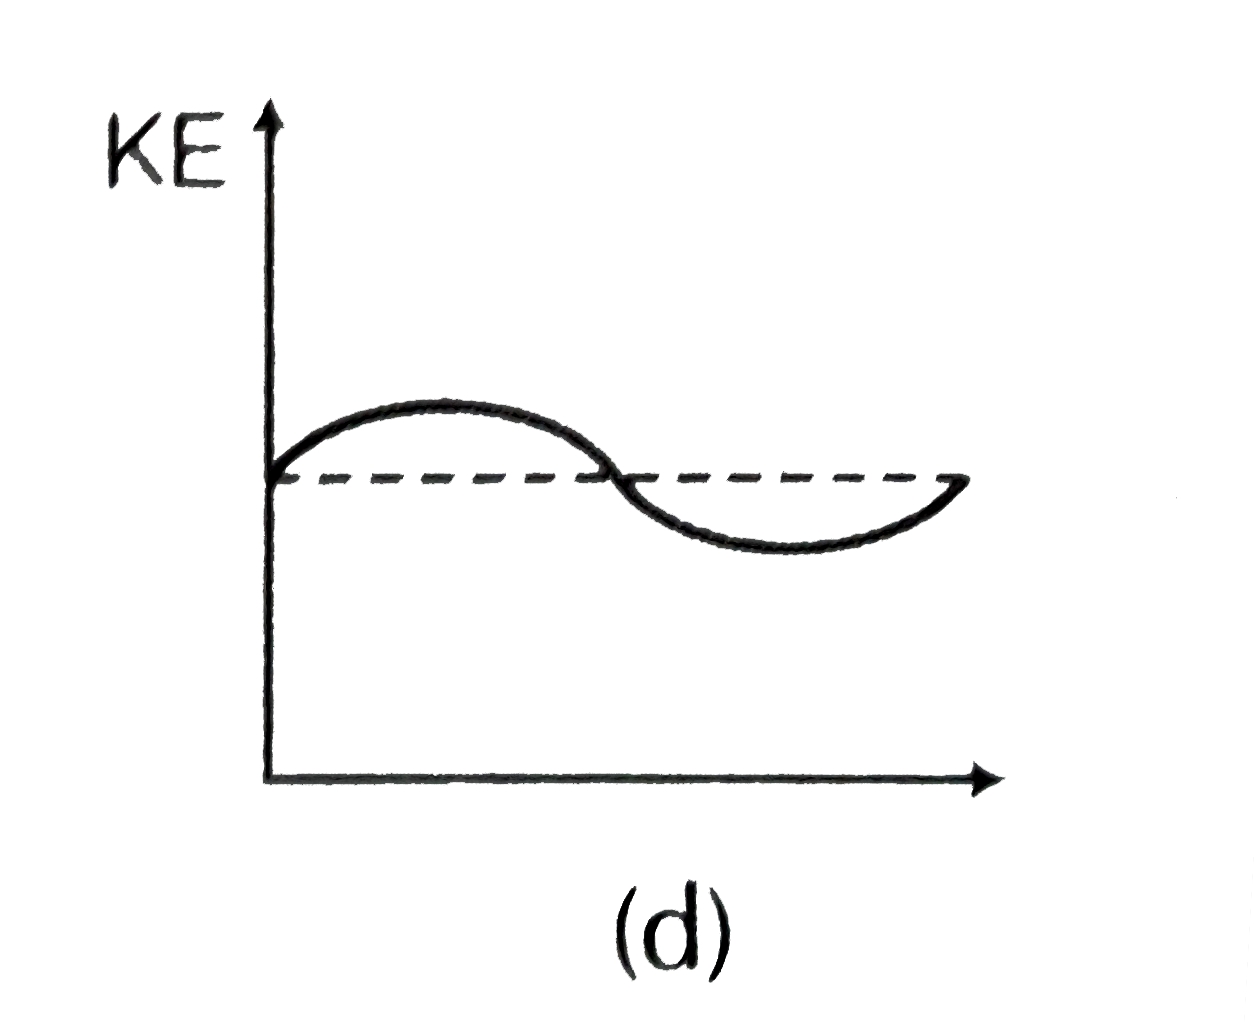
Which of the diagrams shown in figure. Most closely shows the variation inkinetic energy of the earth as it moves once around the sun in its elliptical orbit ?
A
B
C
D
Text Solution
(d) When the earth closest to the sun, speed of the earth is maximum, hence KE is maximum, When the earth is farthest from the sun is minimum hence, KE is minimum but never zero and negative. This variation is correctly represented by option(d).
|
Similar Questions
Knowledge Check
The earth revolves round the sun in an elliptical orbit. Its speed
Agoes on decreasing continuouslyBgreatest when it is closest to the sunCgreatest when it is farthest from the sunDconstant at all the points on the orbitWhen the earth revolves round the sun in an elliptical orbit, its kinetic energy is
Ago on decreasing continuouslyBgreatest when it is closest to the sunCgreatest when it is farthest from the sunDconstant at all point on the orbitA planet of mass m is moving around the sun in an elliptical orbit of semi-major axis a :
AThe total mechanical energy of the planet is varying periodically with timeBThe total energ of the planet is constant and equals −GmMs2a,Ns is mass of sunCTotal mechanical energy of the planet is constant and equals −GmMsa,M2 is mass of sunDDate is insufficient of arrice at a conclusion
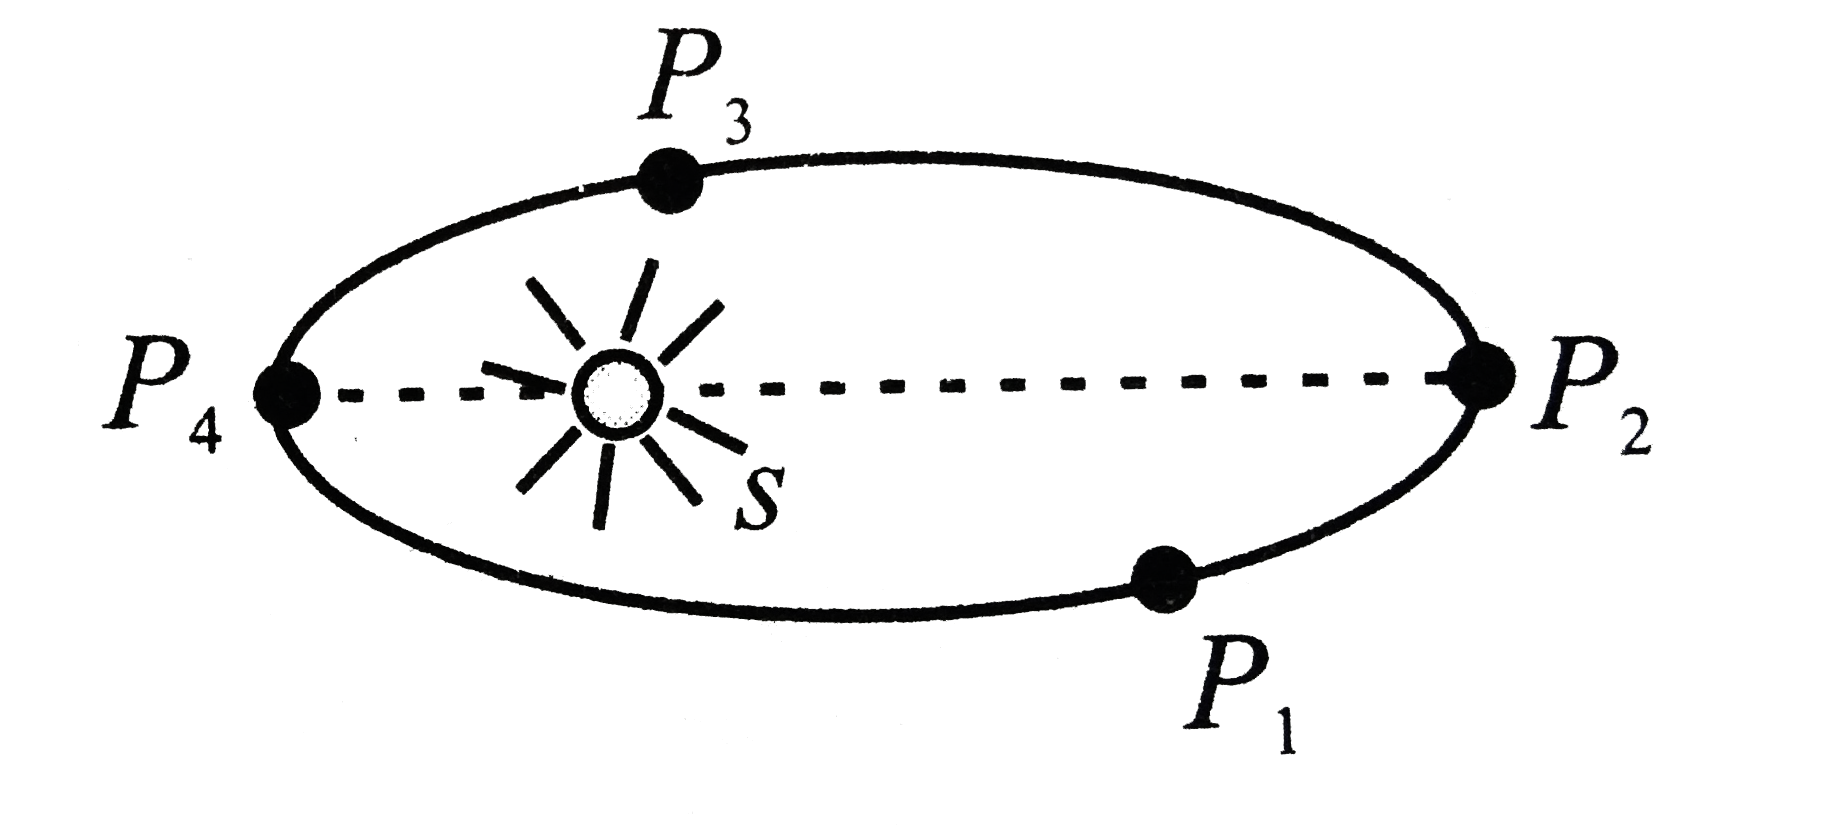
Figure shows a planet in an elliptical orbit around the Sun S. Where is the kinetic energy of the planet maximum?
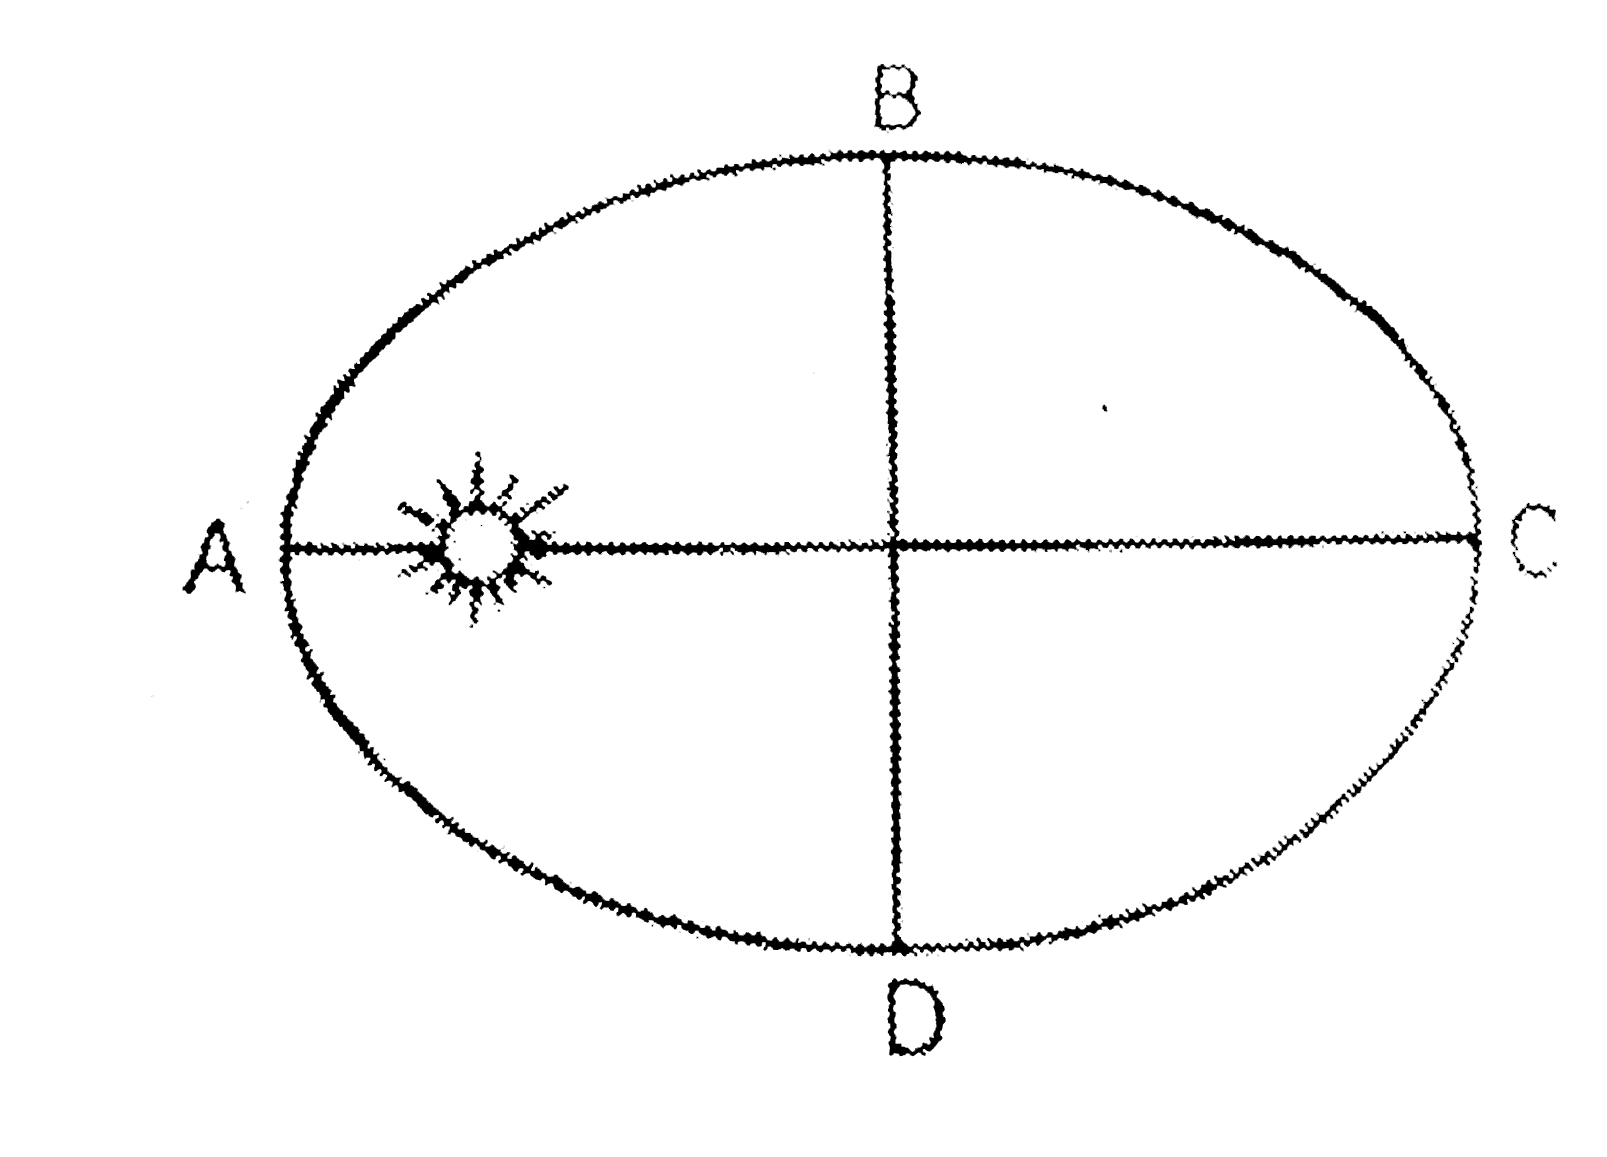
View SolutionIn adjoining figure earth goes around the sun in eliptical orbit on which point the orbital speed is maximum :
View SolutionA satellite revolves around the earth in an elliptical orbit. Its speed is
View SolutionA satellite revolves around the earth in elliptic orbit ,its speed is :
View SolutionFigure shows a planet in an elliptical orbit around the Sun S. Where is the kinetic energy of the planet maximum?

View Solution

