Which of the energy band diagram shown in the figure corrensponds to that of a semiconductor
A

B

C
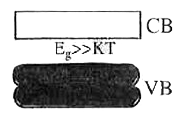
D
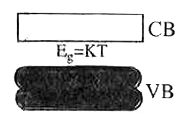
Video Solution
Text Solution
The correct Answer is:D
|
Answer
Step by step video solution for Which of the energy band diagram shown in the figure corrensponds to that of a semiconductor by Physics experts to help you in doubts & scoring excellent marks in Class 12 exams.
Updated on:21/07/2023Topper's Solved these Questions
- SEMICONDUCTOR DEVICESBOOK - AAKASH SERIESCHAPTER - SEMICONDUCTOR DEVICESEXERCISE - EXERCISE -I (P-N JUNCTION DIODE)
30 Videos
- SEMICONDUCTOR DEVICESBOOK - AAKASH SERIESCHAPTER - SEMICONDUCTOR DEVICESEXERCISE - EXERCISE -I (TRANSISTORS)
22 Videos
- SEMICONDUCTOR DEVICESBOOK - AAKASH SERIESCHAPTER - SEMICONDUCTOR DEVICESEXERCISE - EXAMPLES
56 Videos
- RAY OPTICSBOOK - AAKASH SERIESCHAPTER - RAY OPTICSEXERCISE - PROBLEMS ( LEVEL-II)
60 Videos
- UNITS AND MEASUREMENTBOOK - AAKASH SERIESCHAPTER - UNITS AND MEASUREMENTEXERCISE - PRACTICE EXERCISE
45 Videos
Similar Questions
Knowledge Check
Which of the diagram shown in figures respresents variation of total mechanical energy of a pendulam oscillation in air as function of time?
A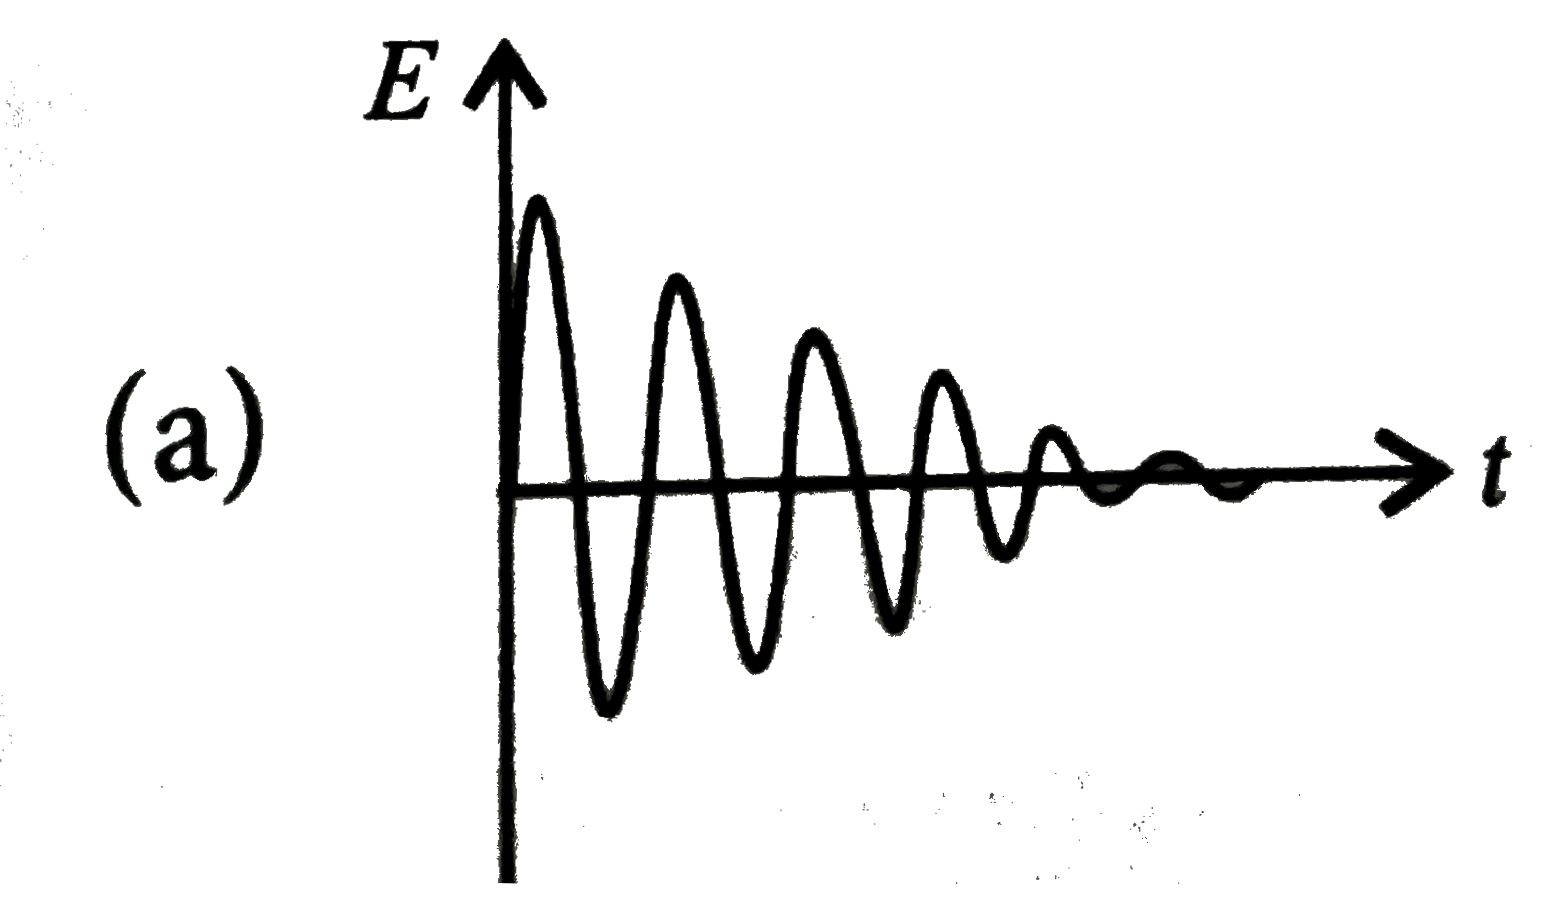 B
B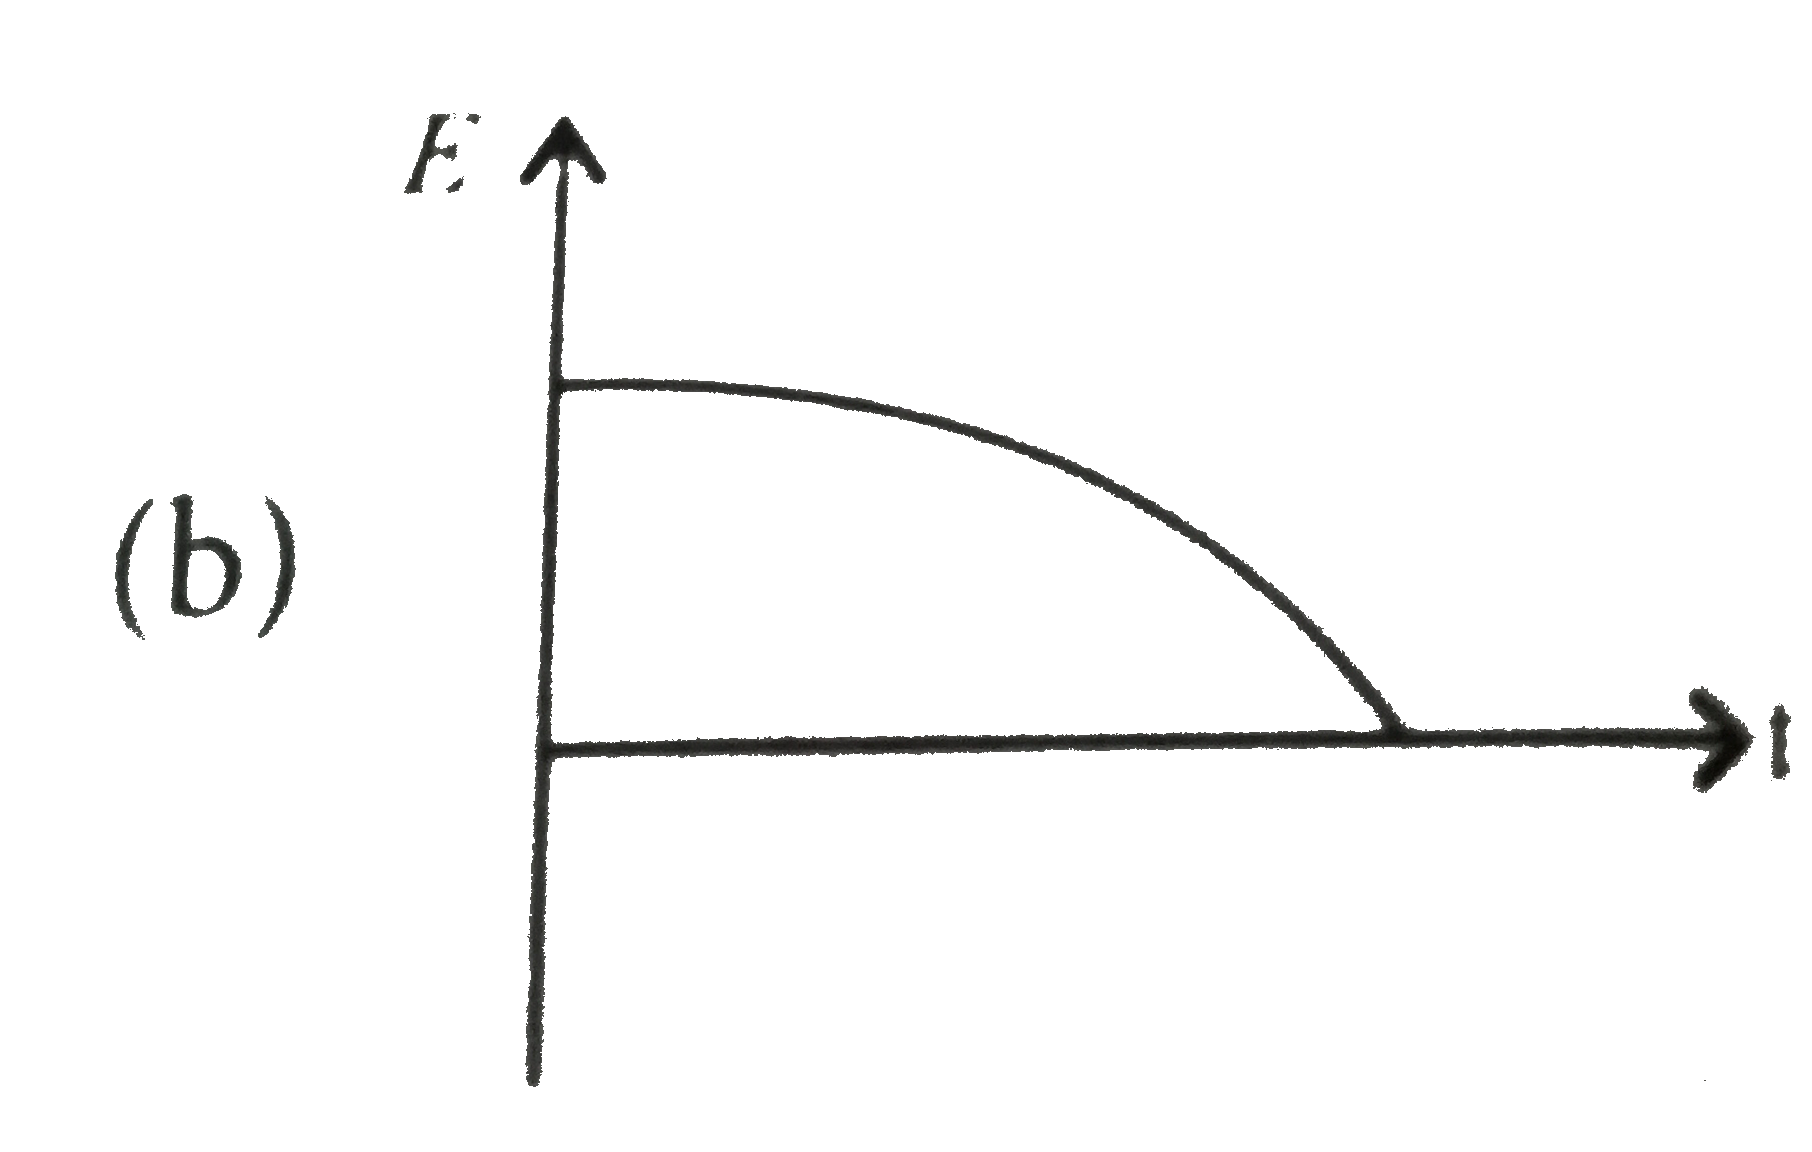 C
C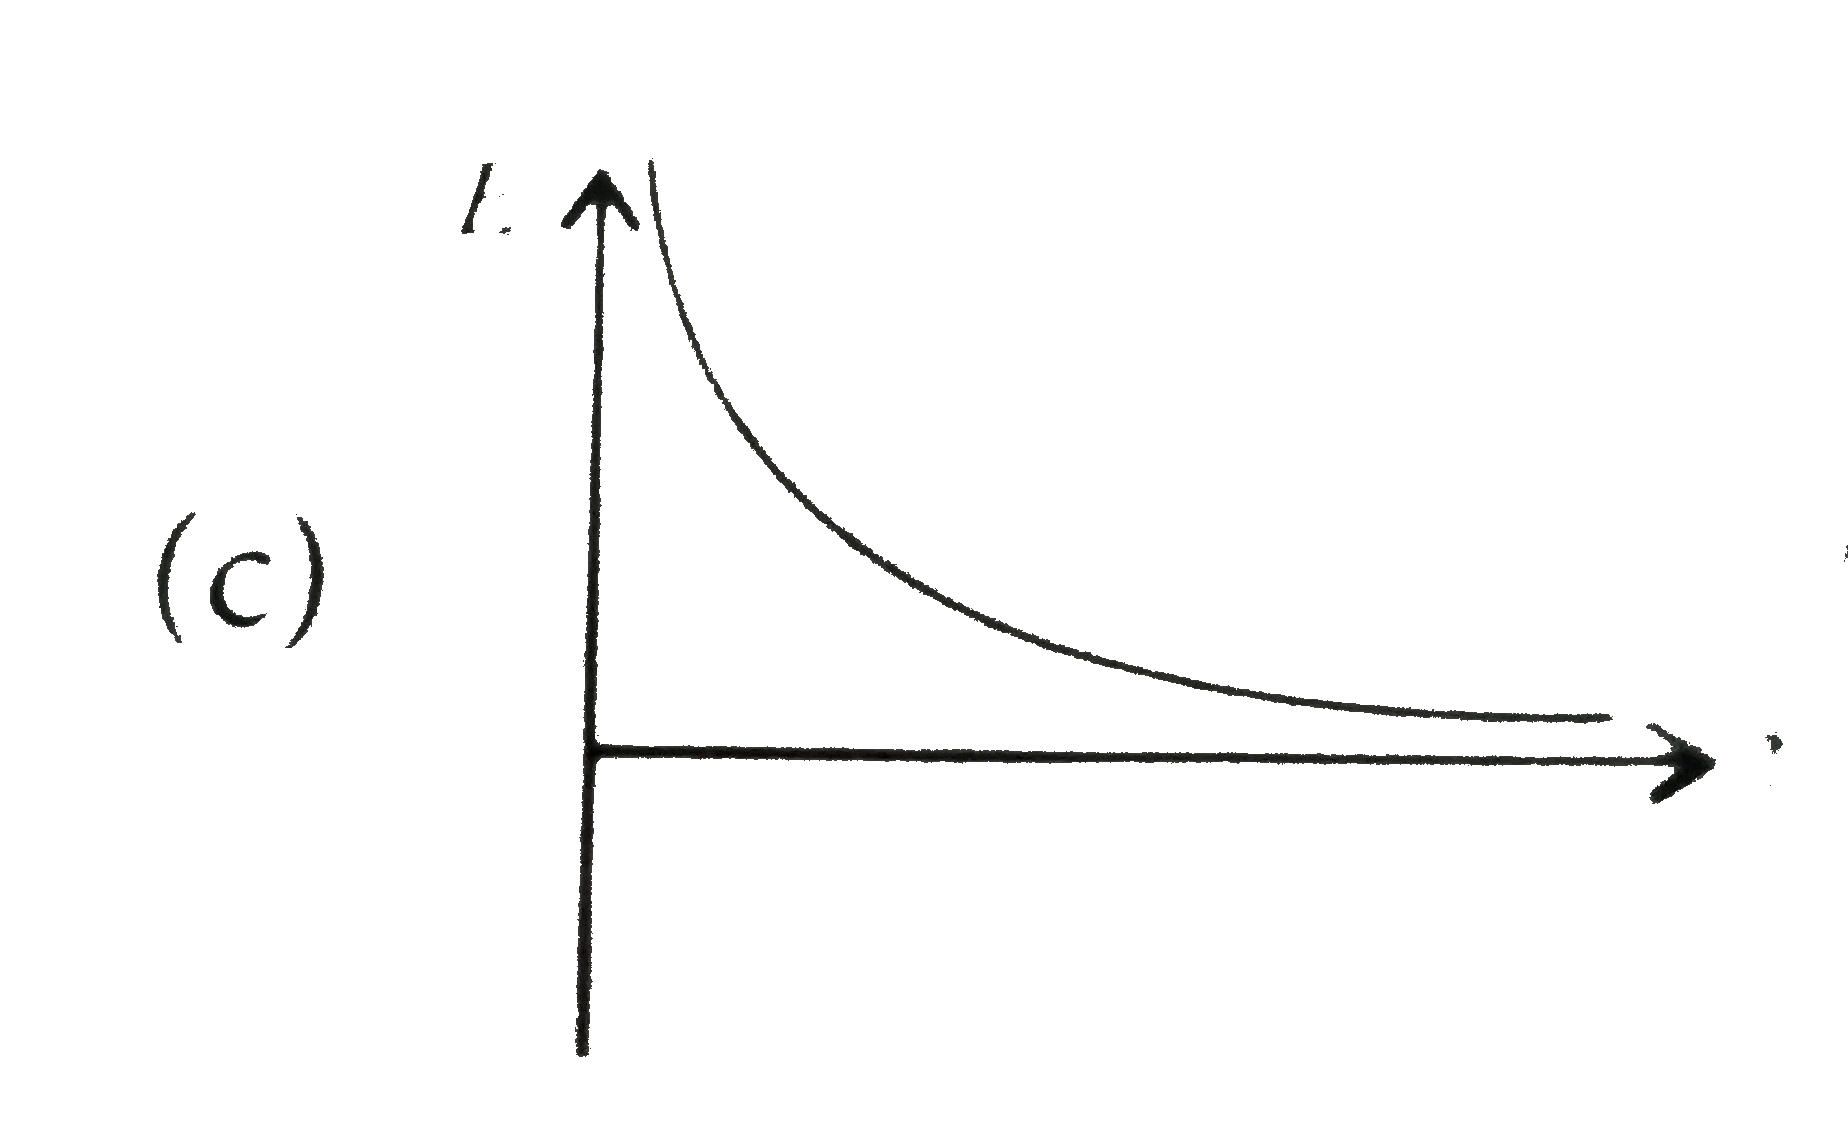 D
D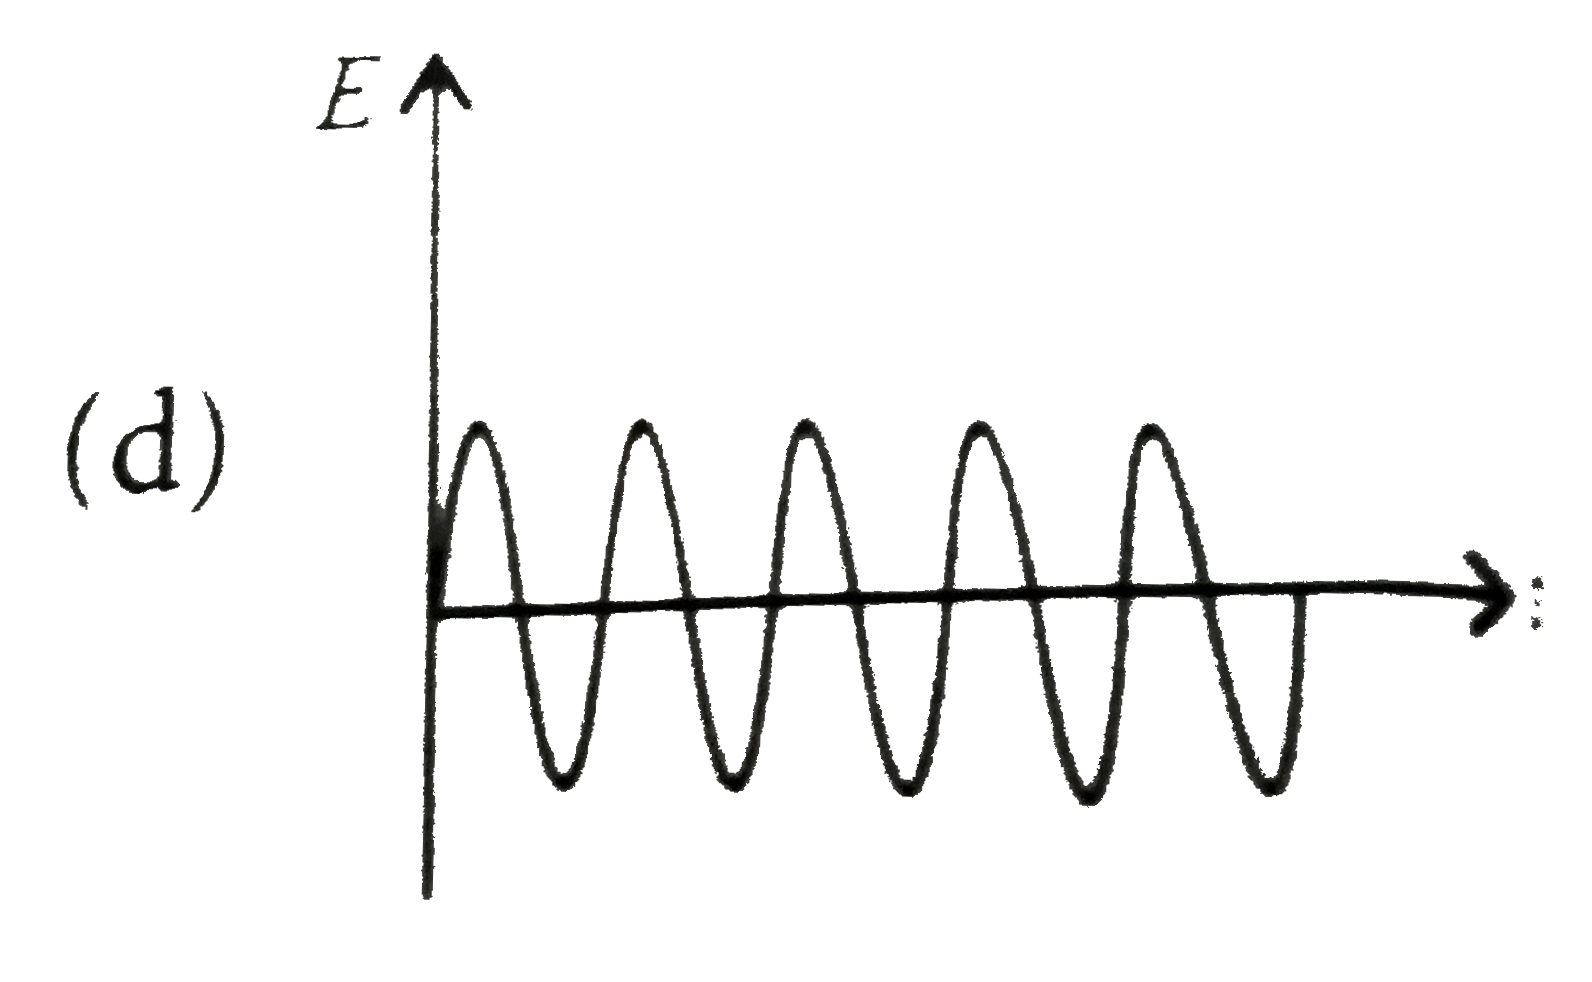
A body is moving unidirectionally under the influence of a source of constant power supplying energy. Which of the diagrams shown in figure. Correctly shows the displacement-time curve for its motion ?
A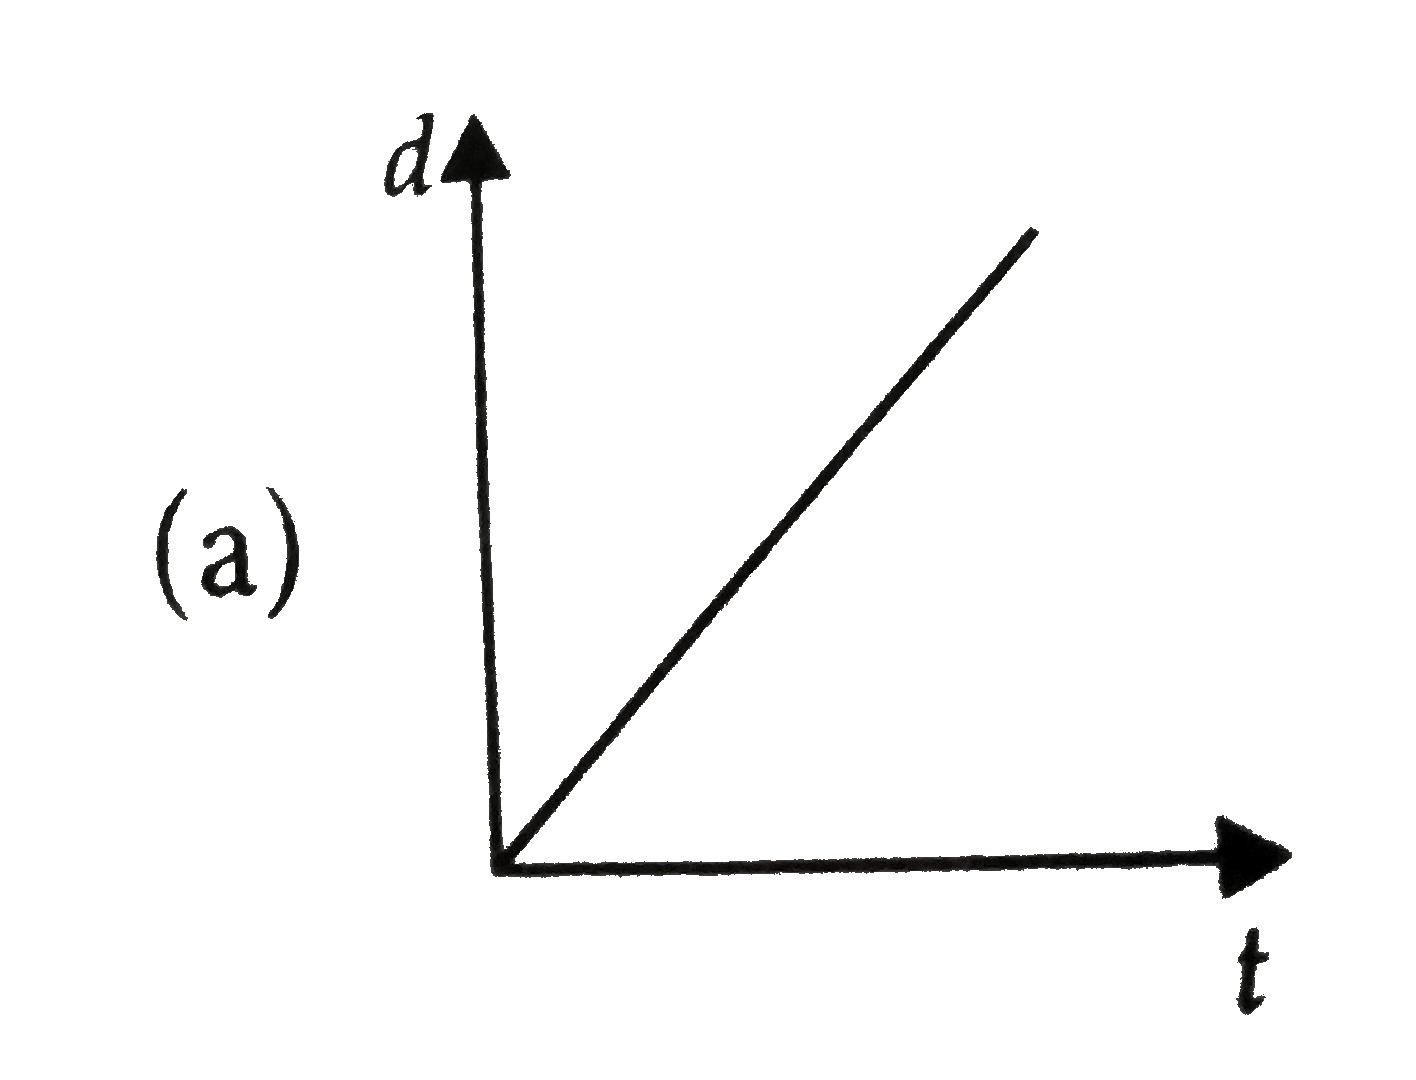 B
B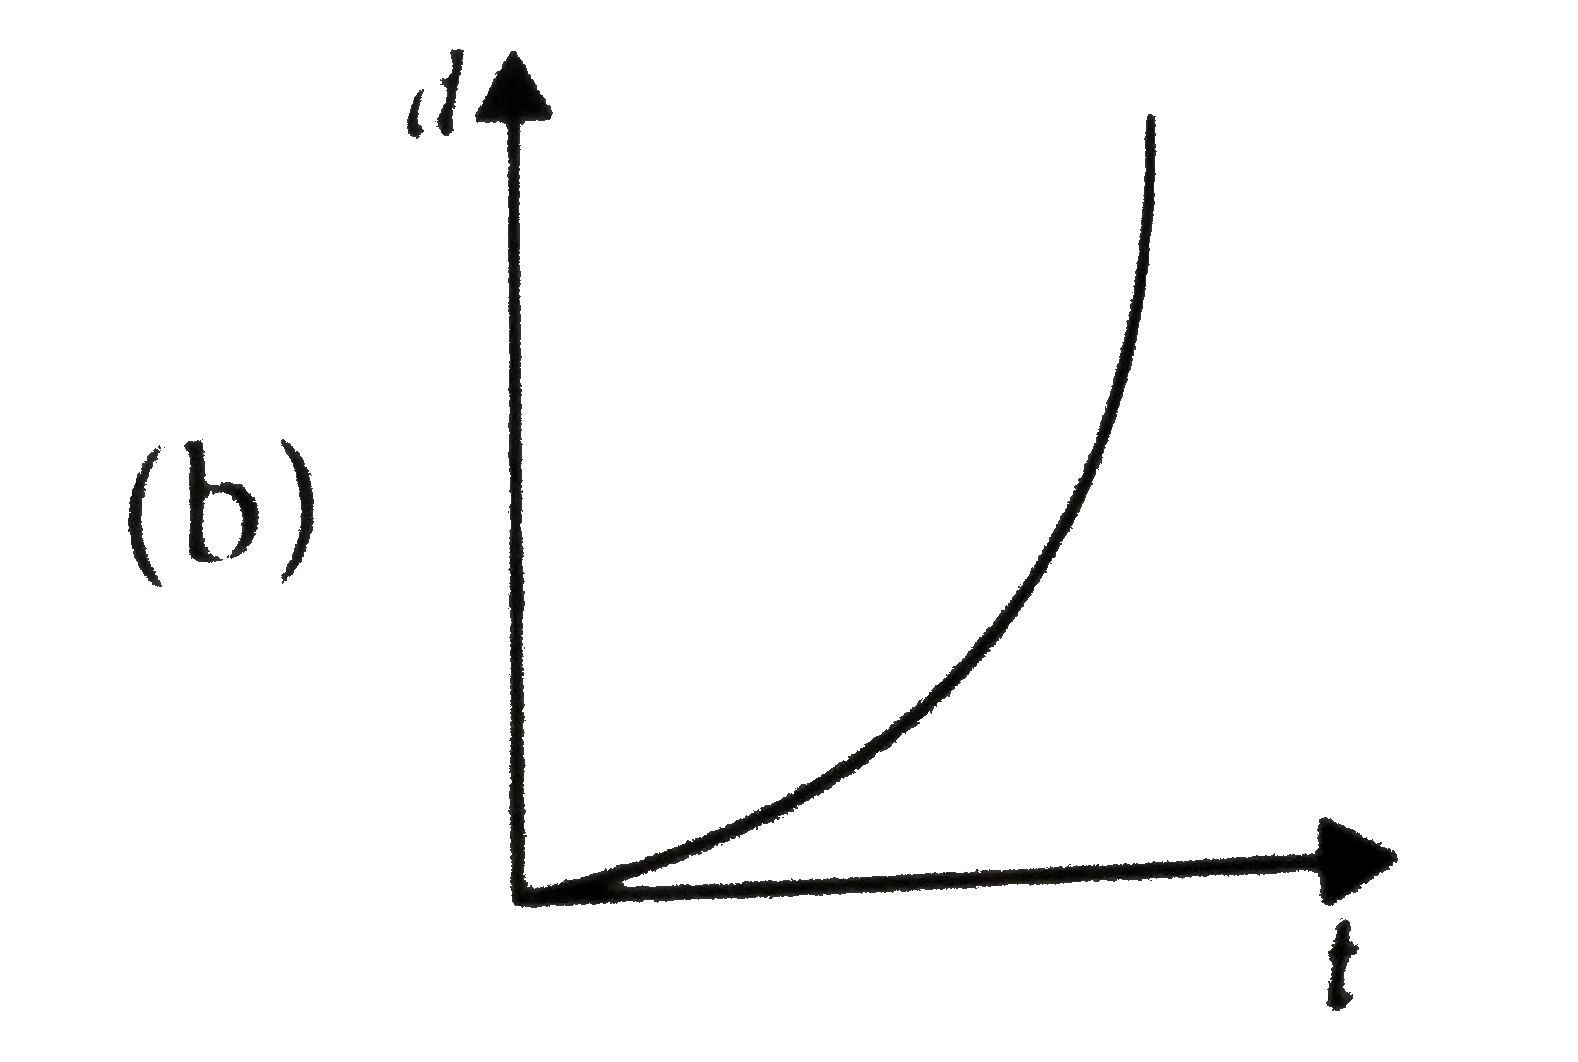 C
C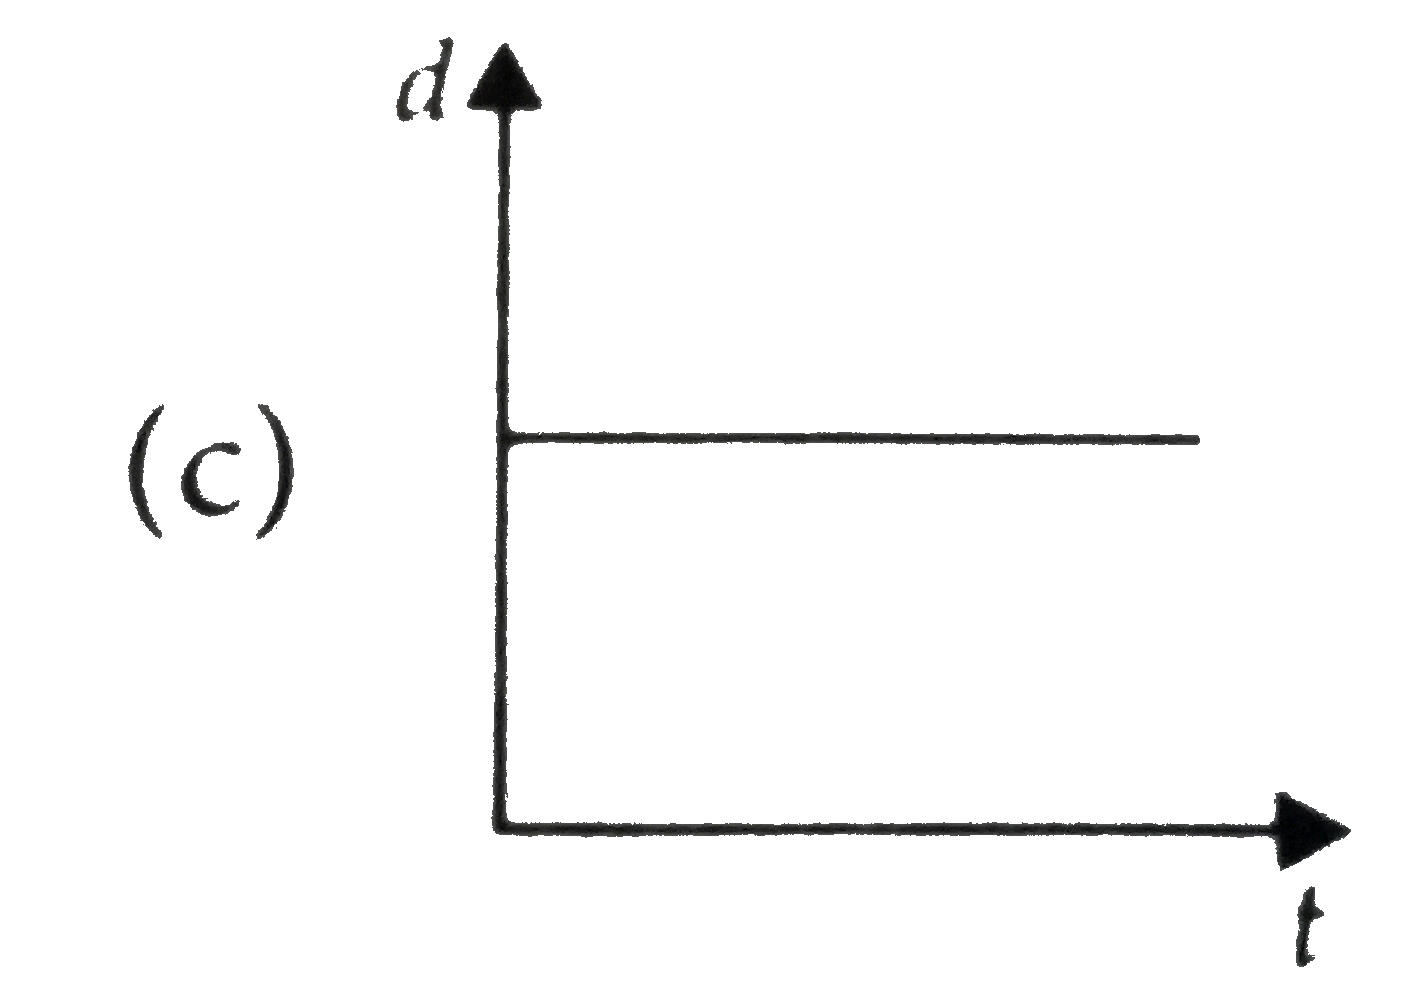 D
D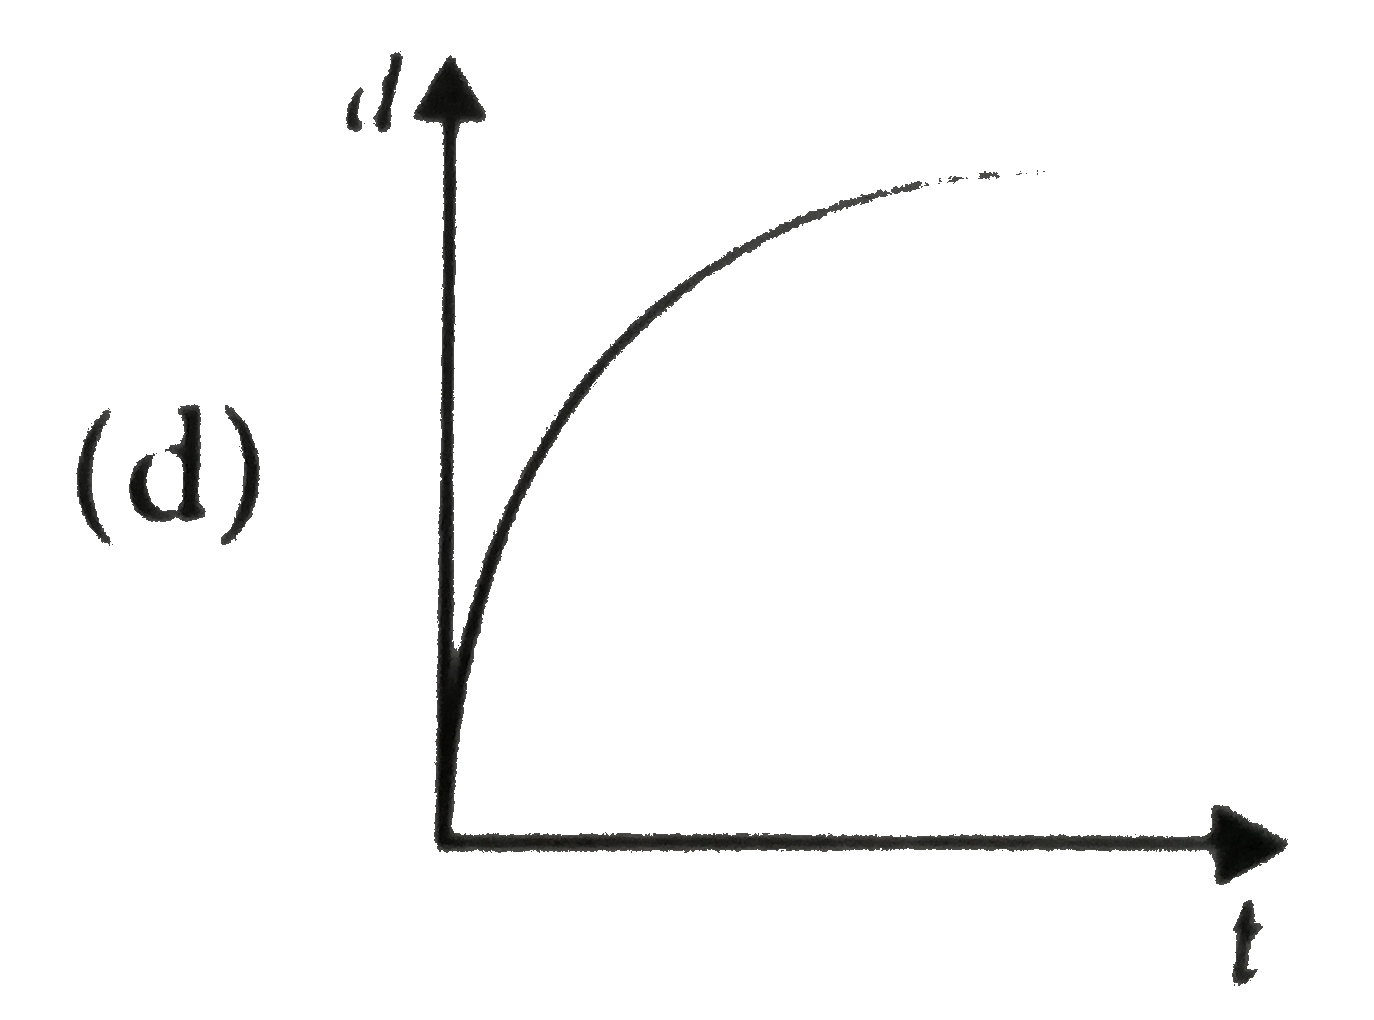
Which of the diagrams shown in figure. Most closely shows the variation inkinetic energy of the earth as it moves once around the sun in its elliptical orbit ?
A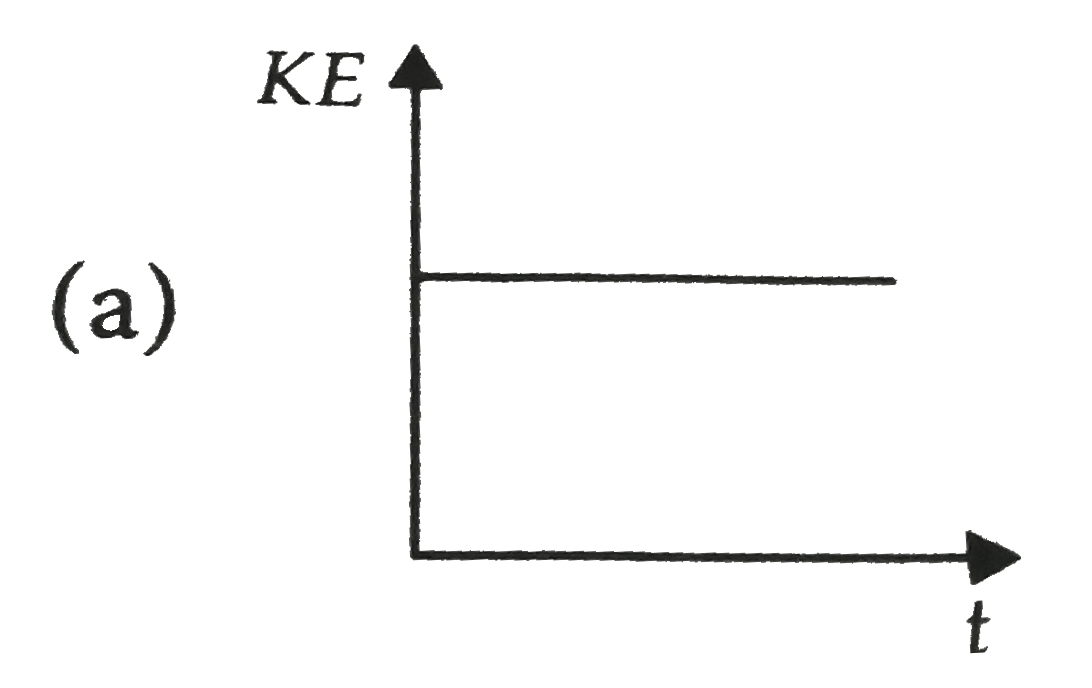 B
B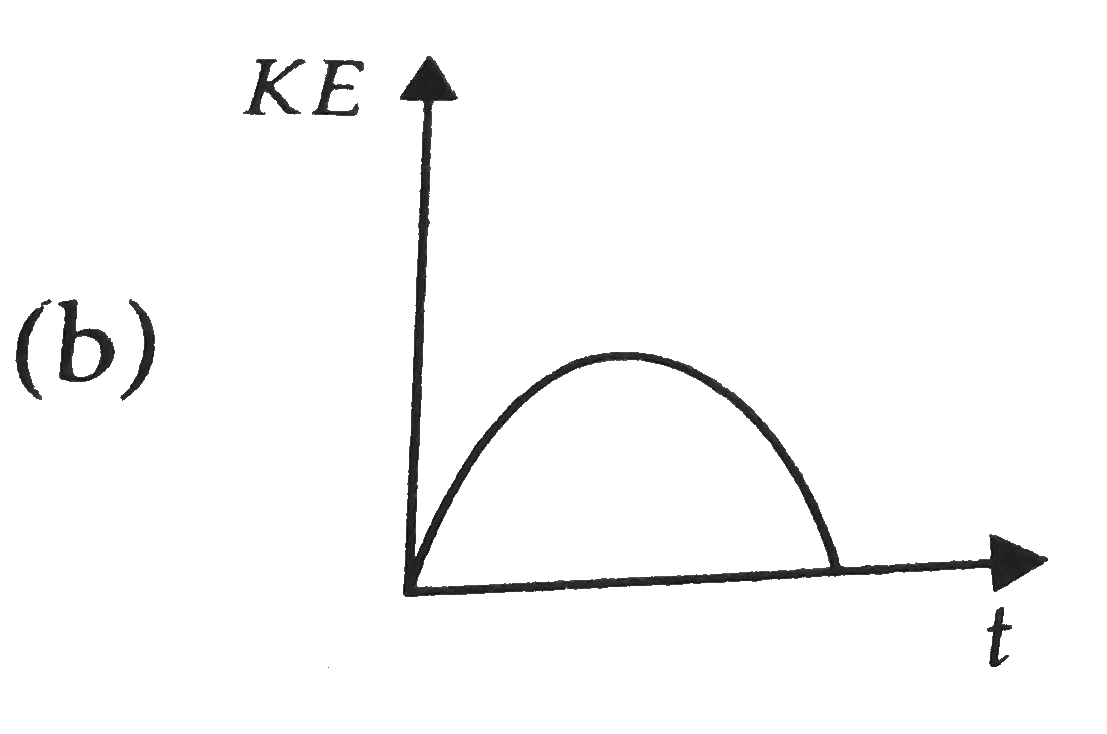 C
C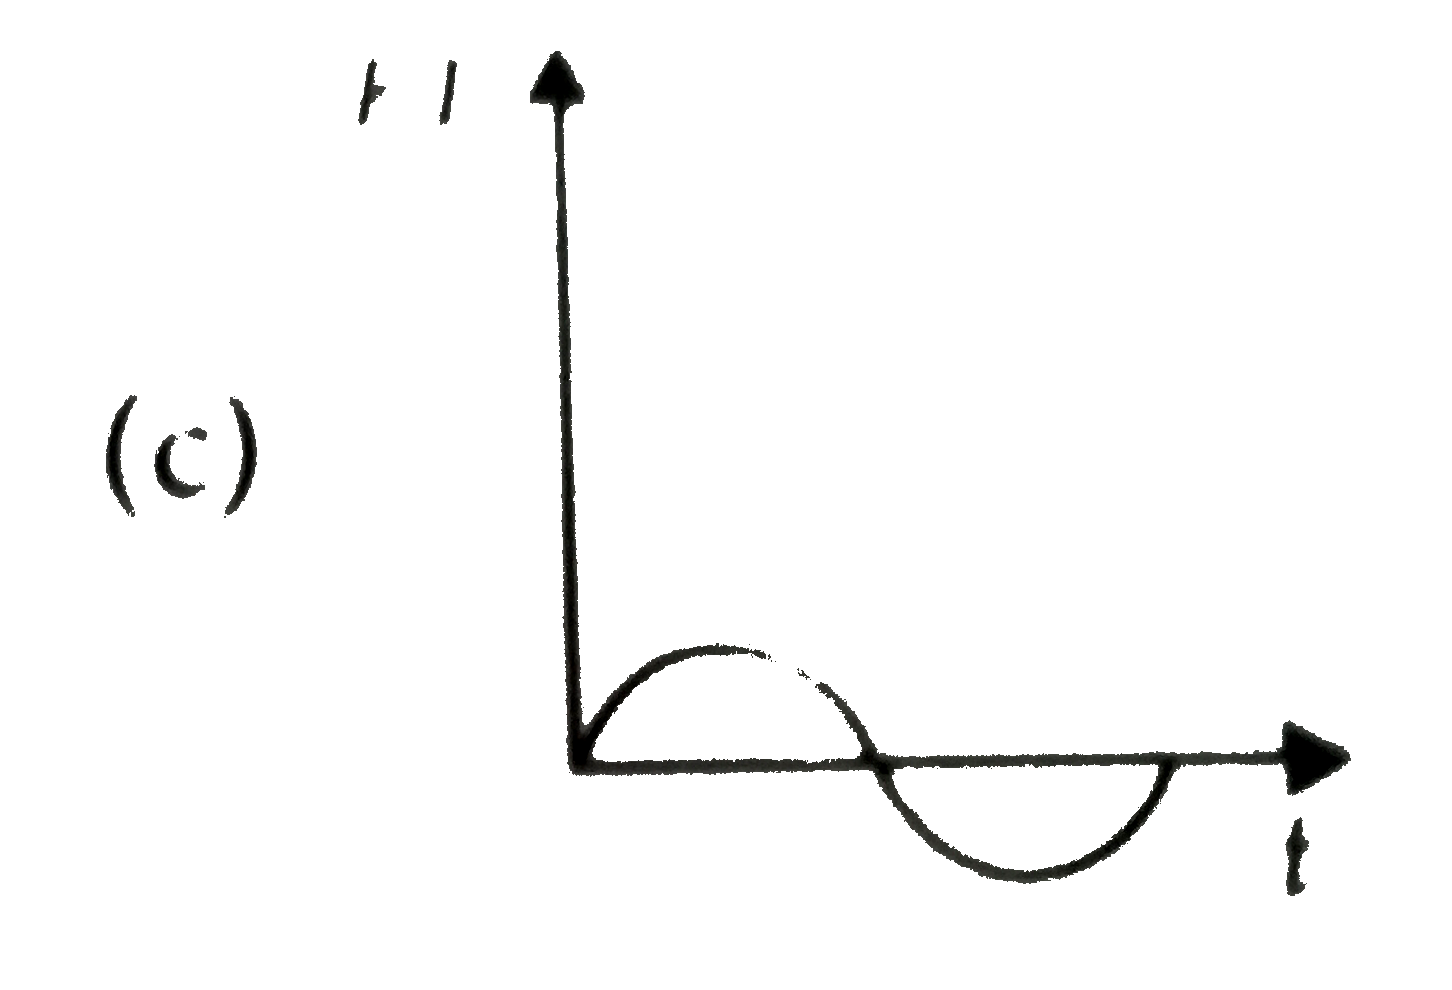 D
D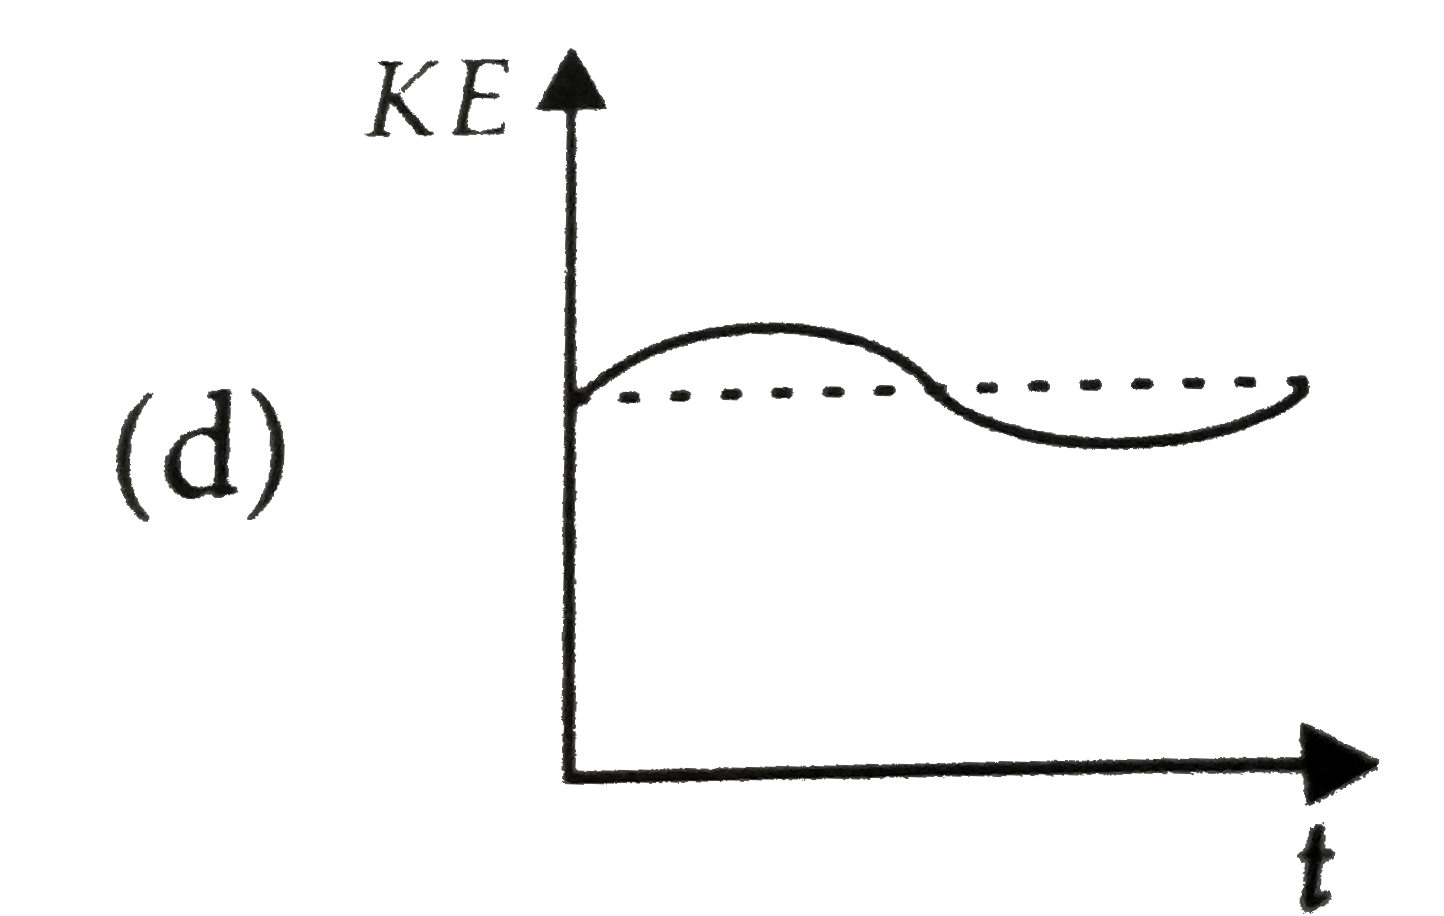
The energy band gap is maximum in
View SolutionWhich of the following energy band diagrams shows the N-type semiconductor?
View SolutionIn the circuit diagram shown in Figure,
 .
.
View SolutionWhich type of aestivation is shown in the diagram ?
View SolutionA body is moving unidirectionally under the influence of a source of constant power supplying energy. Which of the diagrams shown in figure. Correctly shows the displacement-time curve for its motion ?
View Solution
