A body is moving unidirectionally under the influence of a source of constant power supplying energy. Which of the diagrams shown in figure. Correctly shows the displacement-time curve for its motion ?
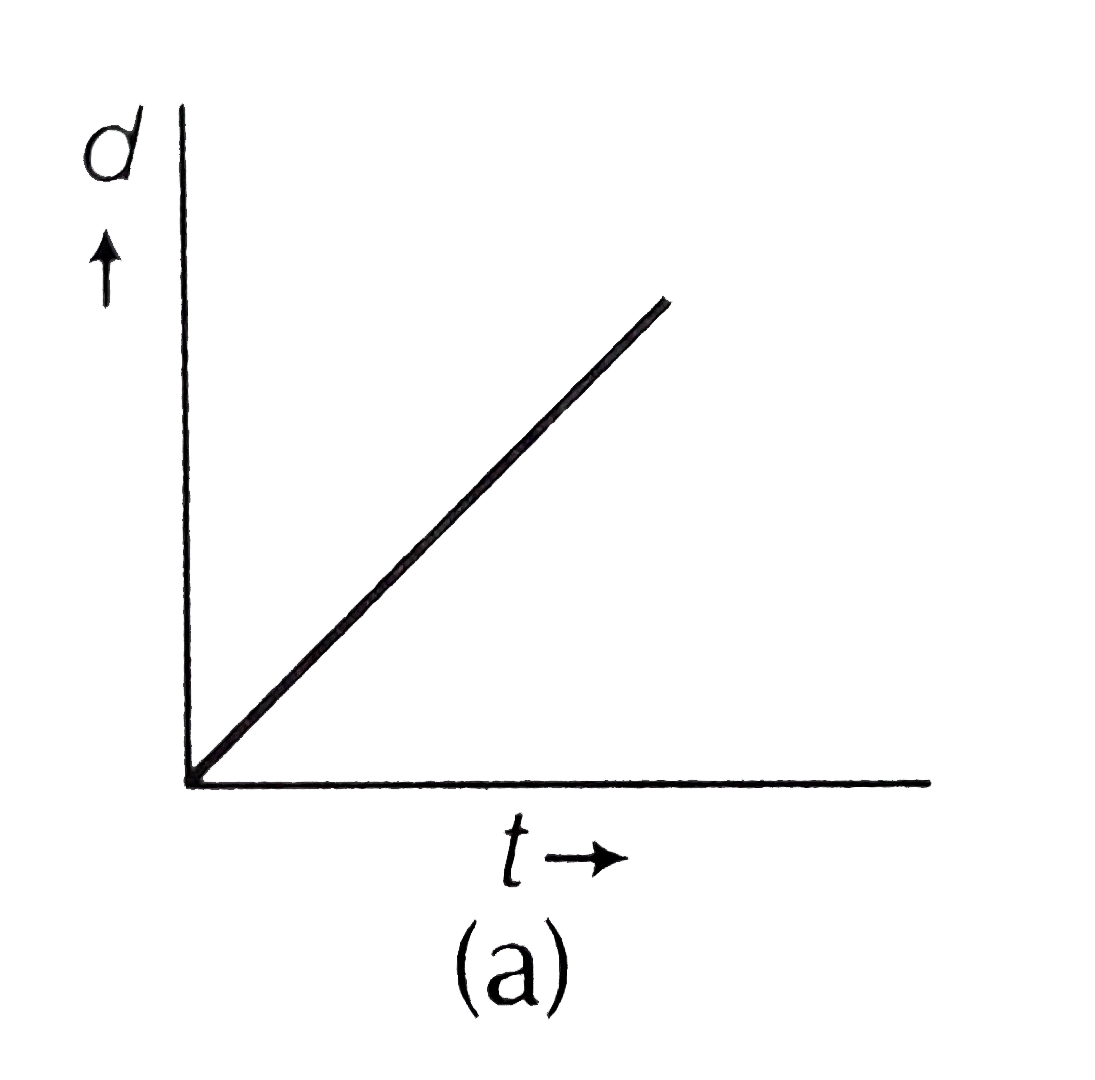
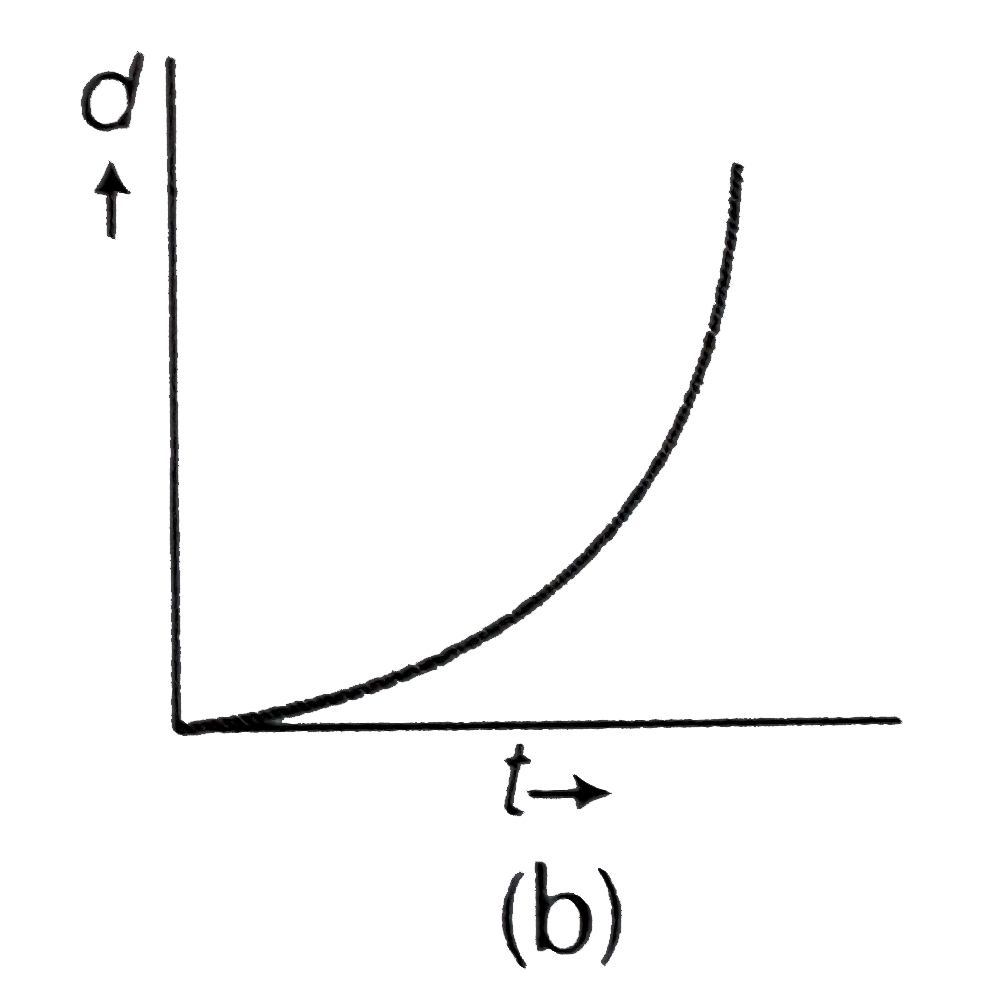
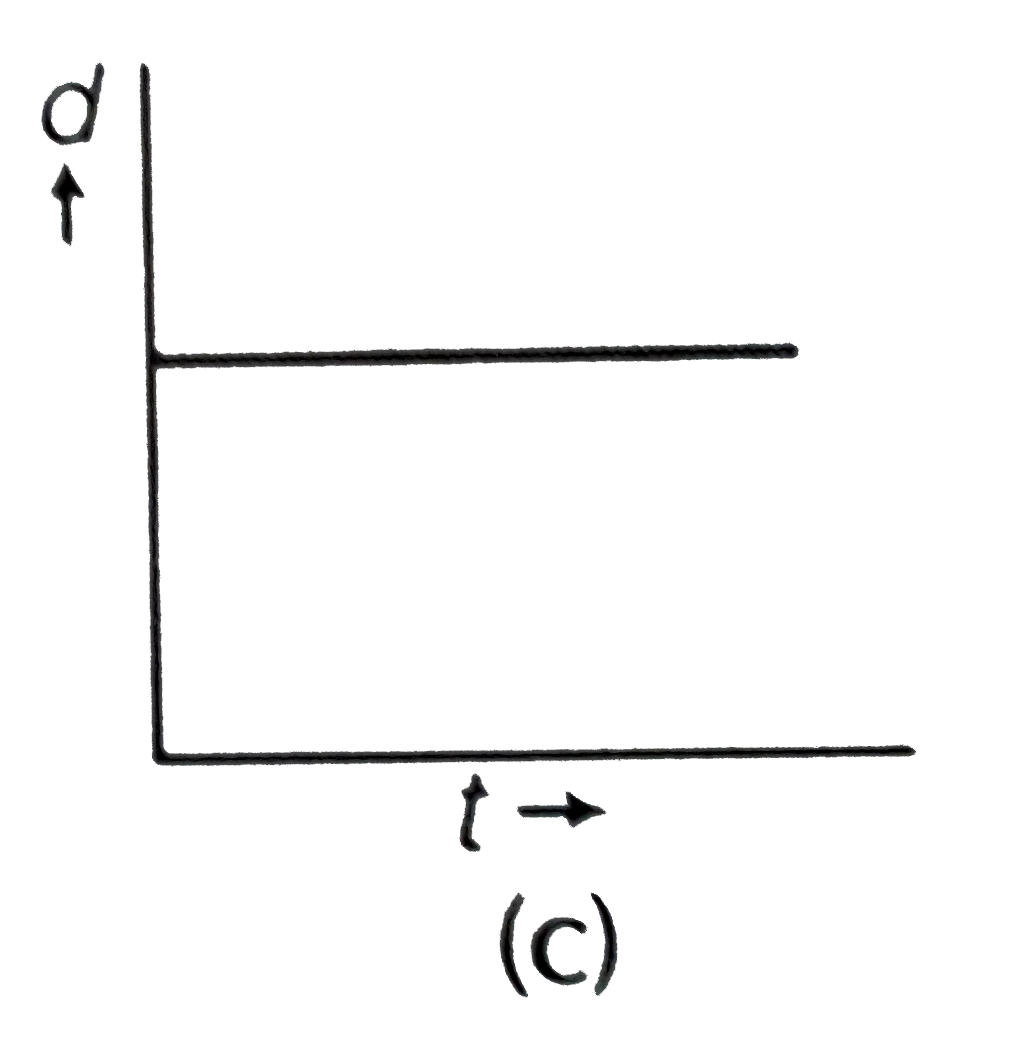
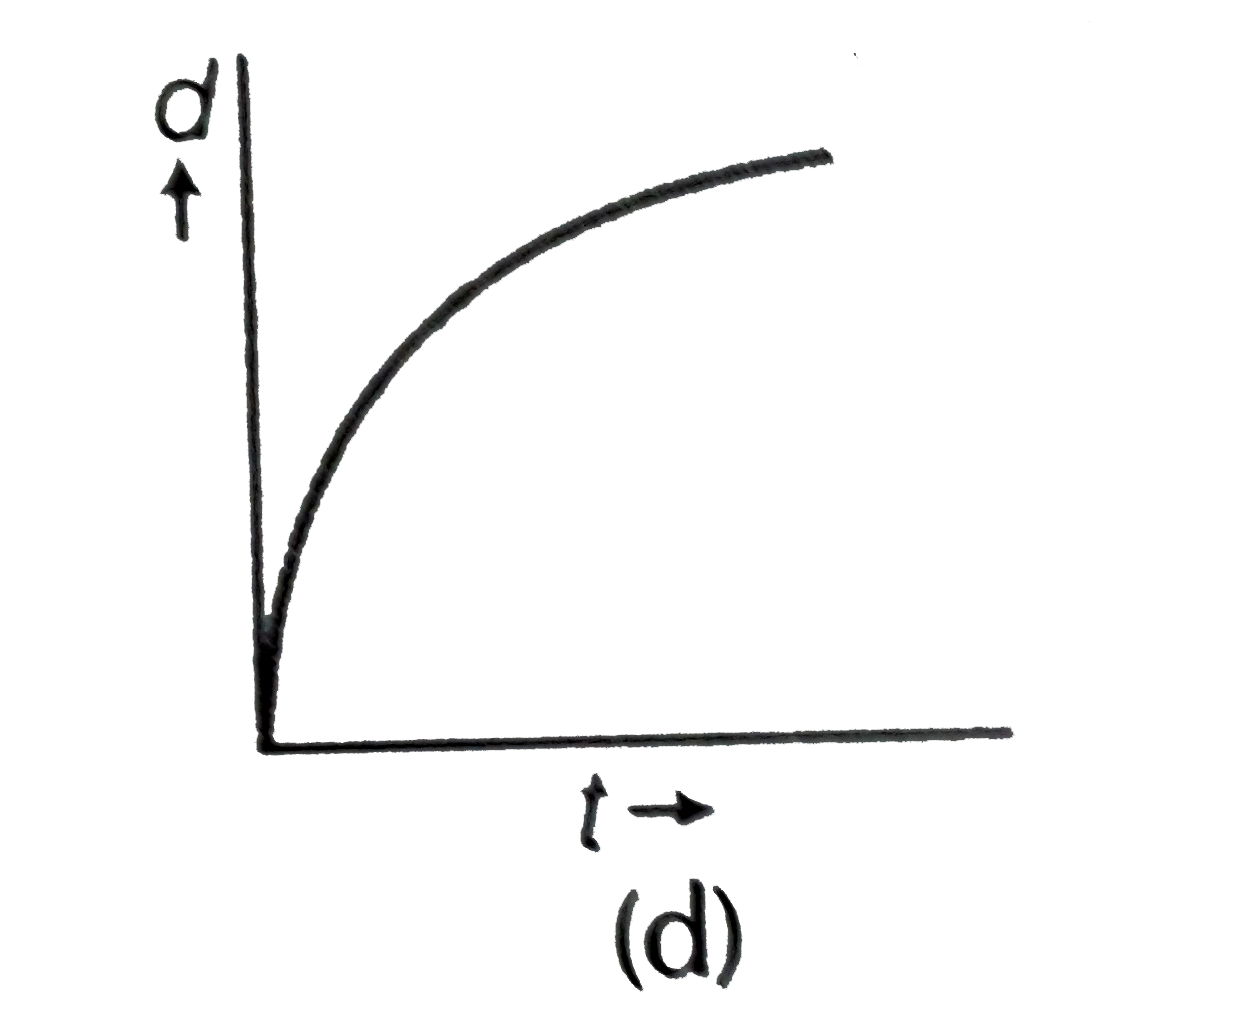
To solve the problem of determining the correct displacement-time curve for a body moving under the influence of a constant power, we can follow these steps:
Step 1: Understand the relationship between power, work, and displacement
Power (P) is defined as the rate at which work is done. Mathematically, it can be expressed as:
P=Wt
where W is the work done and t is the time taken.
Step 2: Relate power to force and displacement
Since work done can also be expressed as the product of force (F) and displacement (s), we can write:
P=F⋅st
In the case of unidirectional motion, we can simplify this to:
P=F⋅v
where v is the velocity of the body.
Step 3: Express velocity in terms of power
Rearranging the equation gives us:
v=PF
Since power is constant, we can see that if the force is constant, the velocity will also be constant. However, if the force is not constant, we need to analyze further.
Step 4: Consider the implications of constant power
If power is constant and the body is accelerating, the relationship between displacement and time can be derived from the equations of motion. The power can also be expressed in terms of velocity:
P=F⋅v
This implies that as the body accelerates, the velocity increases, which means that the displacement will not be linear.
Step 5: Derive the displacement-time relationship
Since we have established that the body is accelerating under constant power, we can derive the relationship between displacement (s) and time (t). The relationship can be shown to be:
s∝t3/2
This indicates that the displacement-time graph will be a curve that opens upwards, resembling a parabola.
Step 6: Identify the correct diagram
From the analysis, we conclude that the displacement-time graph will be a curve that opens upwards, indicating that the body is accelerating. Therefore, we look for a diagram that represents this relationship.
Conclusion
The correct displacement-time curve for the motion of the body under constant power is a curve that opens upwards, typically represented as a parabola.
---
Power (P) is defined as the rate at which work is done. Mathematically, it can be expressed as:
P=Wt
where W is the work done and t is the time taken.
Since work done can also be expressed as the product of force (F) and displacement (s), we can write:
P=F⋅st
In the case of unidirectional motion, we can simplify this to:
P=F⋅v
where v is the velocity of the body.
Rearranging the equation gives us:
v=PF
Since power is constant, we can see that if the force is constant, the velocity will also be constant. However, if the force is not constant, we need to analyze further.
If power is constant and the body is accelerating, the relationship between displacement and time can be derived from the equations of motion. The power can also be expressed in terms of velocity:
P=F⋅v
This implies that as the body accelerates, the velocity increases, which means that the displacement will not be linear.
Since we have established that the body is accelerating under constant power, we can derive the relationship between displacement (s) and time (t). The relationship can be shown to be:
s∝t3/2
This indicates that the displacement-time graph will be a curve that opens upwards, resembling a parabola.
From the analysis, we conclude that the displacement-time graph will be a curve that opens upwards, indicating that the body is accelerating. Therefore, we look for a diagram that represents this relationship.
The correct displacement-time curve for the motion of the body under constant power is a curve that opens upwards, typically represented as a parabola.
Similar Questions
A body is moving undirectionally under the influence of a source of constatn power. It displacement in time t is proportional to (i) t1/2 (ii) t (iii) t3/2 (iv) t2
View SolutionVoltage across a capacitor varies as shown in the diagram. Which diagram correctly represents the current time curve?
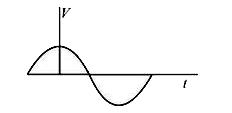
View Solution
Knowledge Check
A raindrop falling from a height h above ground, attains a near terminal velocity when it has fallen through a height (3/4)h. Which of the diagrams shown in figure correctly shows the change in kinetic and potential energy of the drop during its fall up to the ground ?
A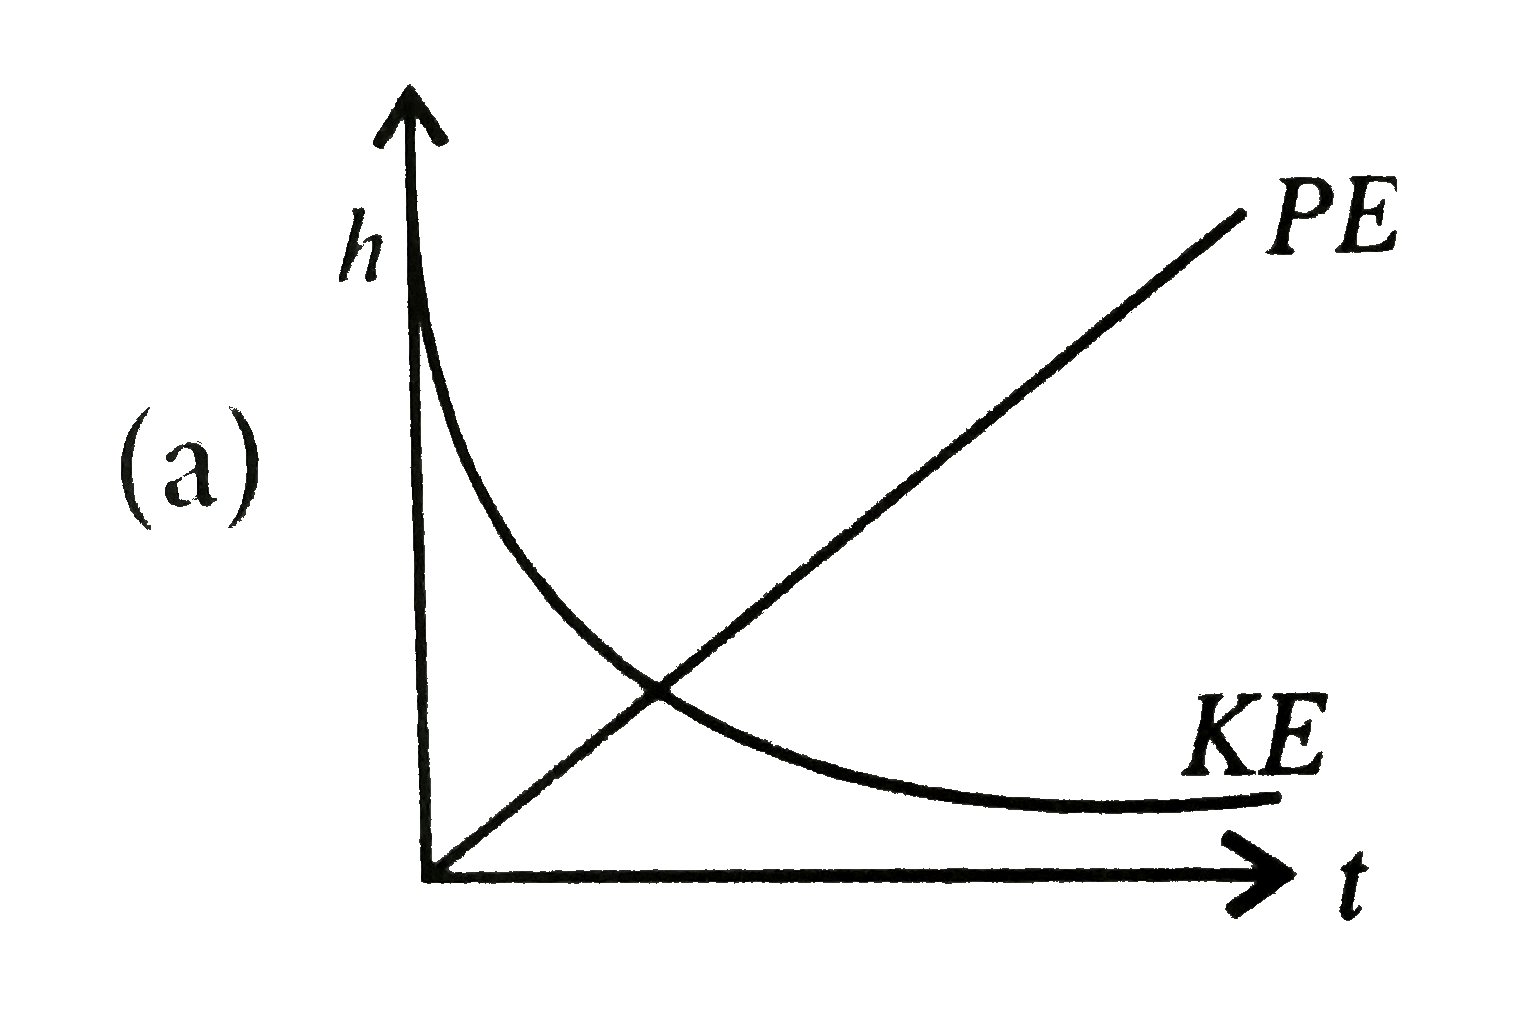 B
B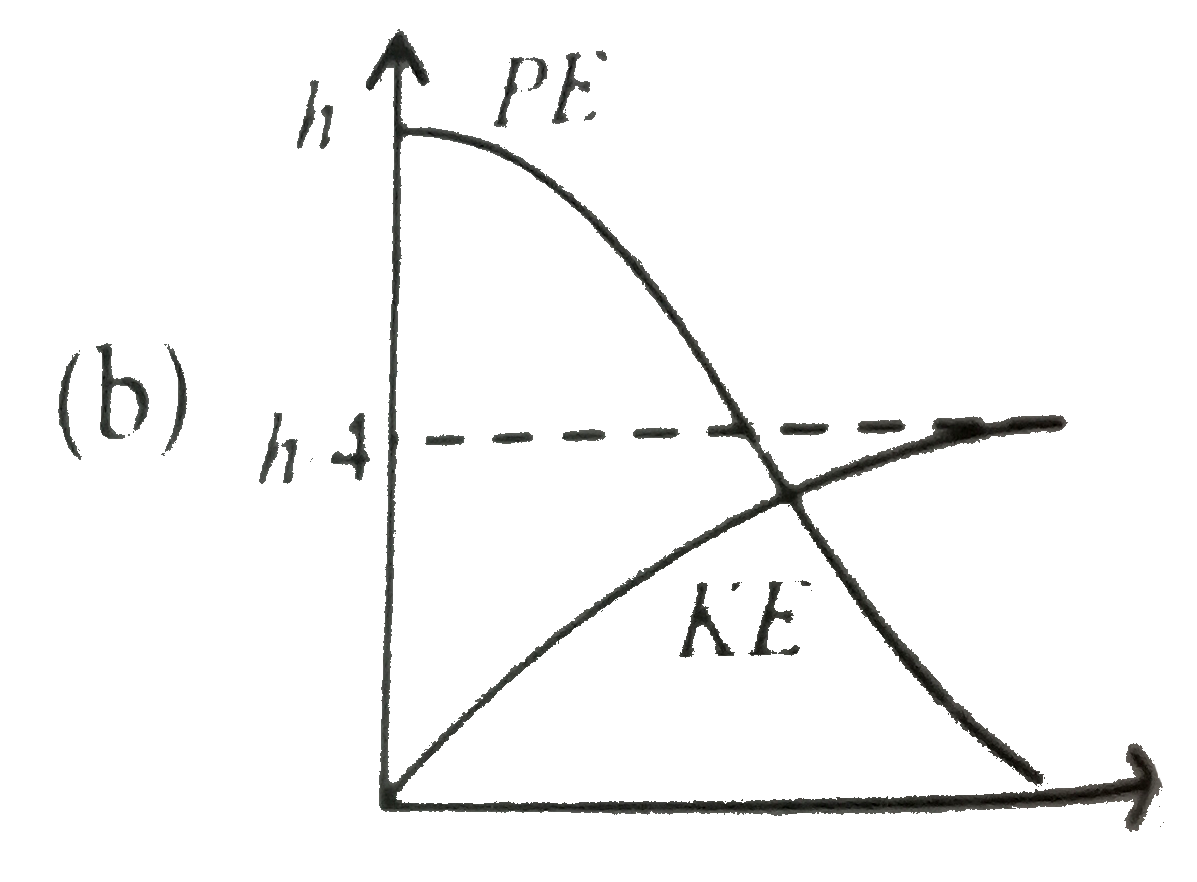 C
C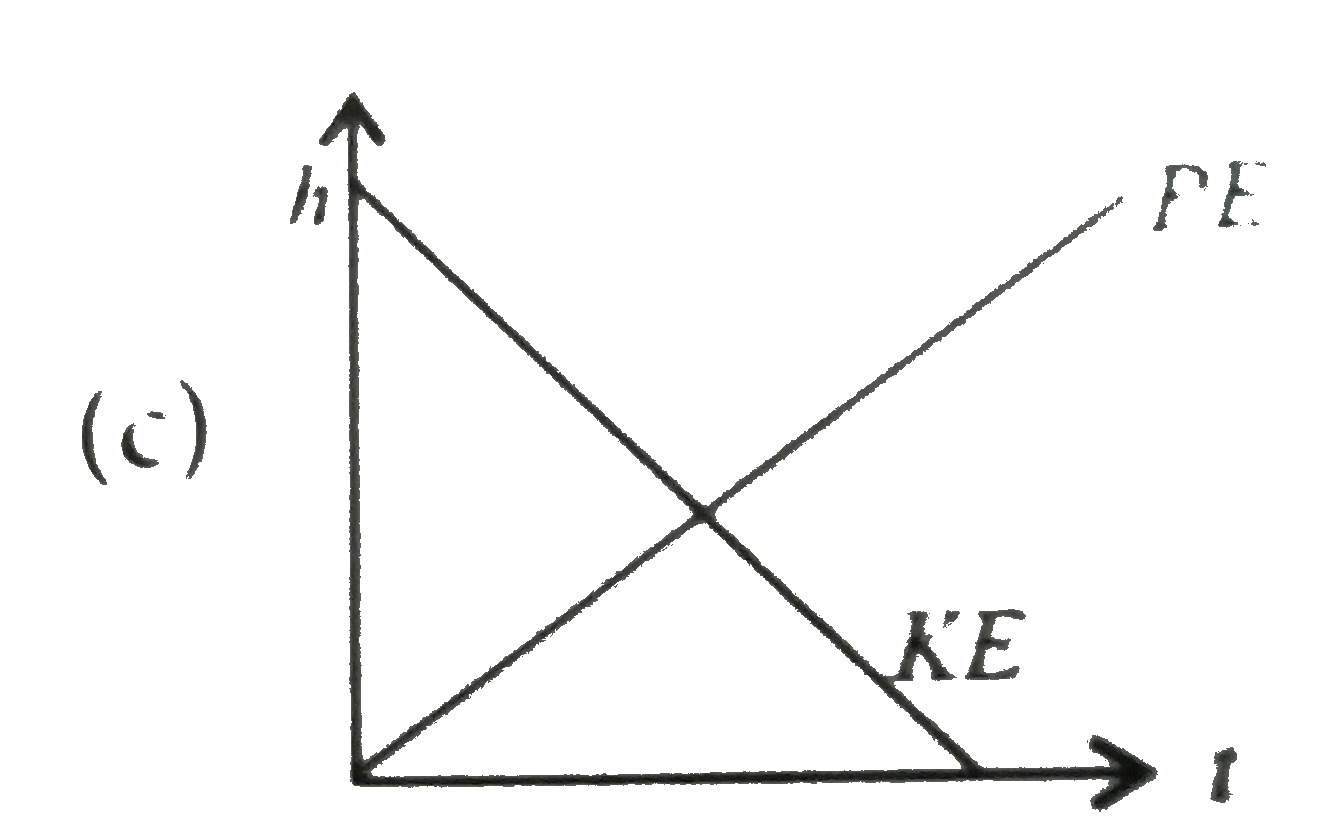 D
D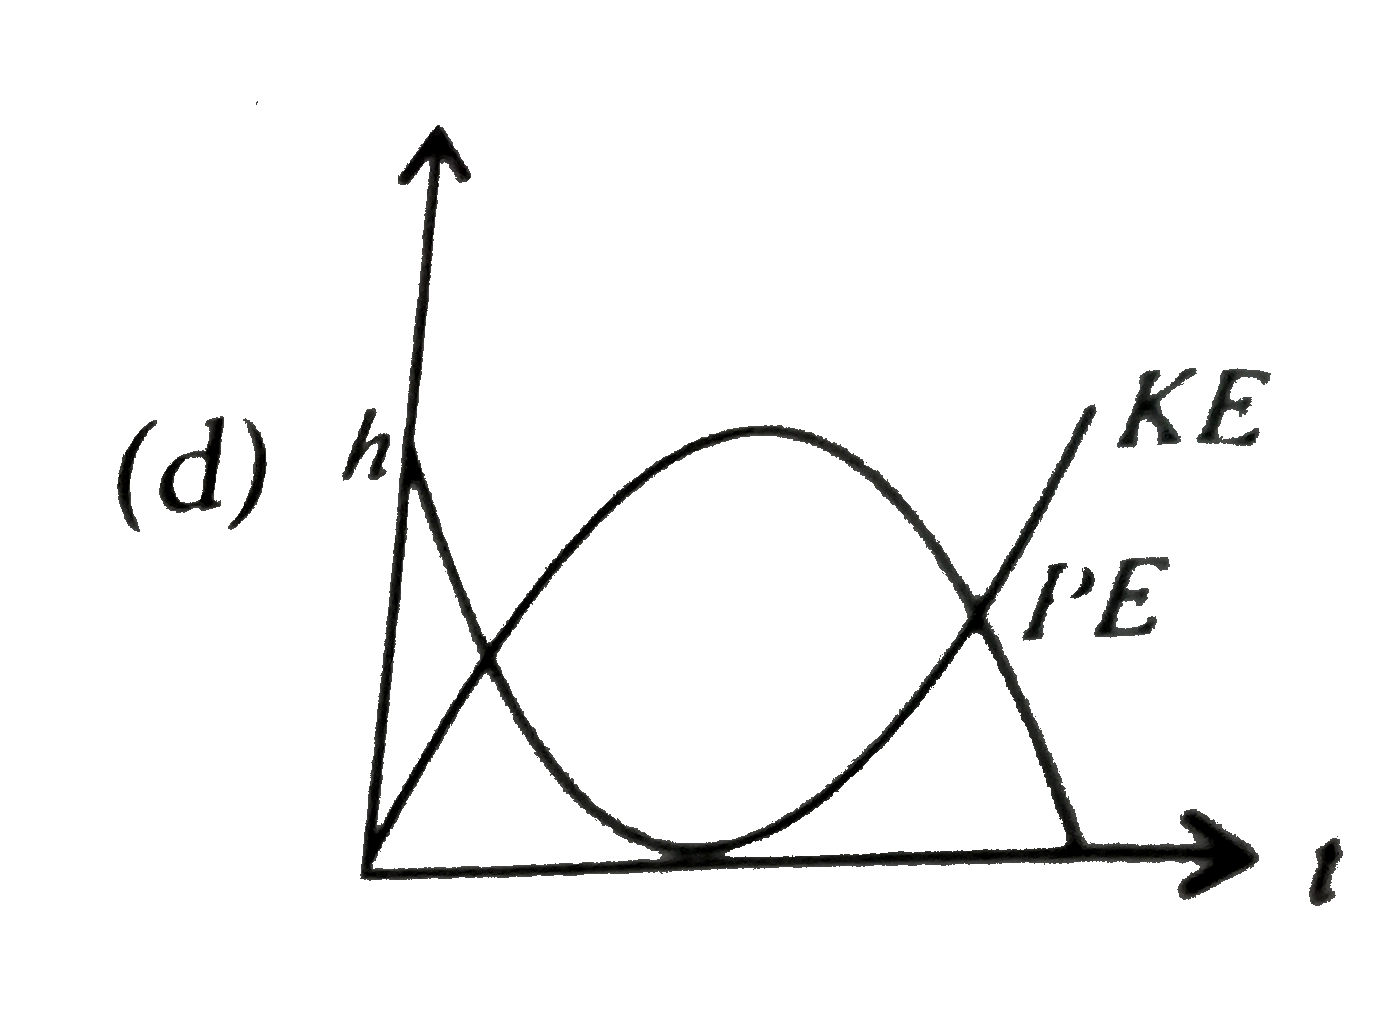
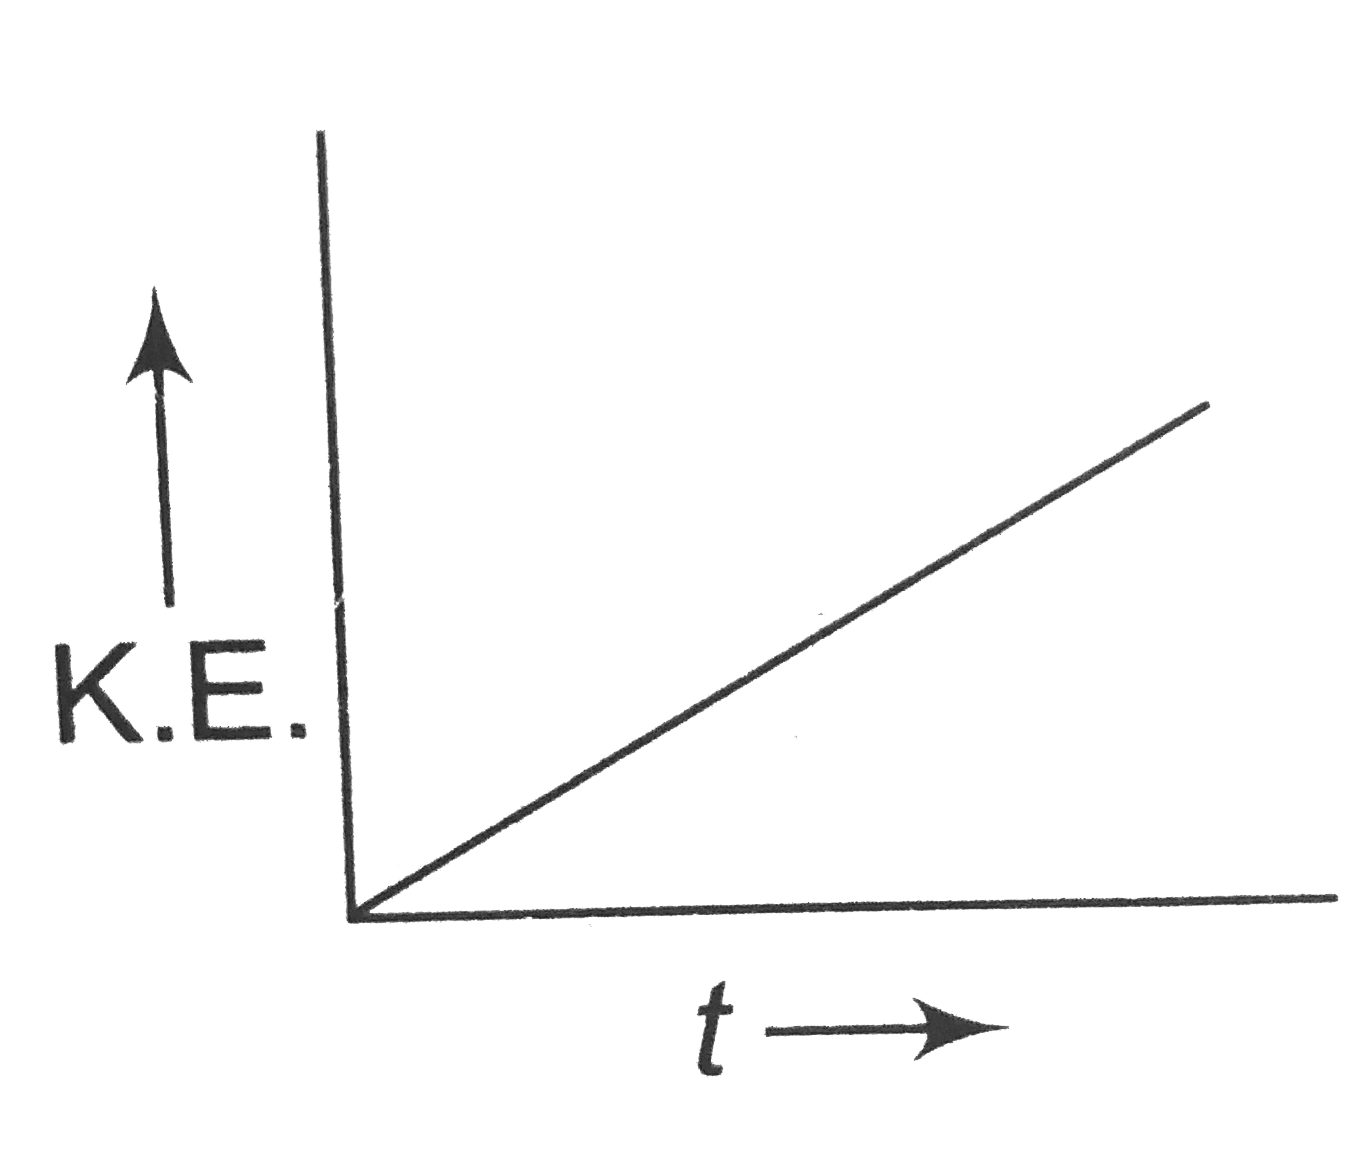
The kinetic energy of a body moving along a straight line varies with time as shown in figure. The force acting on the body:
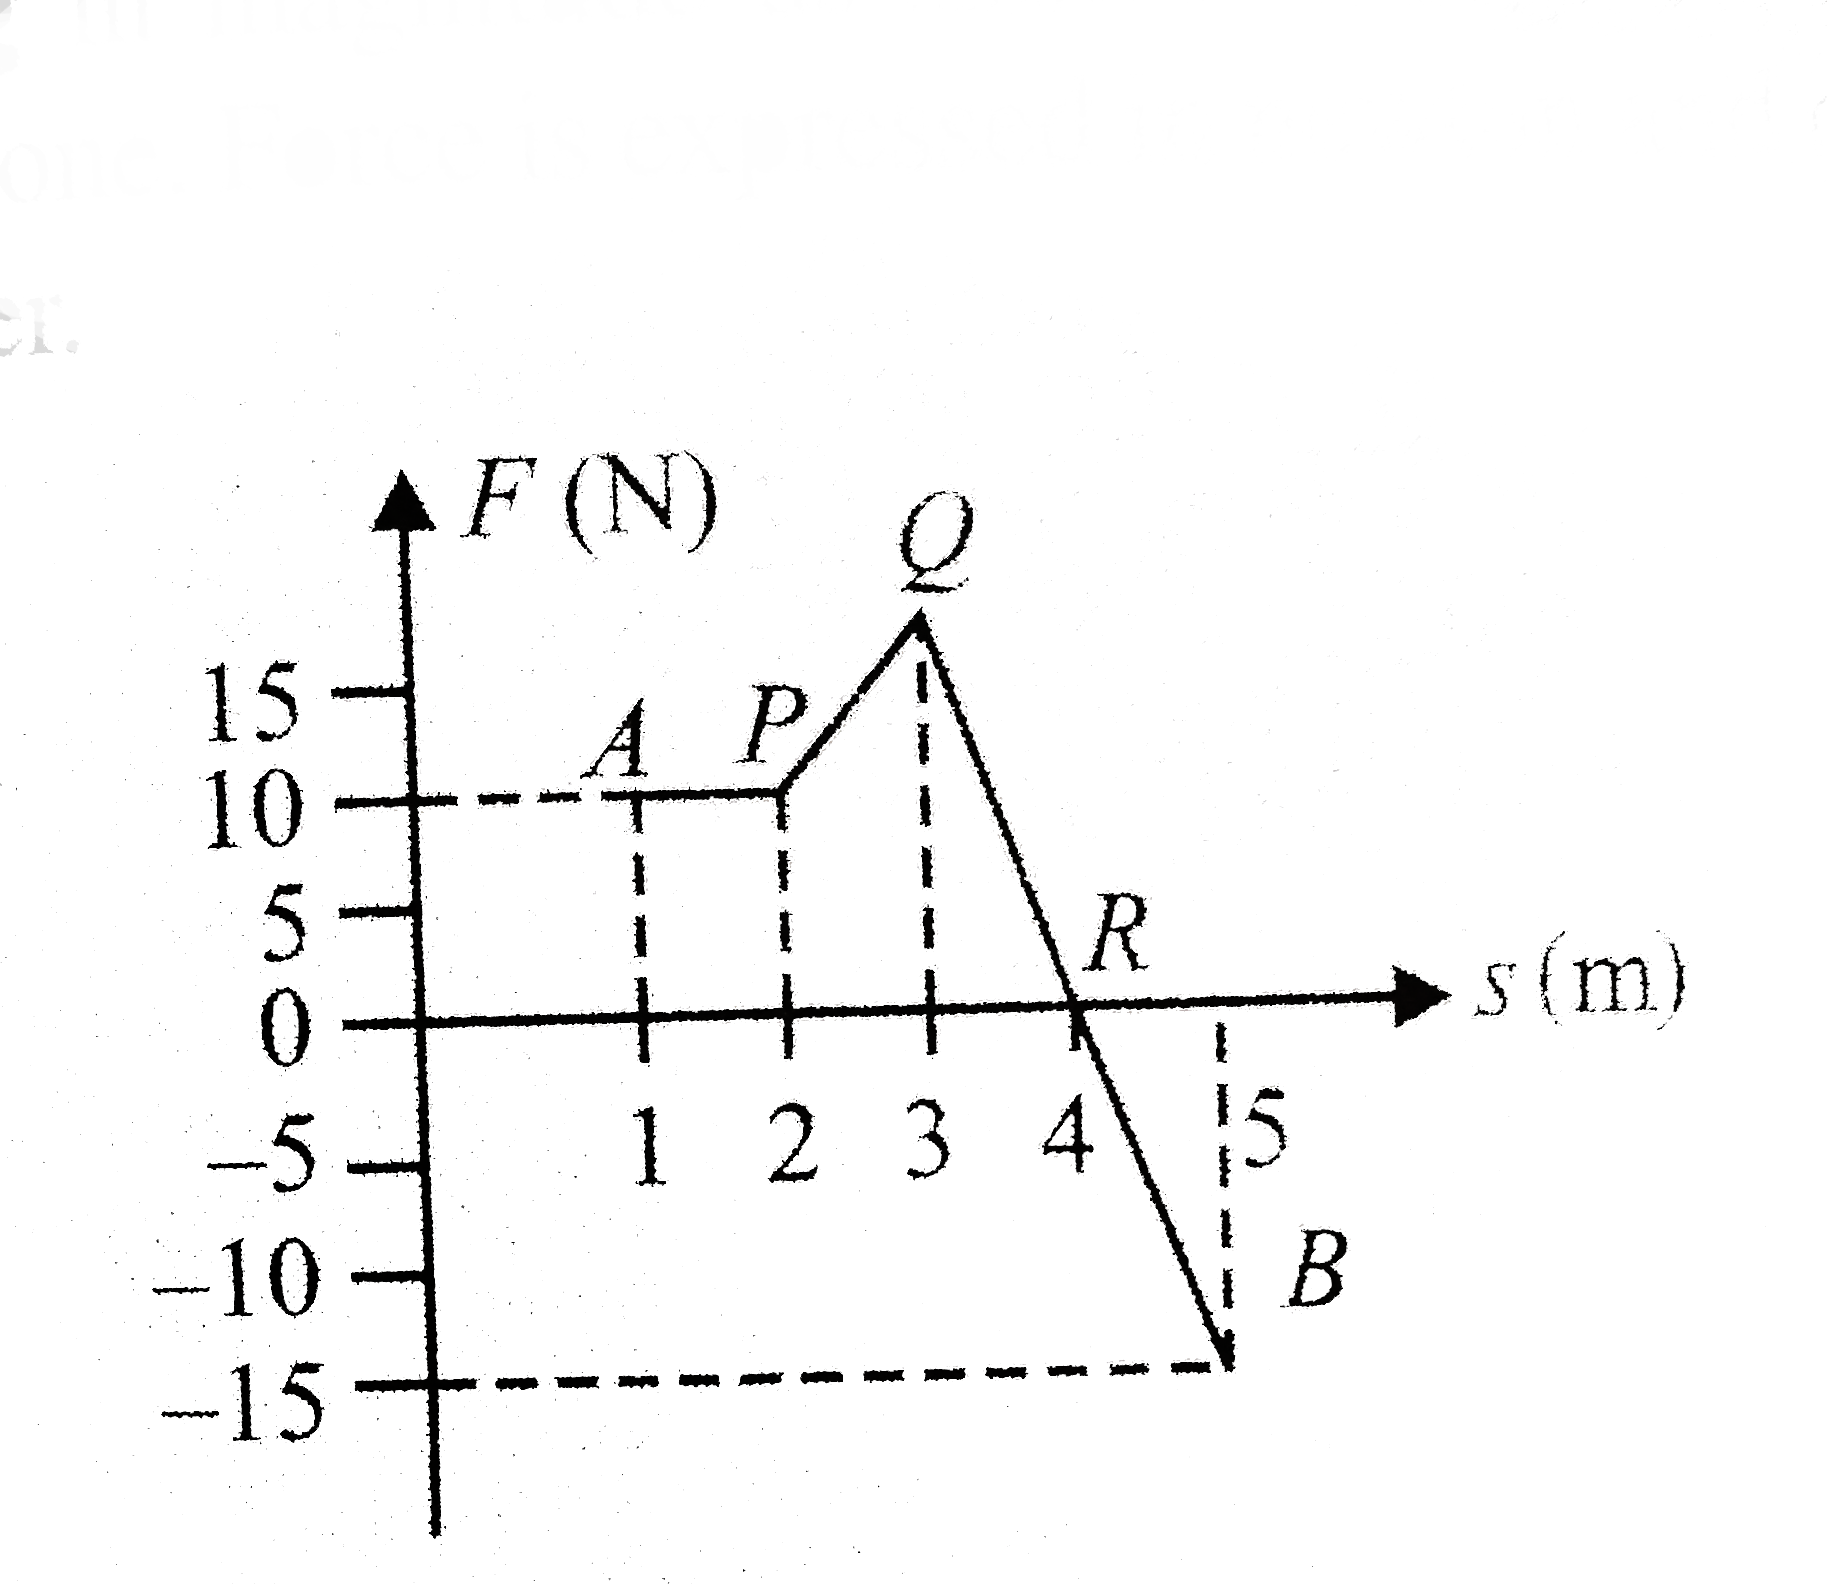
View SolutionA body moves from point A to B under the action of a force, varying in magnitude as shown in figure. Obtain the work done. Force is expressed in newton and displacement in meter.
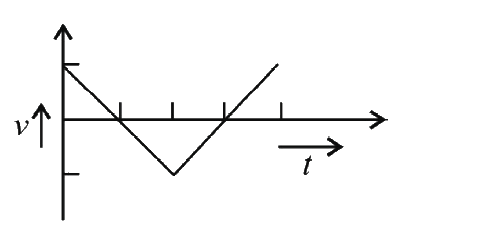
View SolutionThe graph in figure shows the velocity v versus time t for a body. Which of the graphs shown in figure represents the correesponding acceleration versus time graphs ?
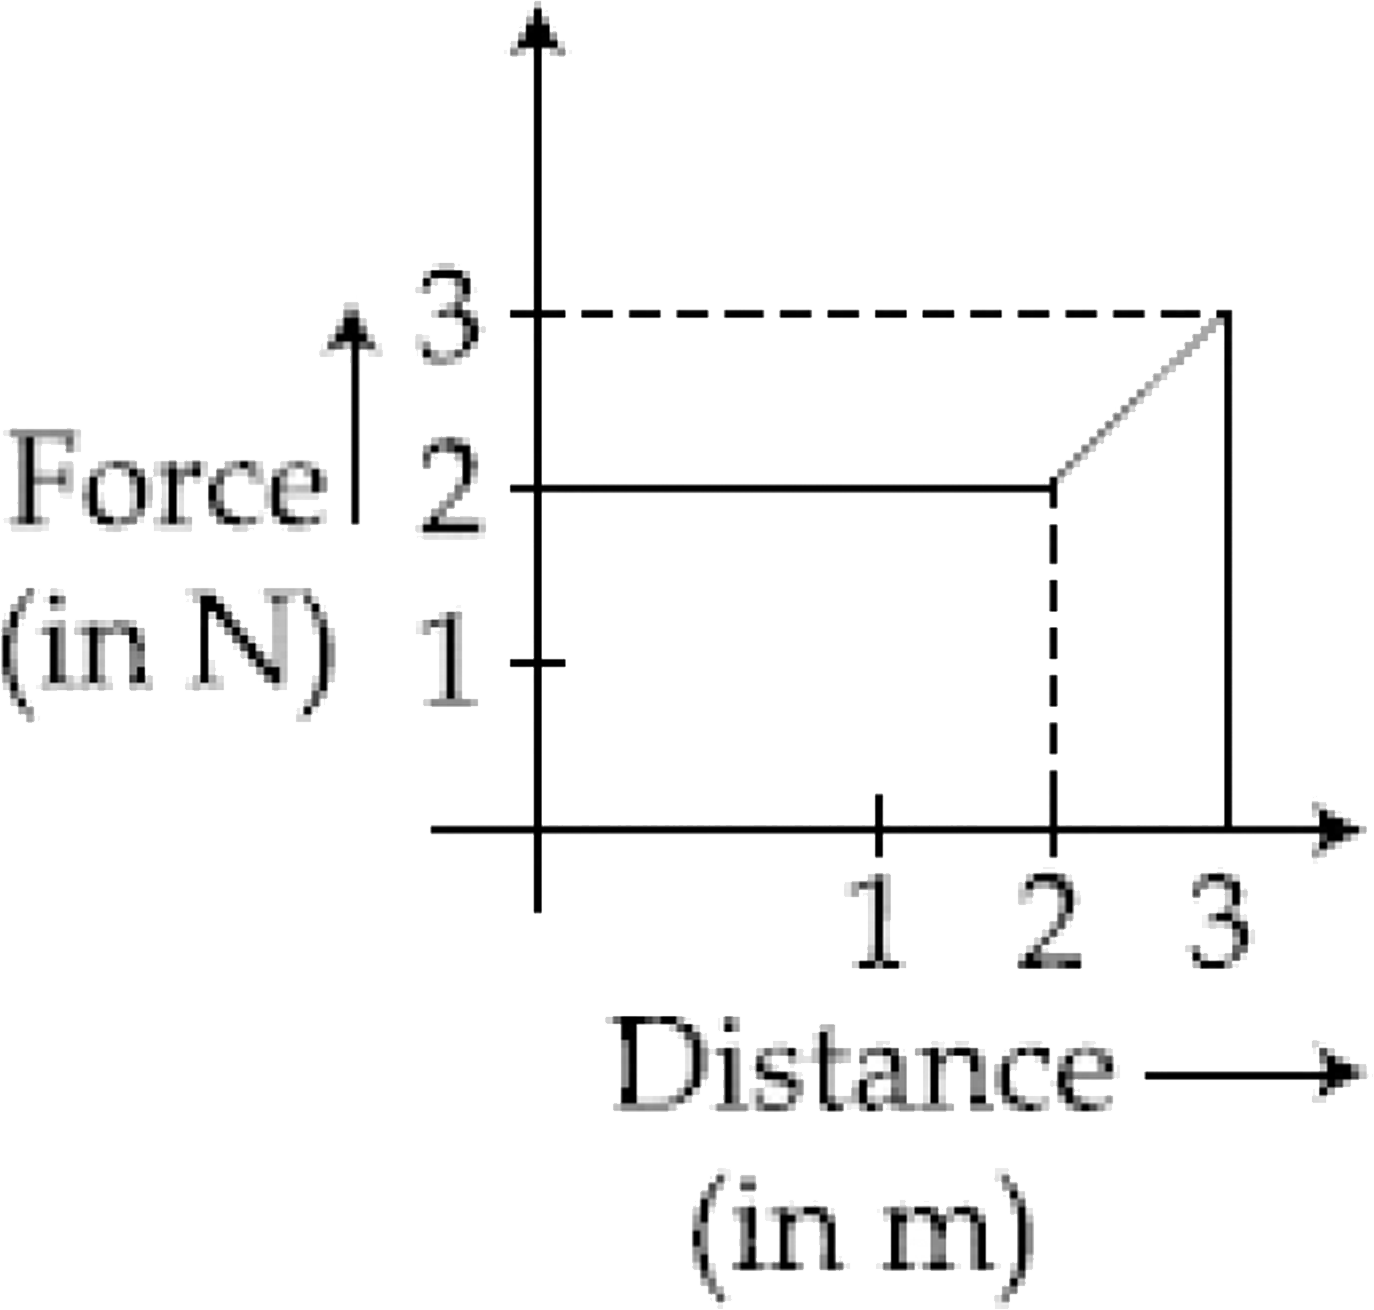
View SolutionA particle moves in one dimension from rest under the influence of a force that varies with the distance travelled by the particle as shown in the figure. The kinetic energy of the particle after it has travelled 3m is:
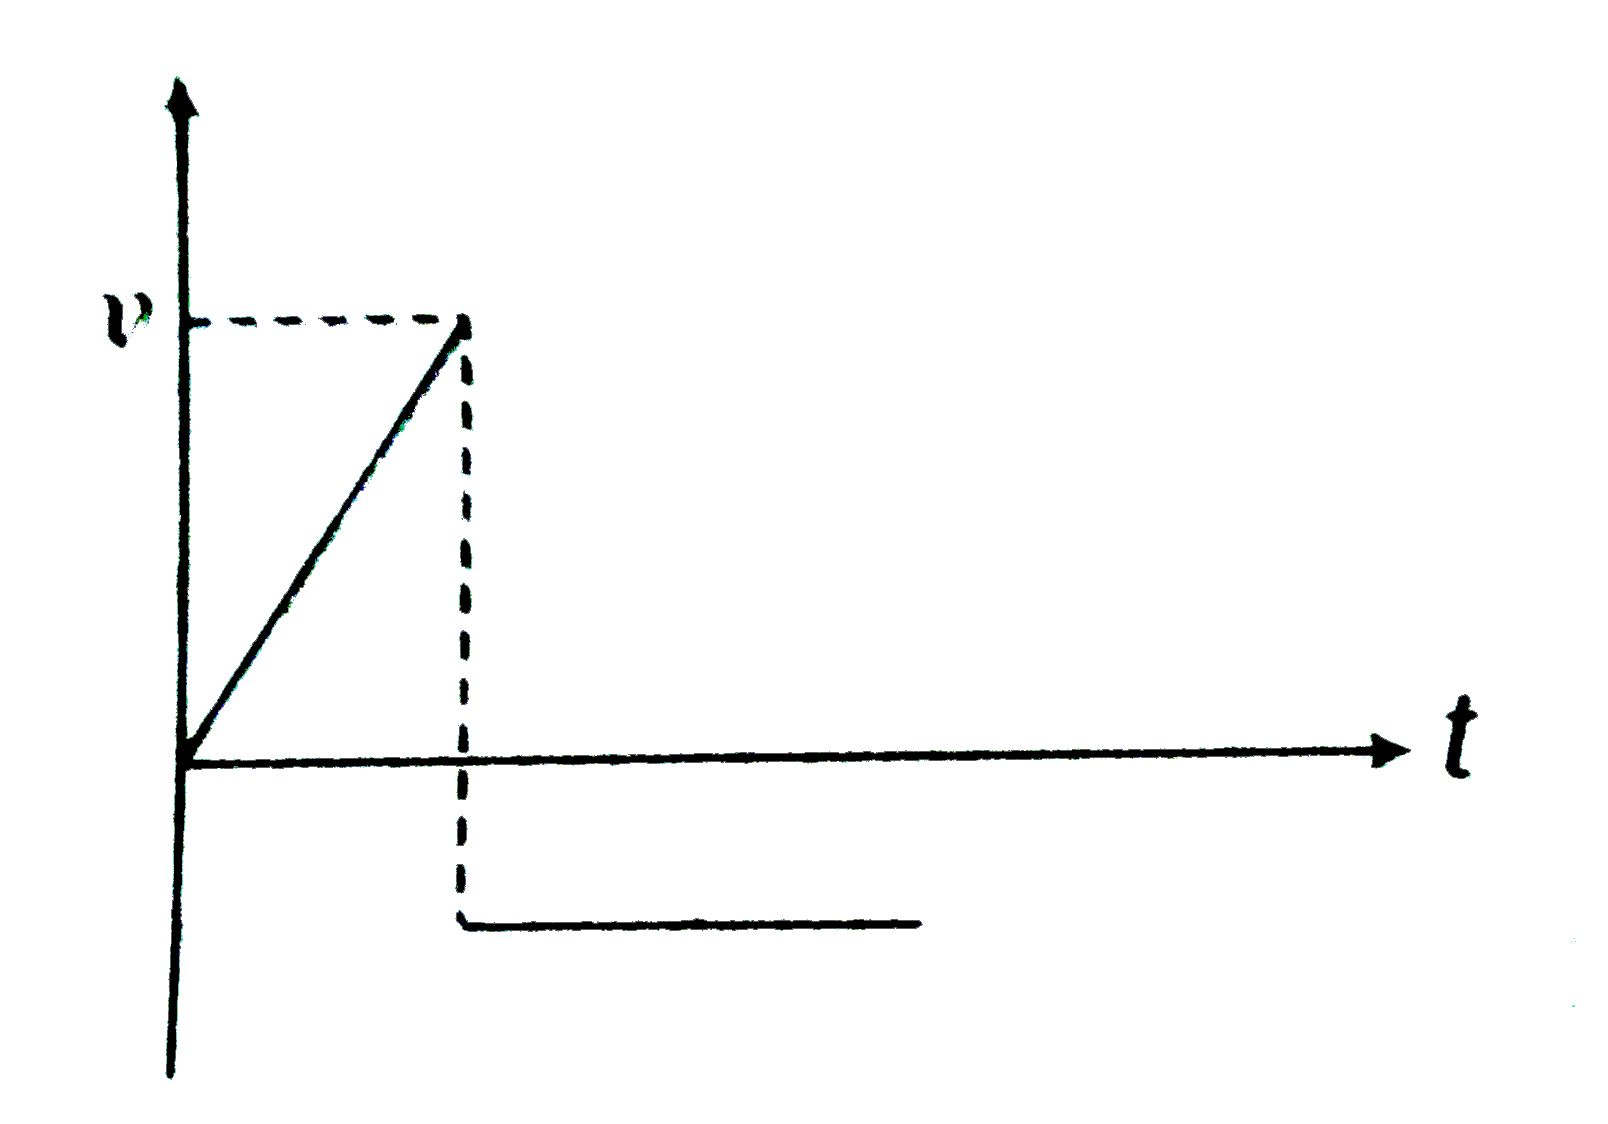
View SolutionThe velocity-time graph for a particle moving along X-axis is shown in the figure. The corresponding displacement-time graph is correctly shown by
View SolutionA particle of mass m starts moving from origin along a horizontal x-y plane under the influence of a force of constant magnitude F ( which is always parallel to the x-axis ) and a constraint force. The trajectory of its motion is f(x)=xx2+1. Then,
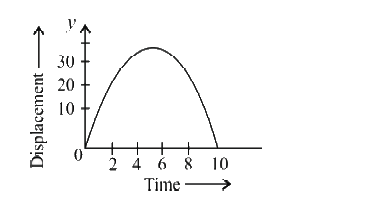
View SolutionThe displacement-time graph of a moving object is shown in figure. Which of the velocity-time graphs shown in figure could represent the motion of the same body ?
View Solution
