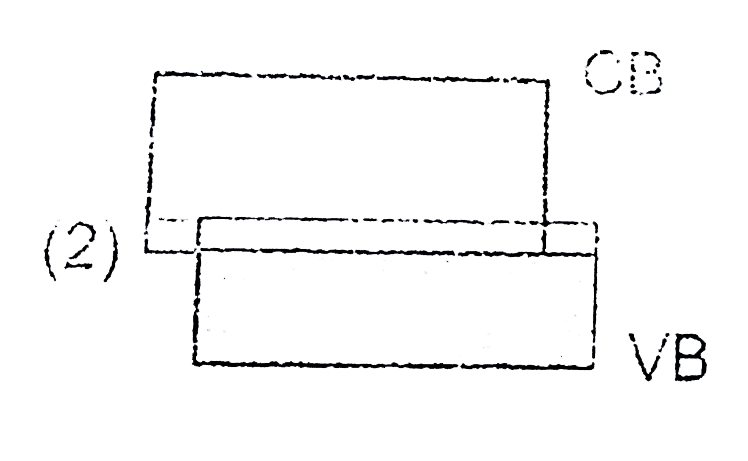
Which of the energy band diagrams shown in the figure corresponds to that of a semiconductor?

The correct Answer is:D
To determine which energy band diagram corresponds to a semiconductor, we need to understand the characteristics of energy bands in conductors, semiconductors, and insulators.
1. Understand Energy Bands:
- In solids, electrons occupy energy bands. The two most important bands are the valence band (filled with electrons) and the conduction band (where electrons can move freely and conduct electricity).
2. Identify the Characteristics of Each Type of Material:
- Insulator:
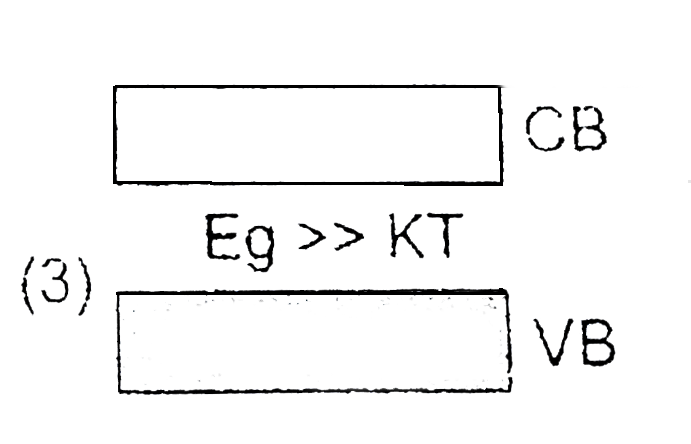
- Has a large energy gap (EG) between the valence band and the conduction band.
- The gap is much greater than thermal energy (KT), meaning electrons cannot easily jump from the valence band to the conduction band, resulting in no electrical conductivity.
- Conductor:
- The conduction band and valence band overlap or coincide, allowing electrons to flow freely, which results in high conductivity.
- Semiconductor:
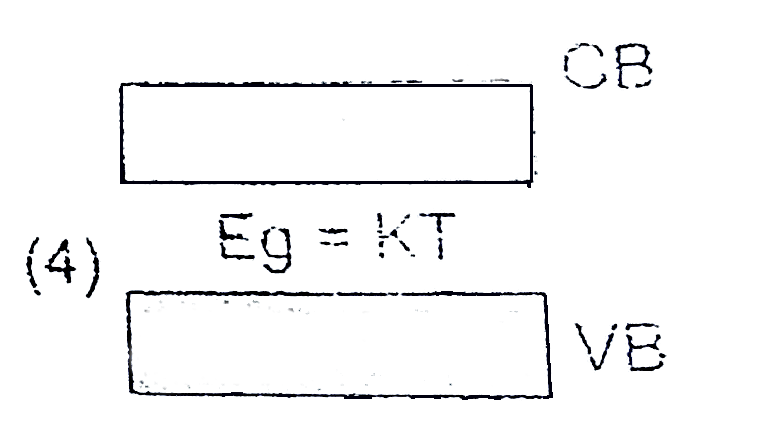
- Has a small energy gap (EG) between the valence band and the conduction band.
- The gap is comparable to thermal energy (KT), allowing some electrons to jump from the valence band to the conduction band at room temperature, enabling partial conductivity.
3. Analyze the Given Options:
- Look at the energy band diagrams provided in the question.
- Identify which diagram shows a small energy gap between the valence band and the conduction band, indicating that it can conduct electricity under certain conditions.
4. Select the Correct Diagram:
- Based on the characteristics discussed, the diagram that shows a small energy gap (EG ≈ KT) between the valence band and conduction band corresponds to a semiconductor.
- From the options provided, identify that option number four matches this description.
5. Conclusion:
- Therefore, the energy band diagram that corresponds to a semiconductor is option number four.
- In solids, electrons occupy energy bands. The two most important bands are the valence band (filled with electrons) and the conduction band (where electrons can move freely and conduct electricity).
- Insulator:
- Has a large energy gap (EG) between the valence band and the conduction band.
- The gap is much greater than thermal energy (KT), meaning electrons cannot easily jump from the valence band to the conduction band, resulting in no electrical conductivity.
- Conductor:
- The conduction band and valence band overlap or coincide, allowing electrons to flow freely, which results in high conductivity.
- Semiconductor:
- Has a small energy gap (EG) between the valence band and the conduction band.
- The gap is comparable to thermal energy (KT), allowing some electrons to jump from the valence band to the conduction band at room temperature, enabling partial conductivity.
- Look at the energy band diagrams provided in the question.
- Identify which diagram shows a small energy gap between the valence band and the conduction band, indicating that it can conduct electricity under certain conditions.
- Based on the characteristics discussed, the diagram that shows a small energy gap (EG ≈ KT) between the valence band and conduction band corresponds to a semiconductor.
- From the options provided, identify that option number four matches this description.
- Therefore, the energy band diagram that corresponds to a semiconductor is option number four.
Topper's Solved these Questions
- SEMICONDUCTORSBOOK - RESONANCE ENGLISHCHAPTER - SEMICONDUCTORSEXERCISE - Exercise
100 Videos
- SEMICONDUCTORSBOOK - RESONANCE ENGLISHCHAPTER - SEMICONDUCTORSEXERCISE - Exercise 2
16 Videos
- REVISION DPPBOOK - RESONANCE ENGLISHCHAPTER - REVISION DPPEXERCISE - All Questions
463 Videos
- SIMPLE HARMONIC MOTION BOOK - RESONANCE ENGLISHCHAPTER - SIMPLE HARMONIC MOTION EXERCISE - Advanced Level Problems
13 Videos
Similar Questions
Knowledge Check
Which of the diagram shown in figures respresents variation of total mechanical energy of a pendulam oscillation in air as function of time?
A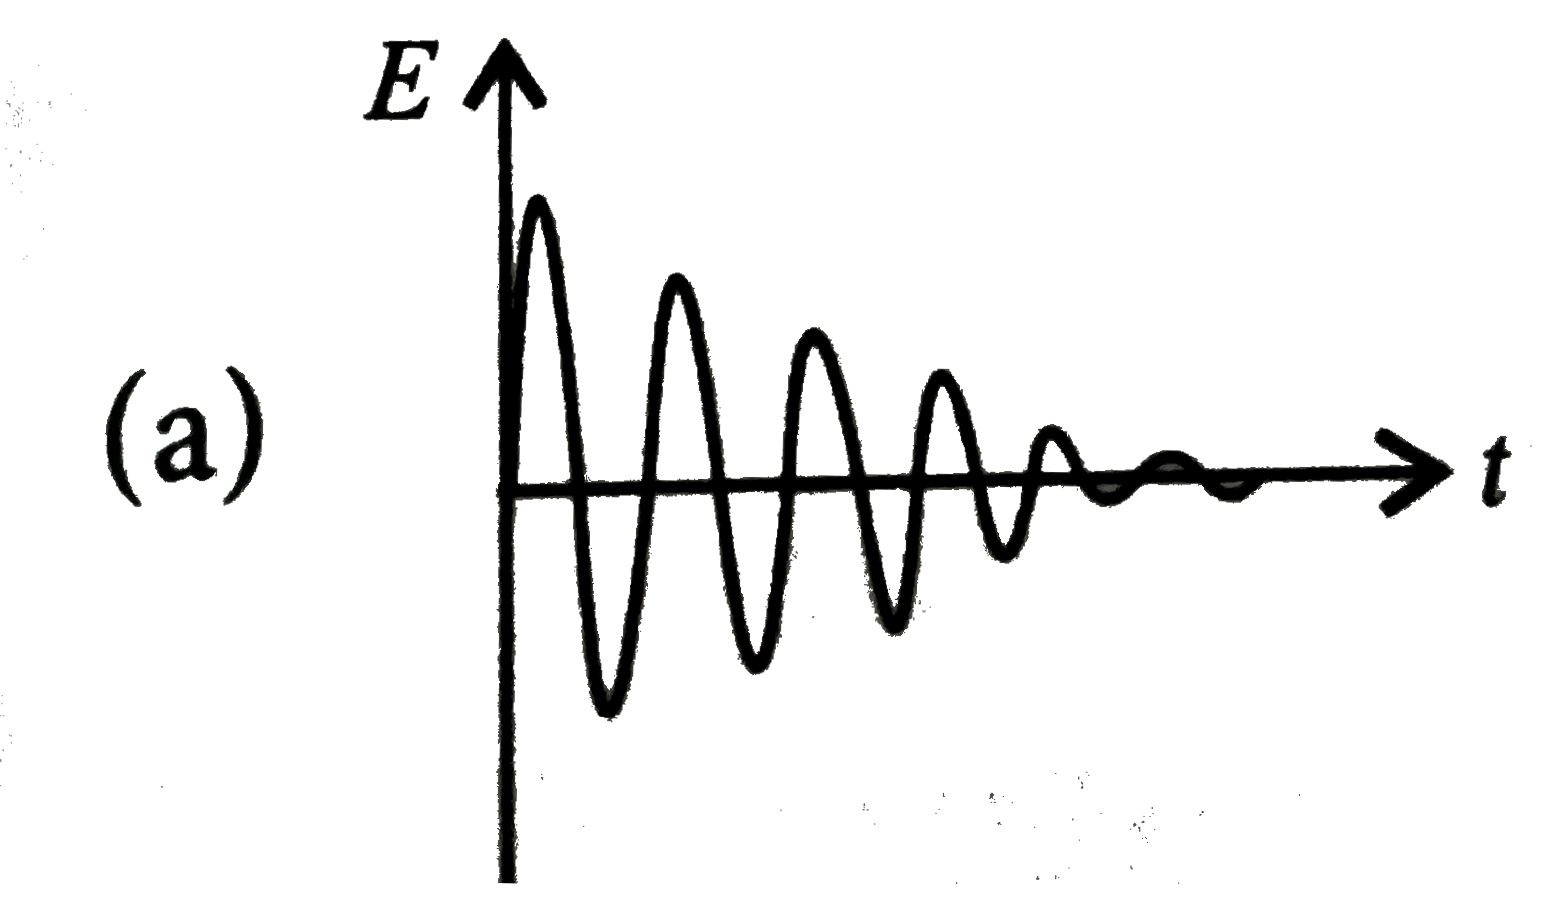 B
B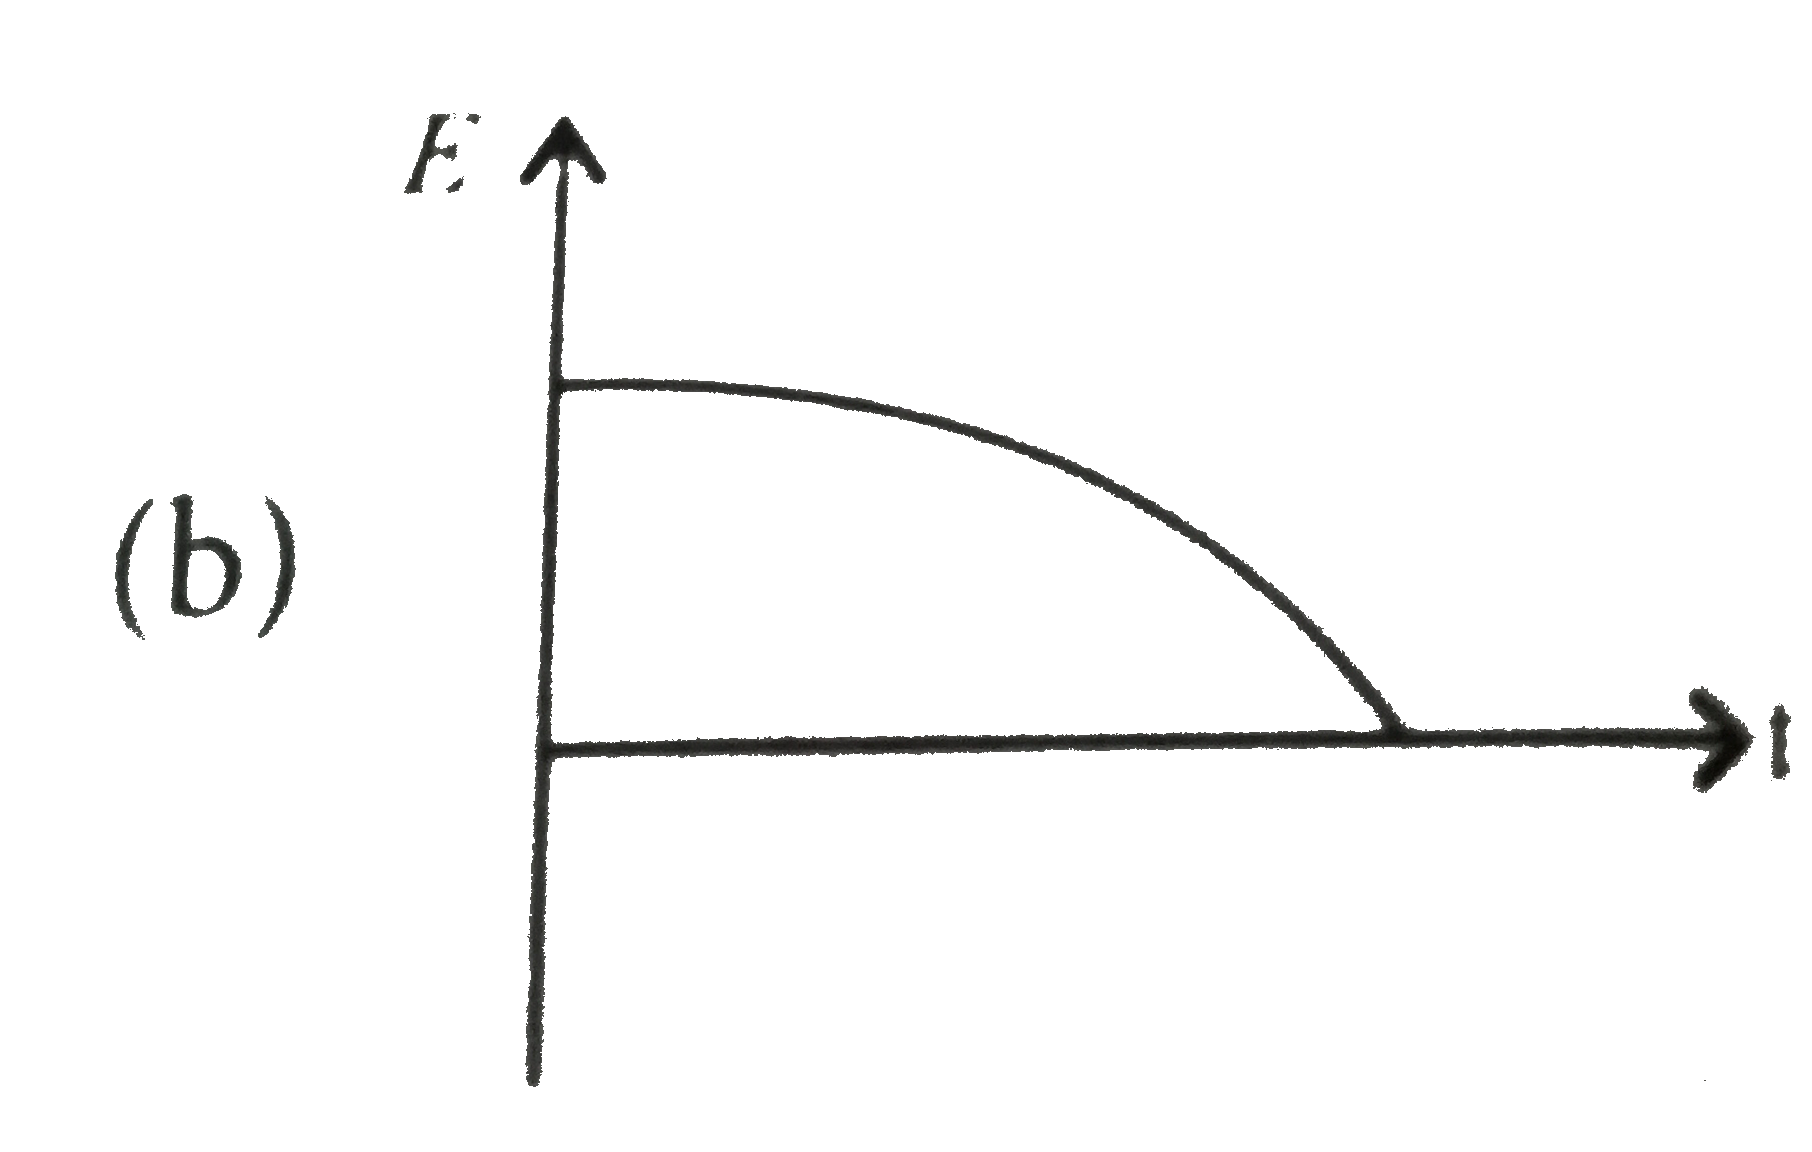 C
C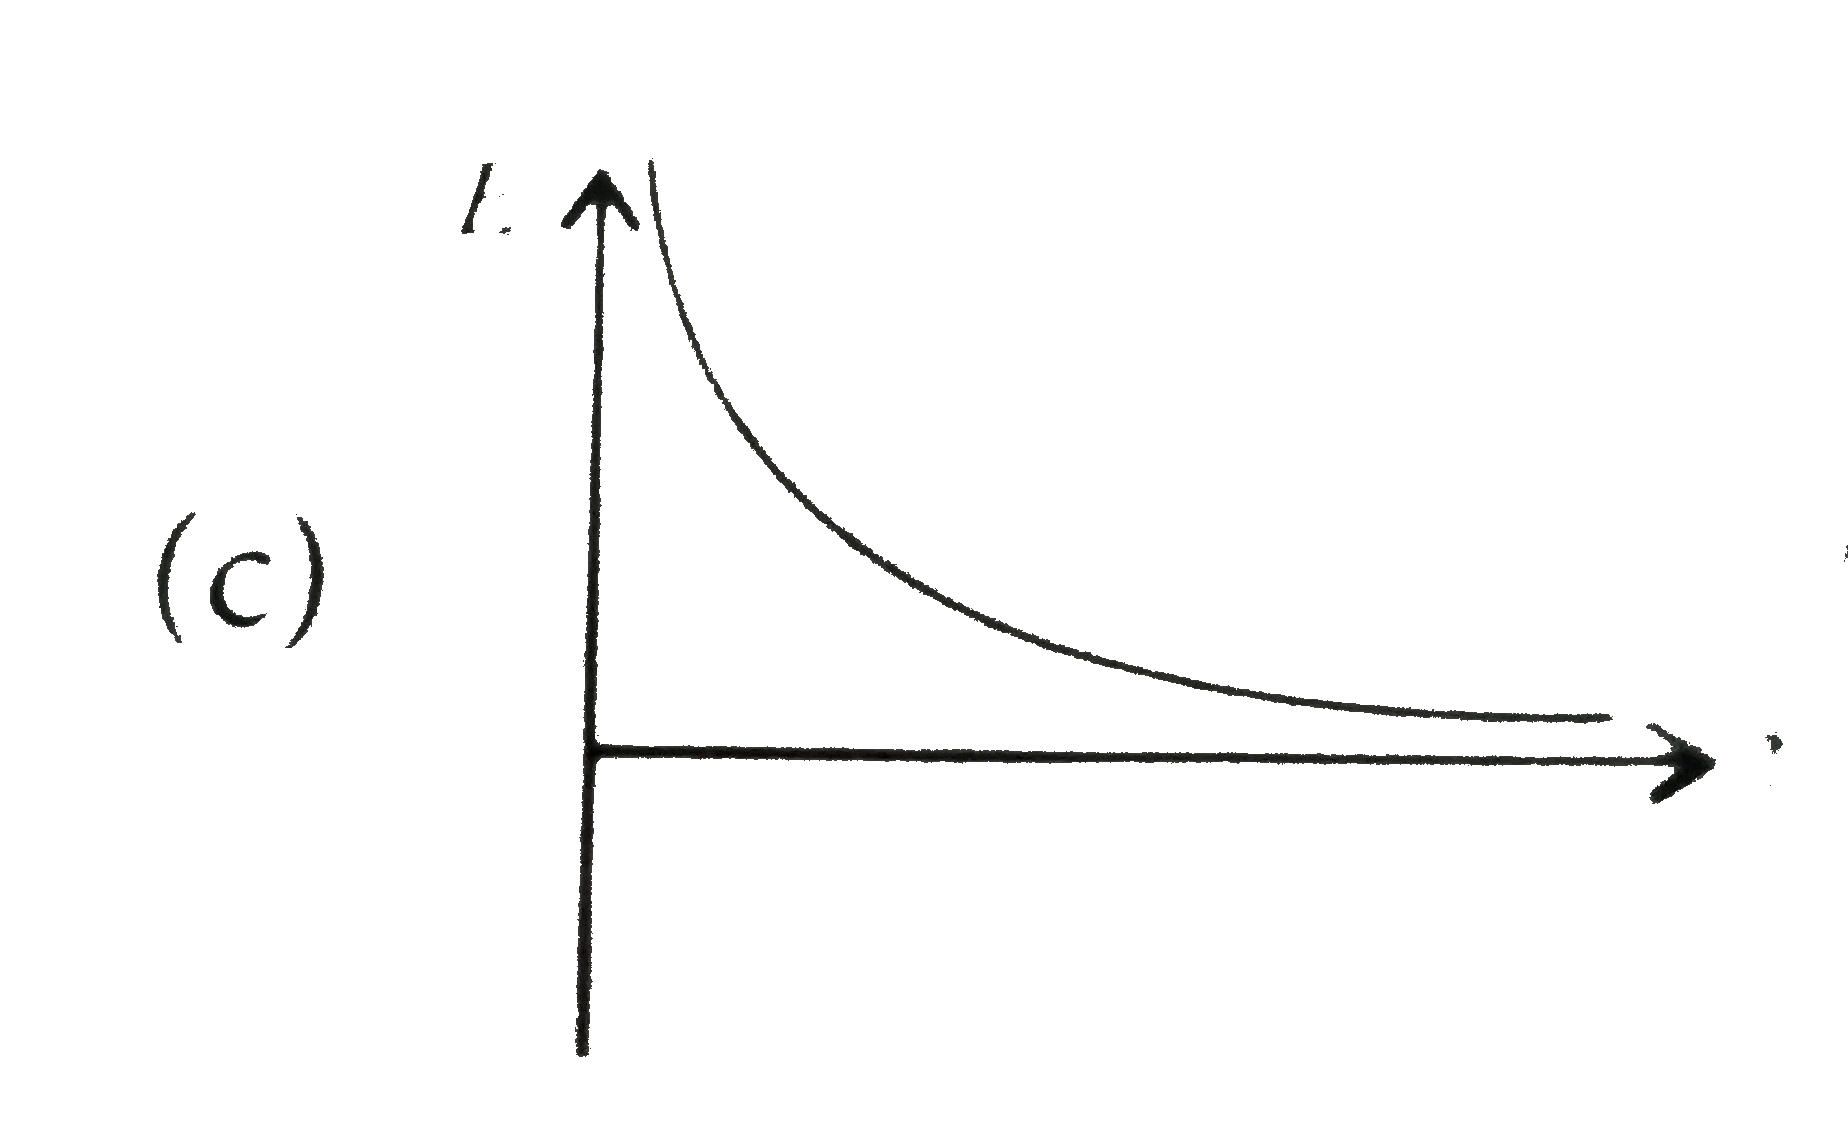 D
D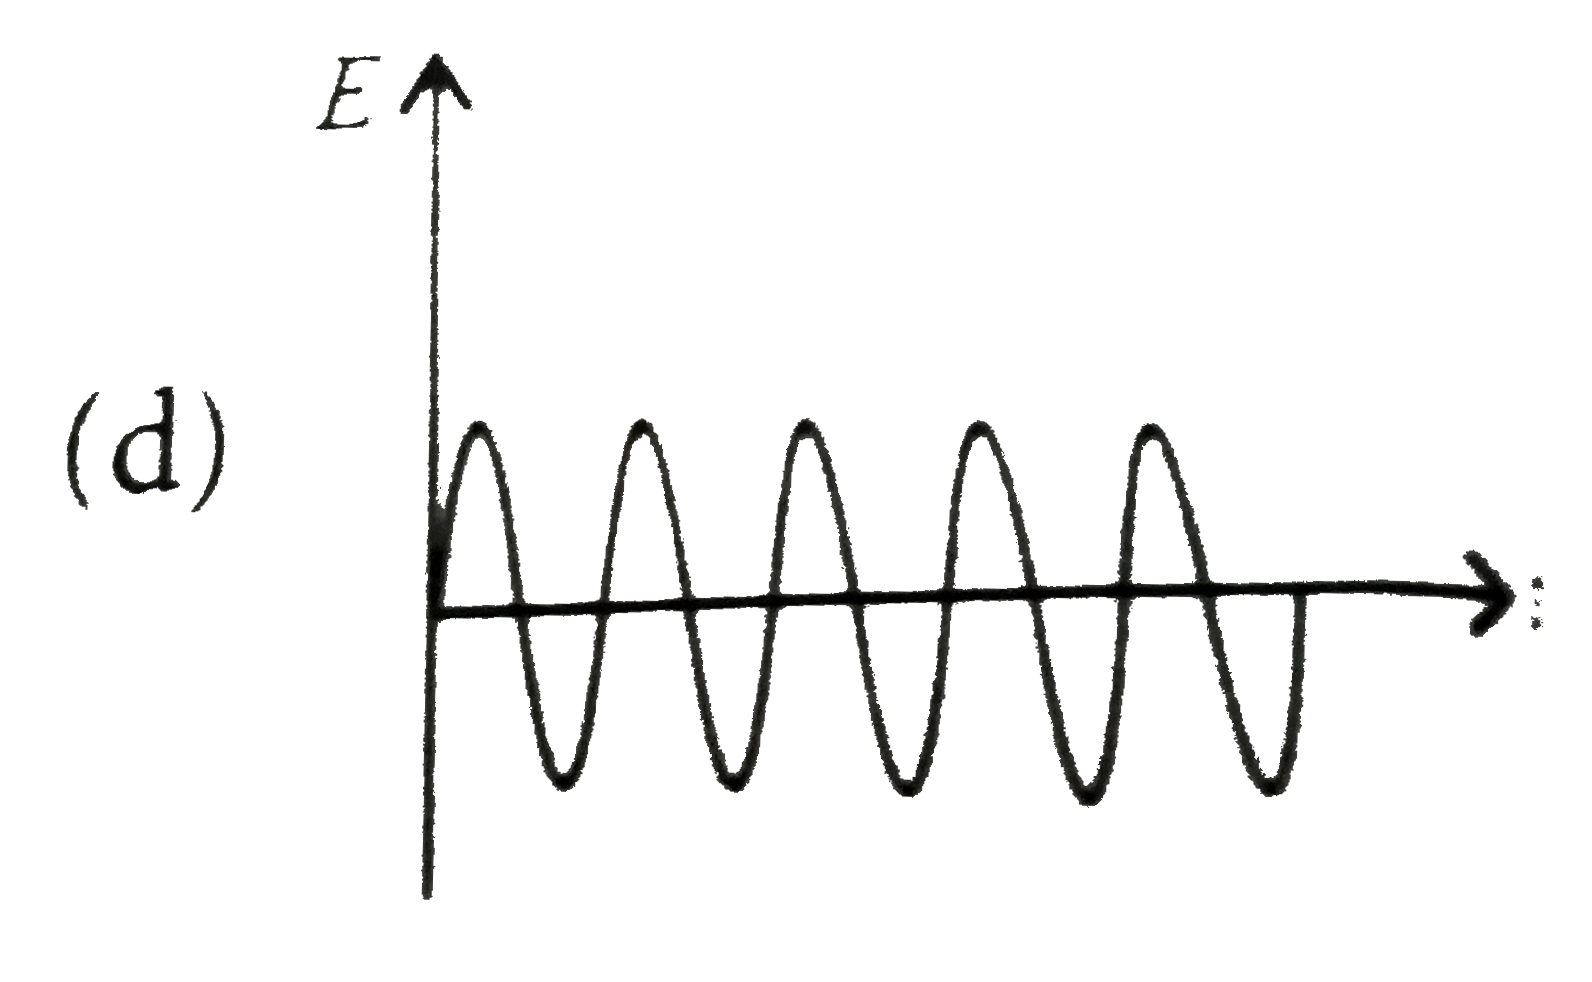
A body is moving unidirectionally under the influence of a source of constant power supplying energy. Which of the diagrams shown in figure. Correctly shows the displacement-time curve for its motion ?
A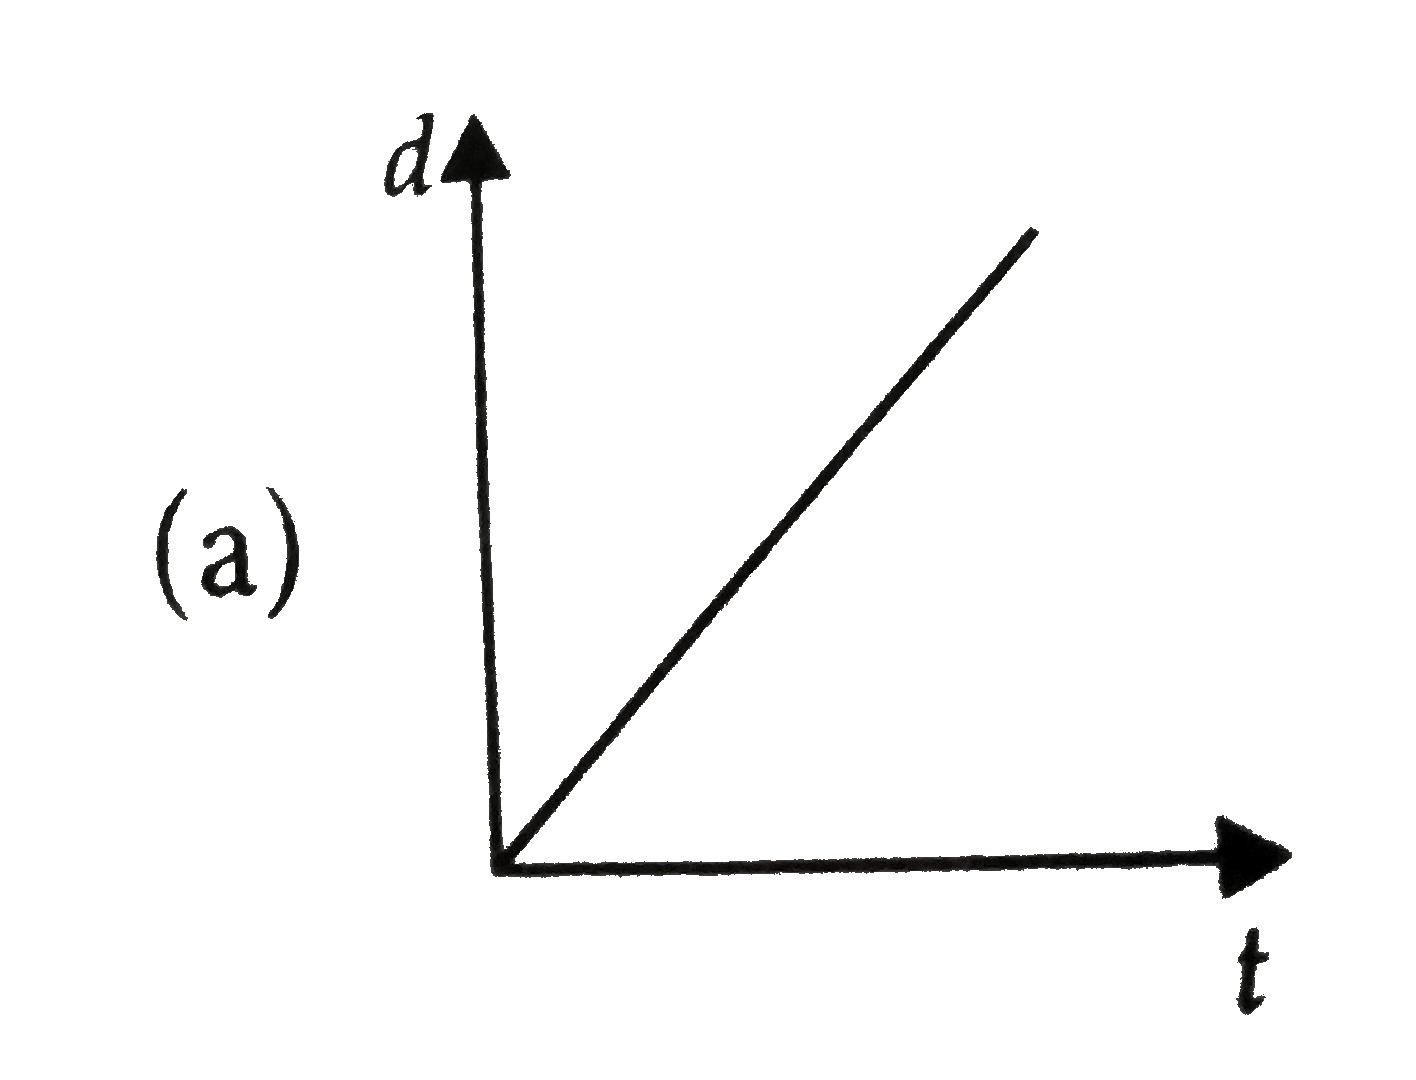 B
B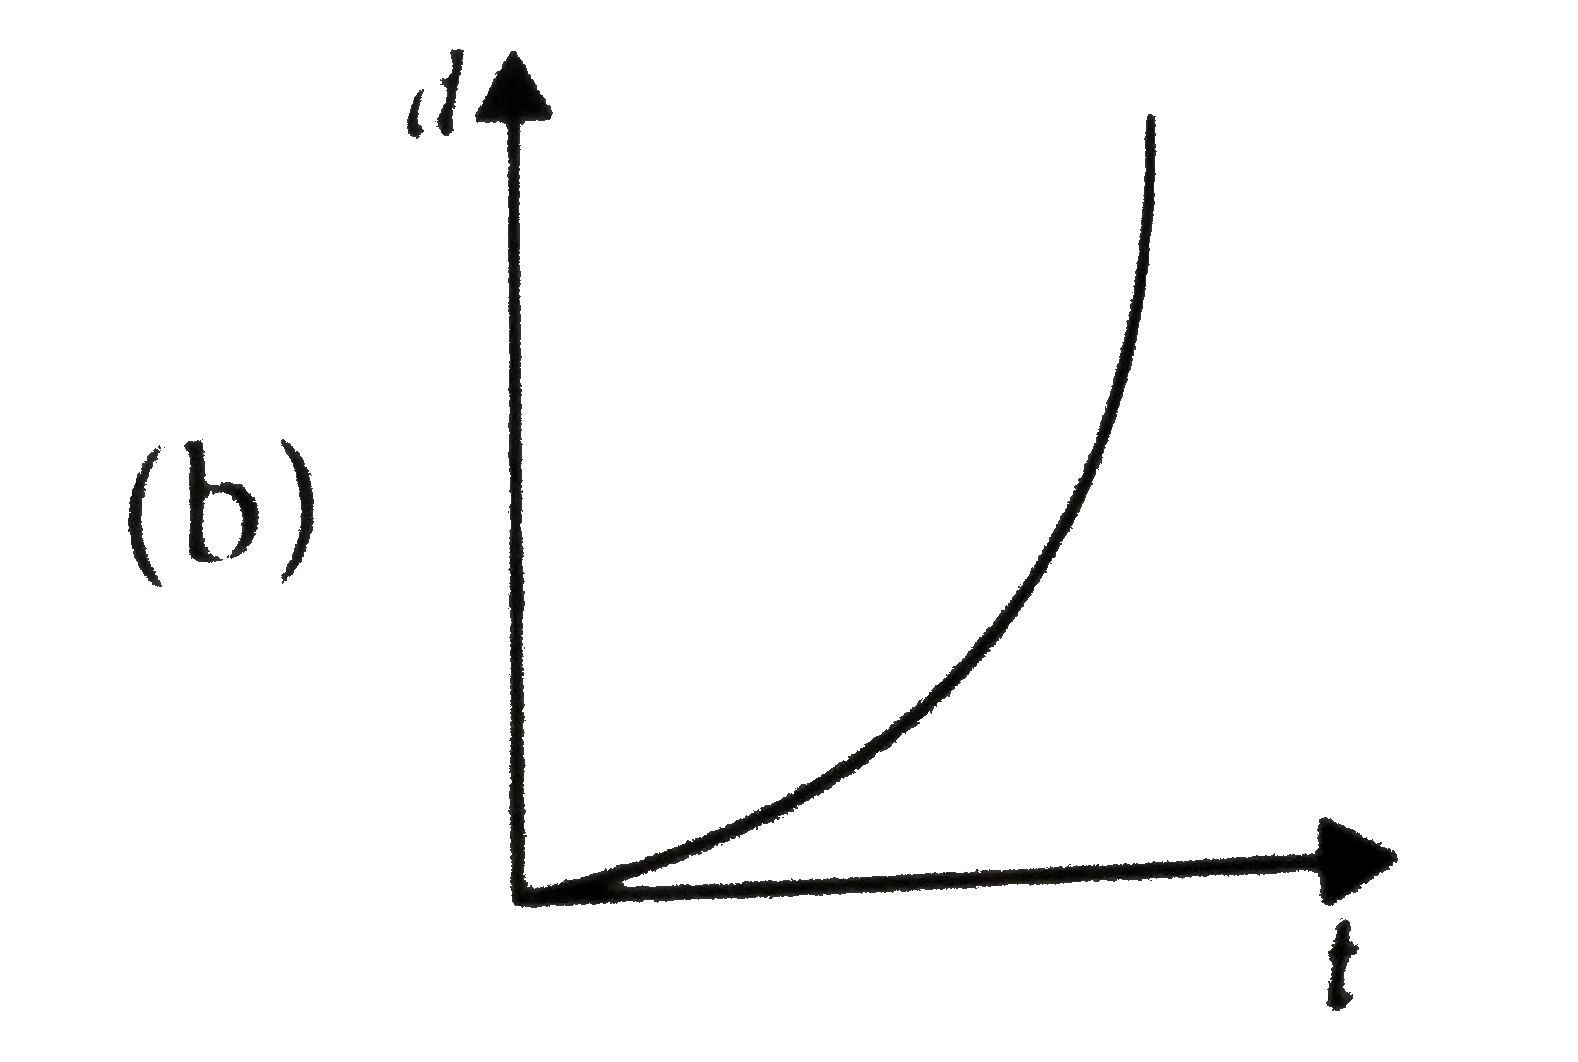 C
C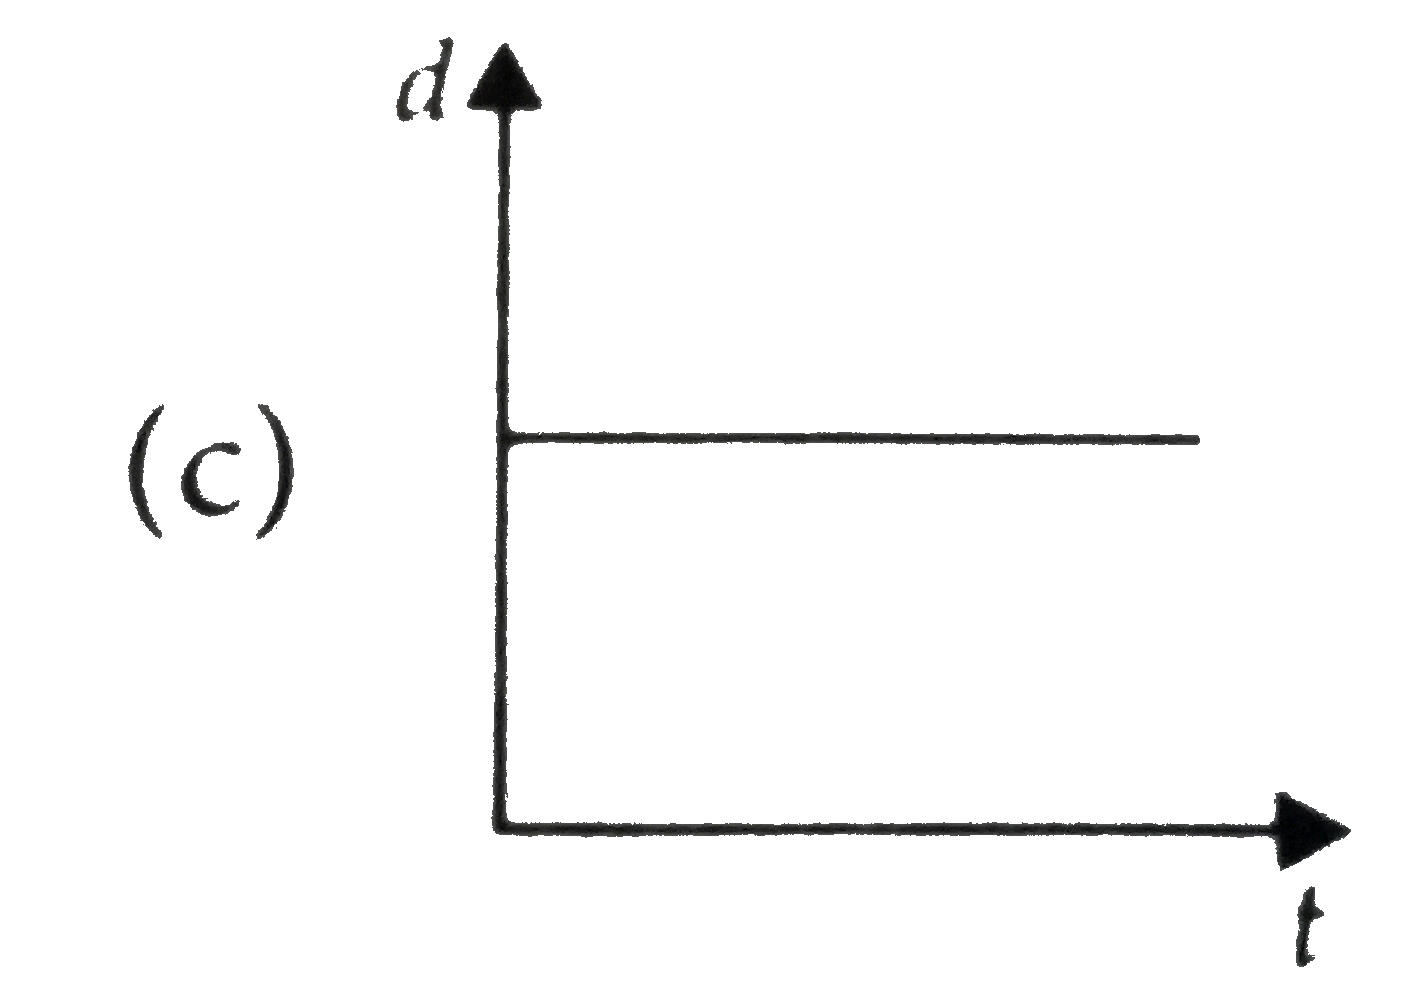 D
D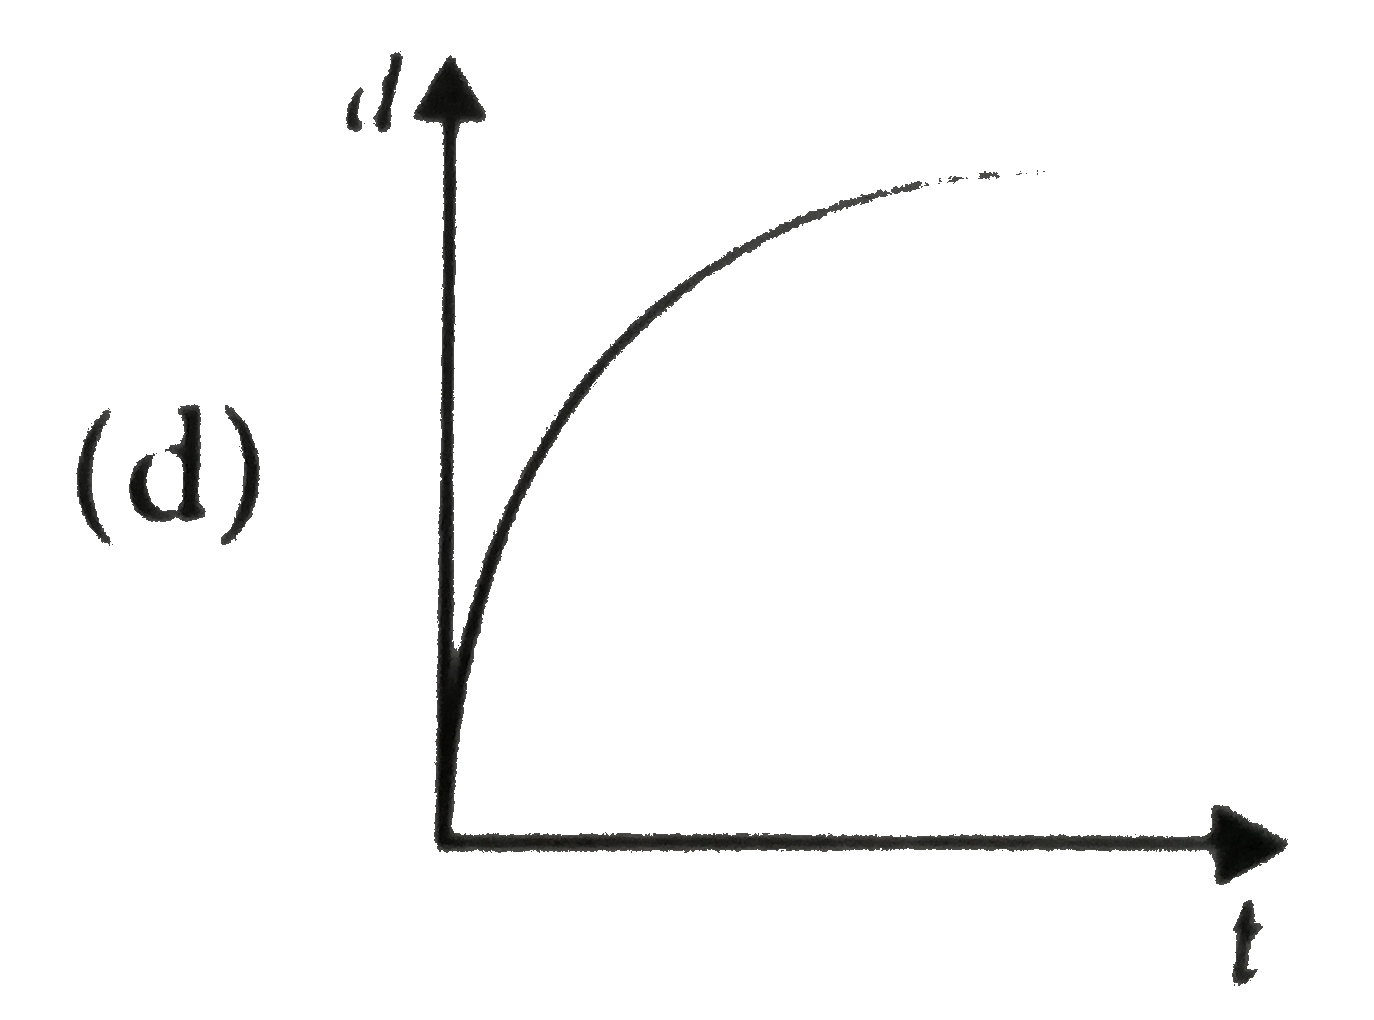
The energy band gap is maximum in
View SolutionIn the circuit diagram shown in Figure,
 .
.
View SolutionWhich type of aestivation is shown in the diagram ?
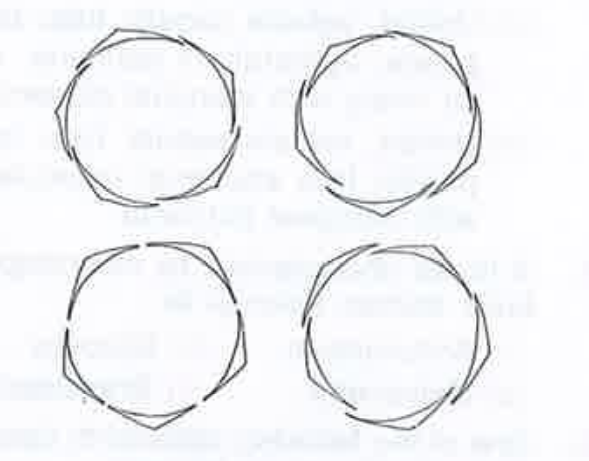
View SolutionA body is moving unidirectionally under the influence of a source of constant power supplying energy. Which of the diagrams shown in figure. Correctly shows the displacement-time curve for its motion ?
View SolutionP−T diagram is shown in Fig. Choose the corresponding V−T diagram.
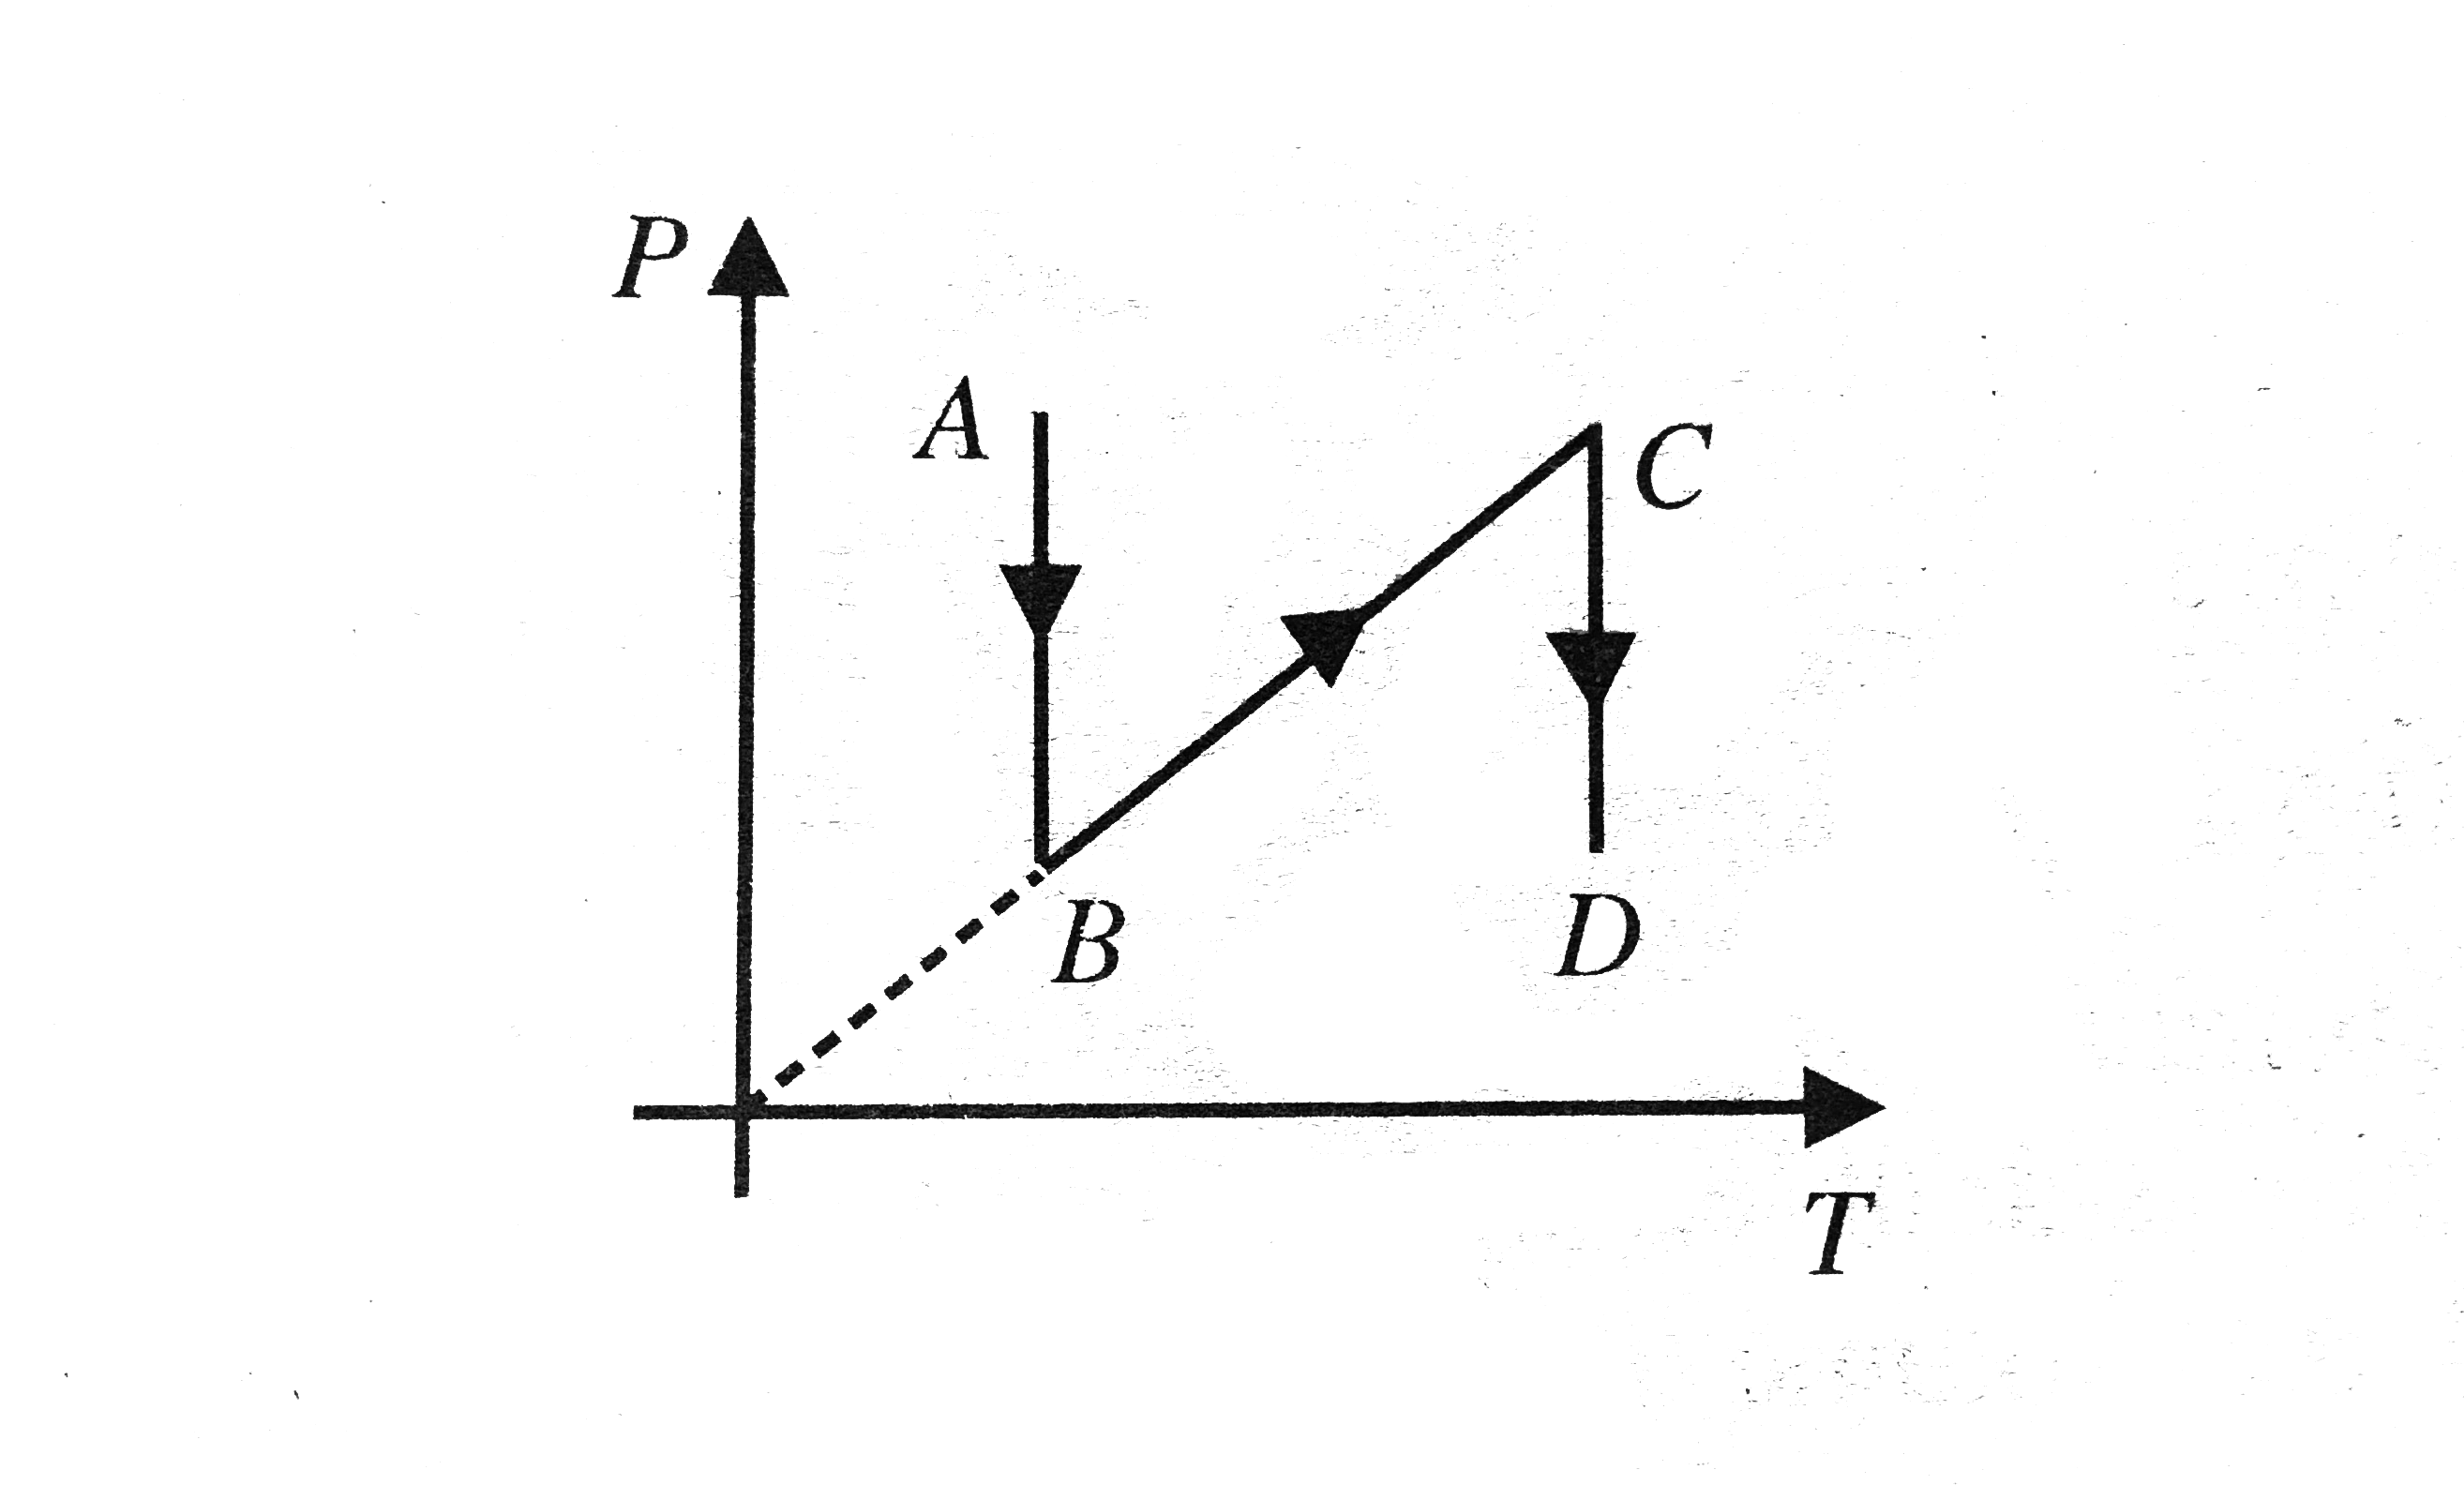
View SolutionP−T diagram is shown in Fig. Choose the corresponding V−T diagram.

View Solution
