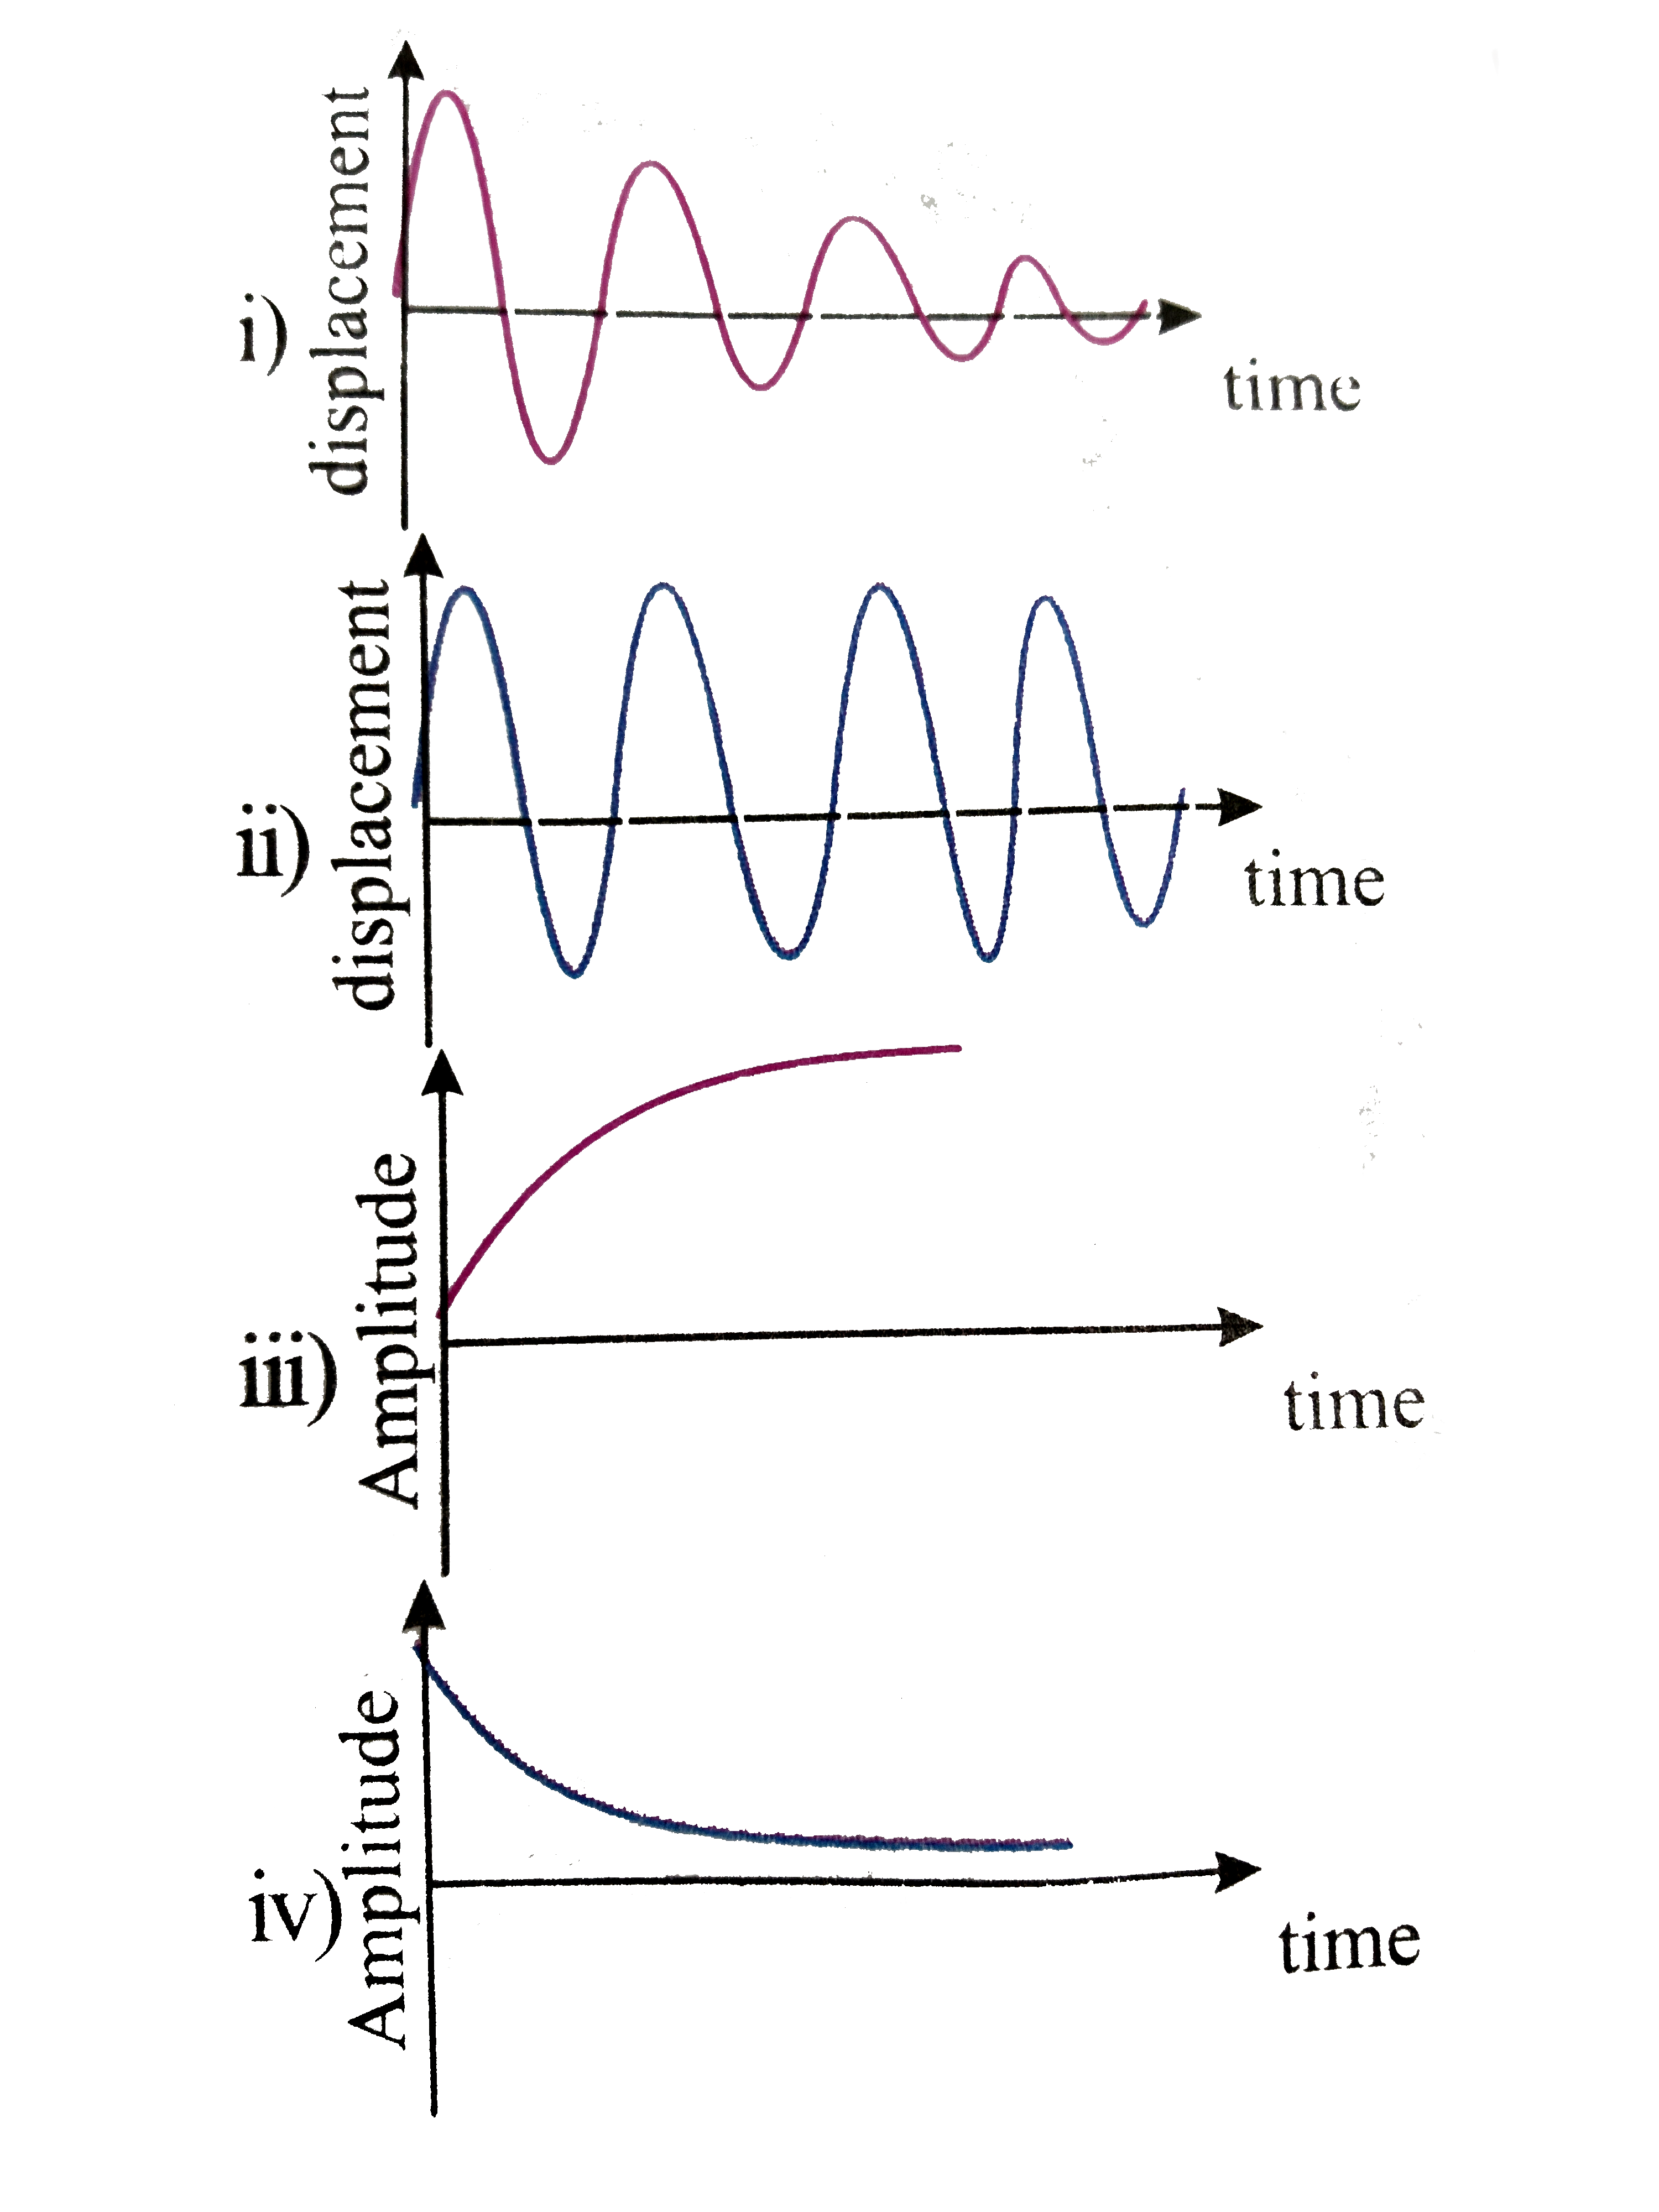
Which of the following energy-time graphs represents damped harmonic oscillator.
A

B

C

D

Text Solution
The correct Answer is:C
The energy of the damped harmonic oscillator is
E=12kA2e−bt/m …(i)
where the symbols have their usual meanings.
Equation (i) shows amplitude of the damped harmonic oscillator decreases exponentially with time. Hence, option ( c ) represents the correct graph.
correct choice is c.
|
Topper's Solved these Questions
- OSCILLATIONSBOOK - MODERN PUBLICATIONCHAPTER - OSCILLATIONSEXERCISE - MCQ (LEVEL-III) Questions From AIEEE/JEE Examination
10 Videos
- OSCILLATIONSBOOK - MODERN PUBLICATIONCHAPTER - OSCILLATIONSEXERCISE - RCQ
7 Videos
- OSCILLATIONSBOOK - MODERN PUBLICATIONCHAPTER - OSCILLATIONSEXERCISE - RCQ
7 Videos
- MOCK TEST-3BOOK - MODERN PUBLICATIONCHAPTER - MOCK TEST-3EXERCISE - MCQs
49 Videos
- PROPERTIES OF MATTERBOOK - MODERN PUBLICATIONCHAPTER - PROPERTIES OF MATTEREXERCISE - RECENT COMPETITIVE QUESTIONS
17 Videos
Similar Questions
Knowledge Check
Which of the following energy-time graphs represents dajmped harmonic oscillator?
A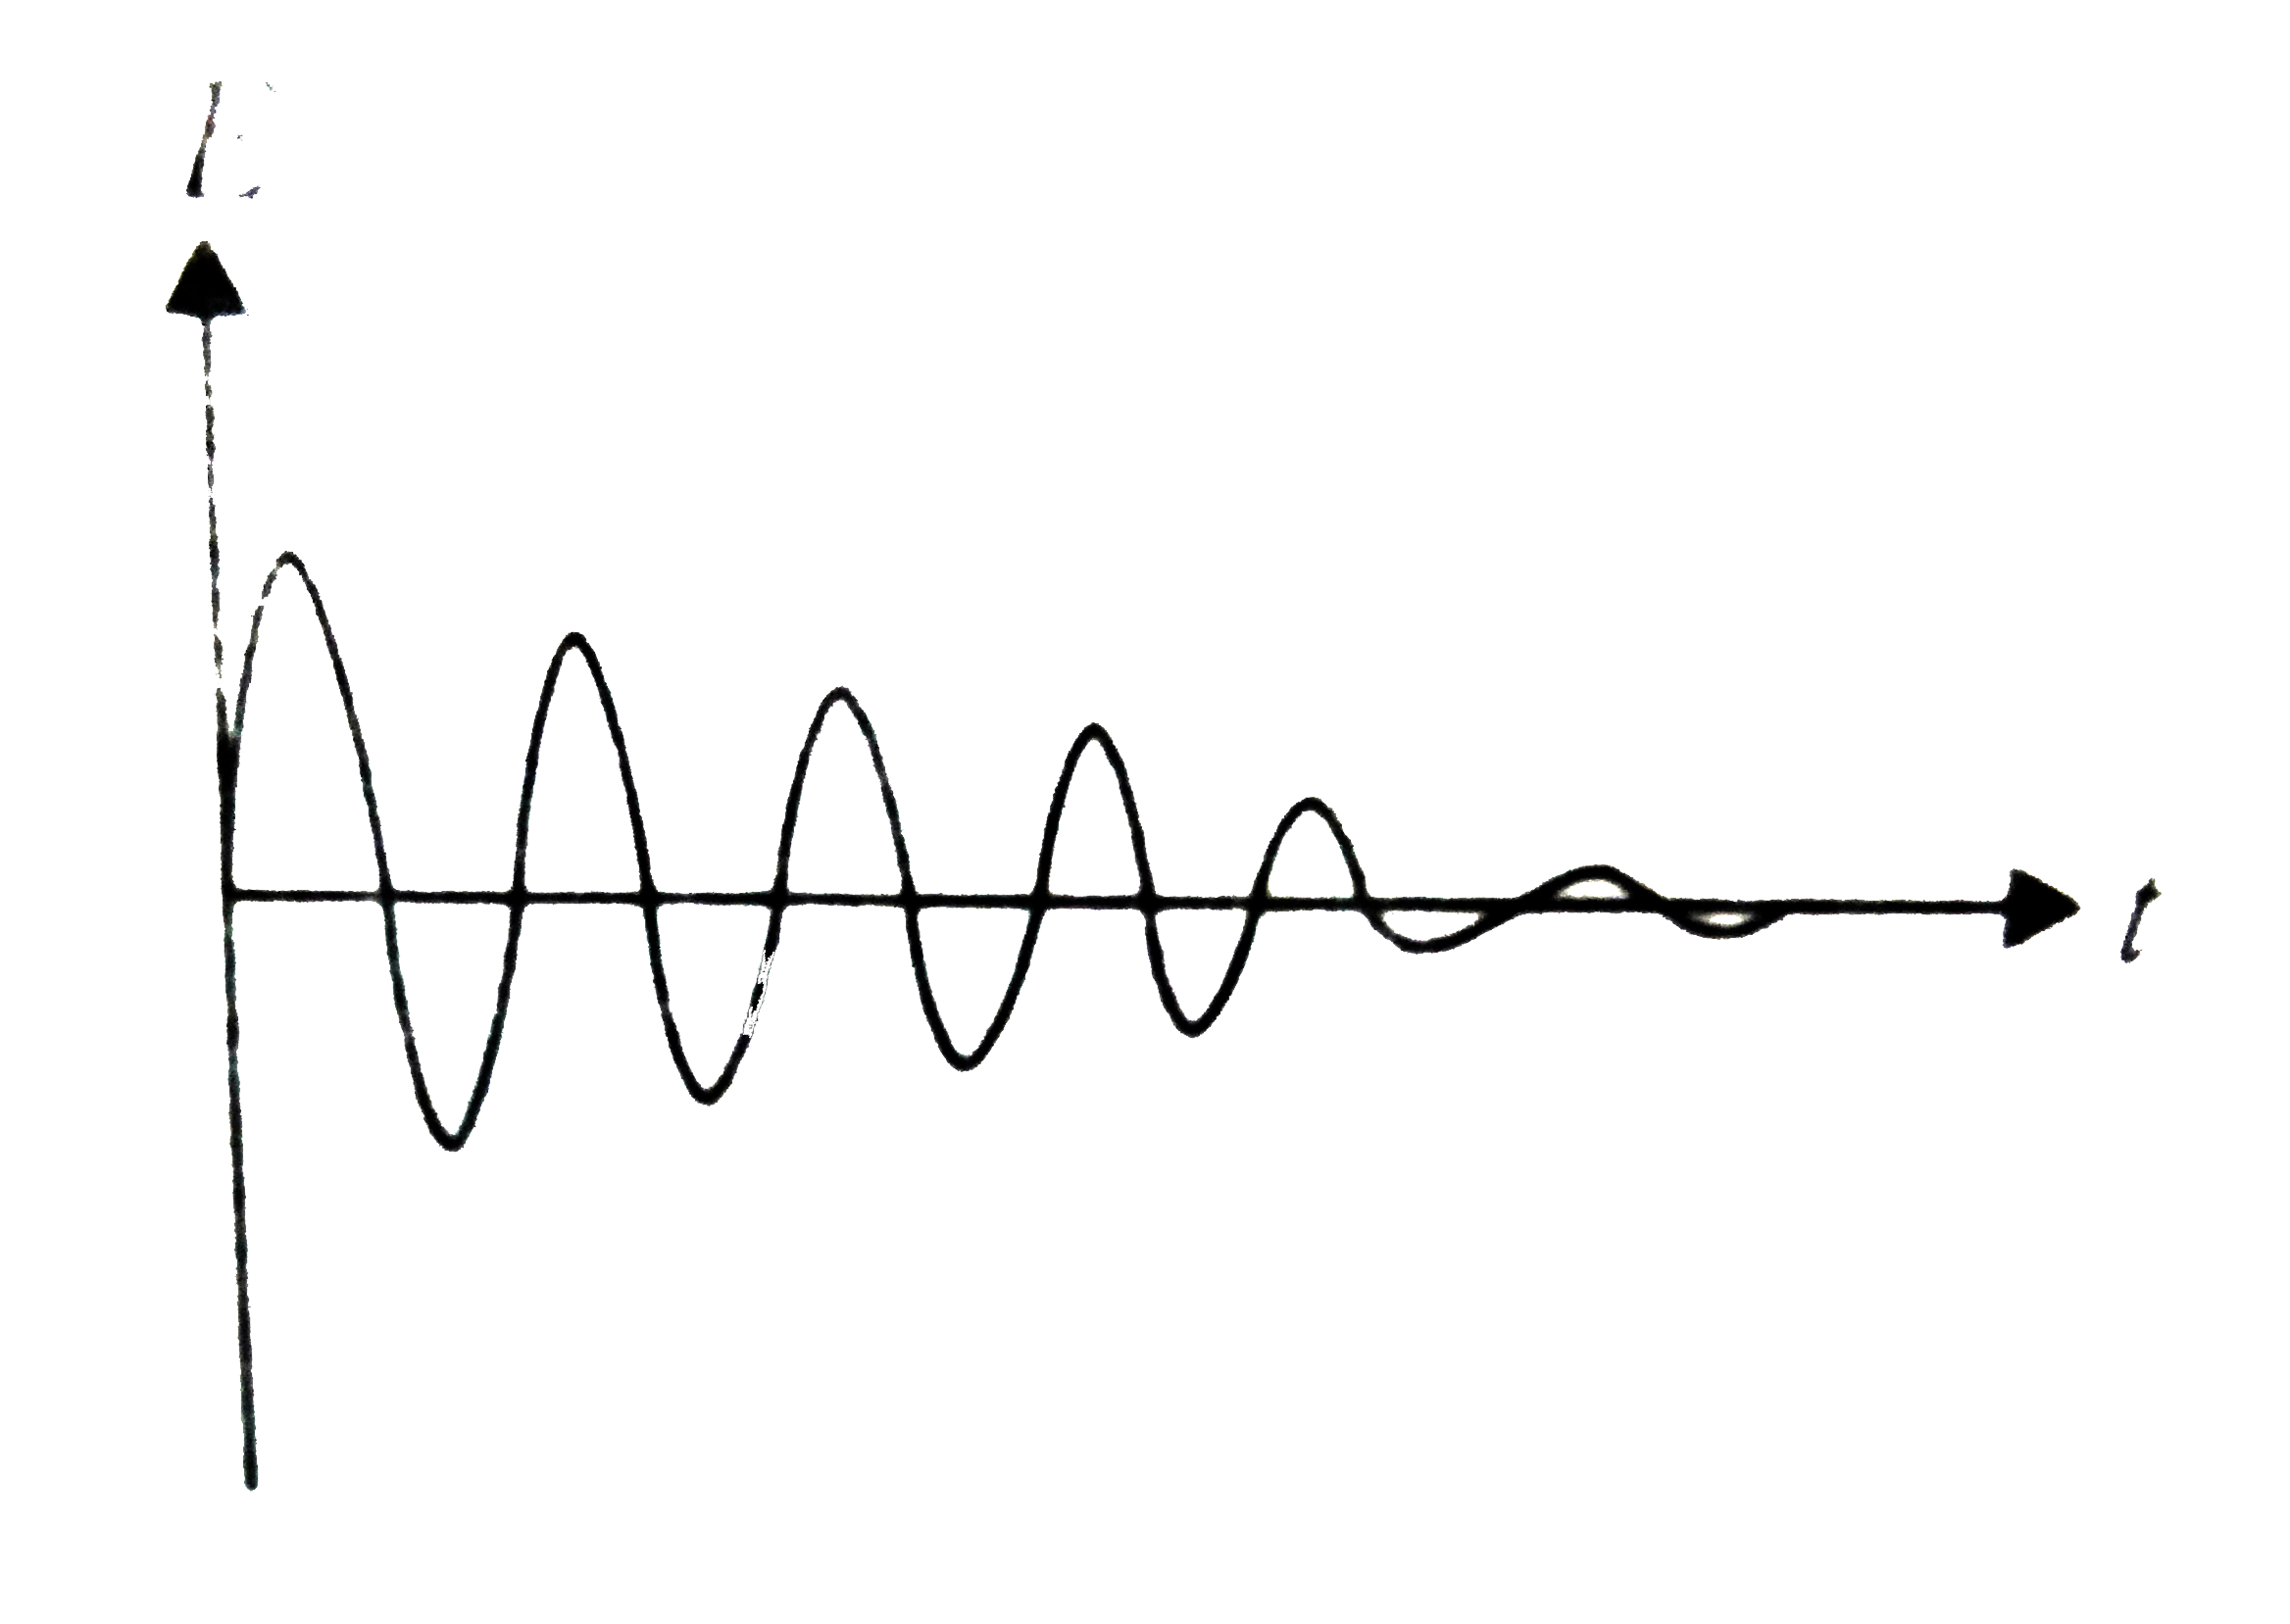 B
B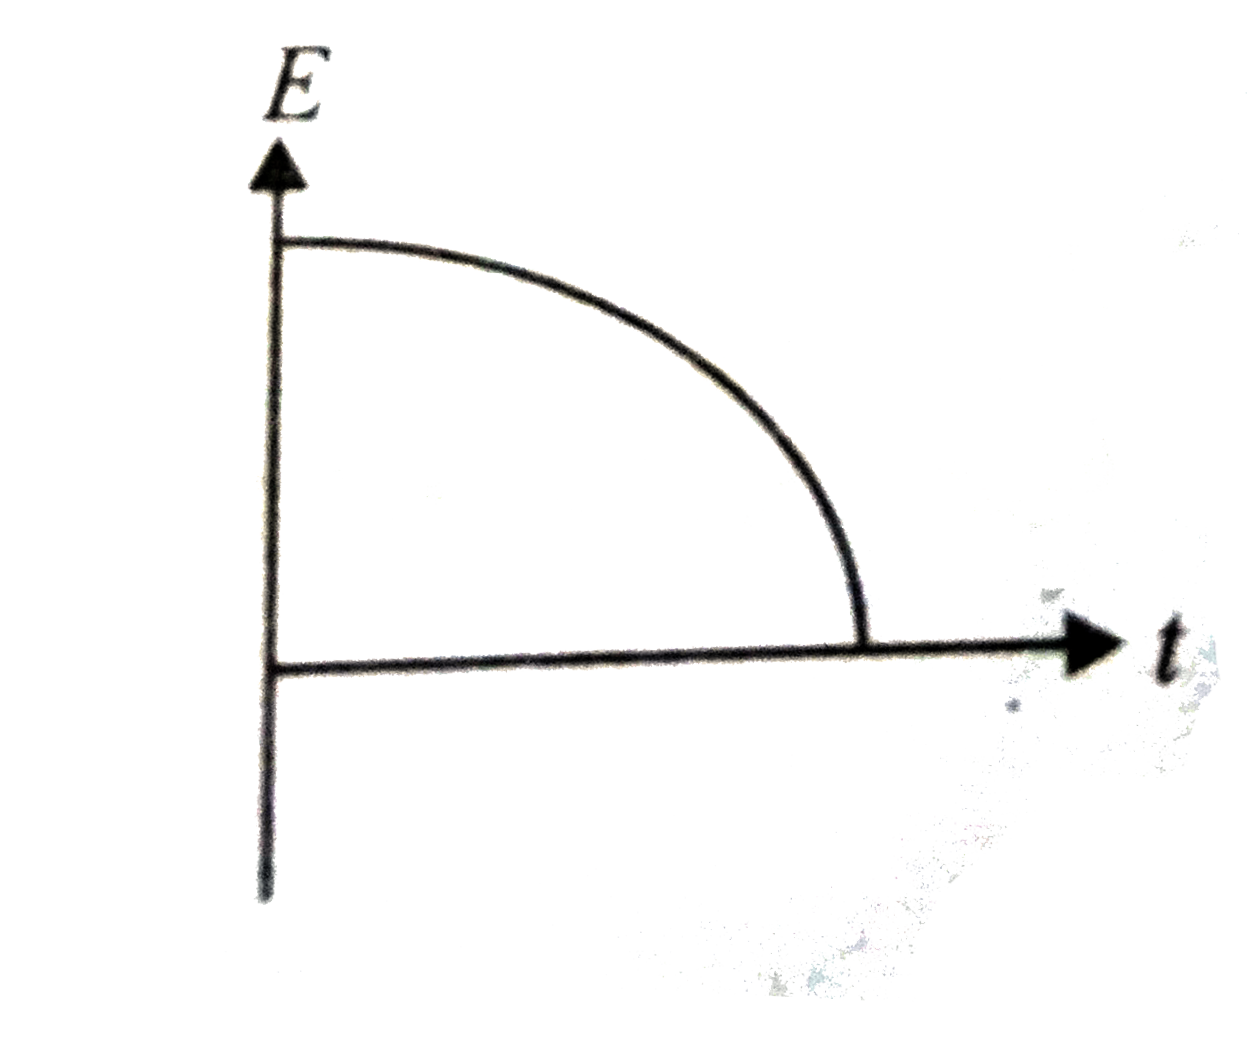 C
C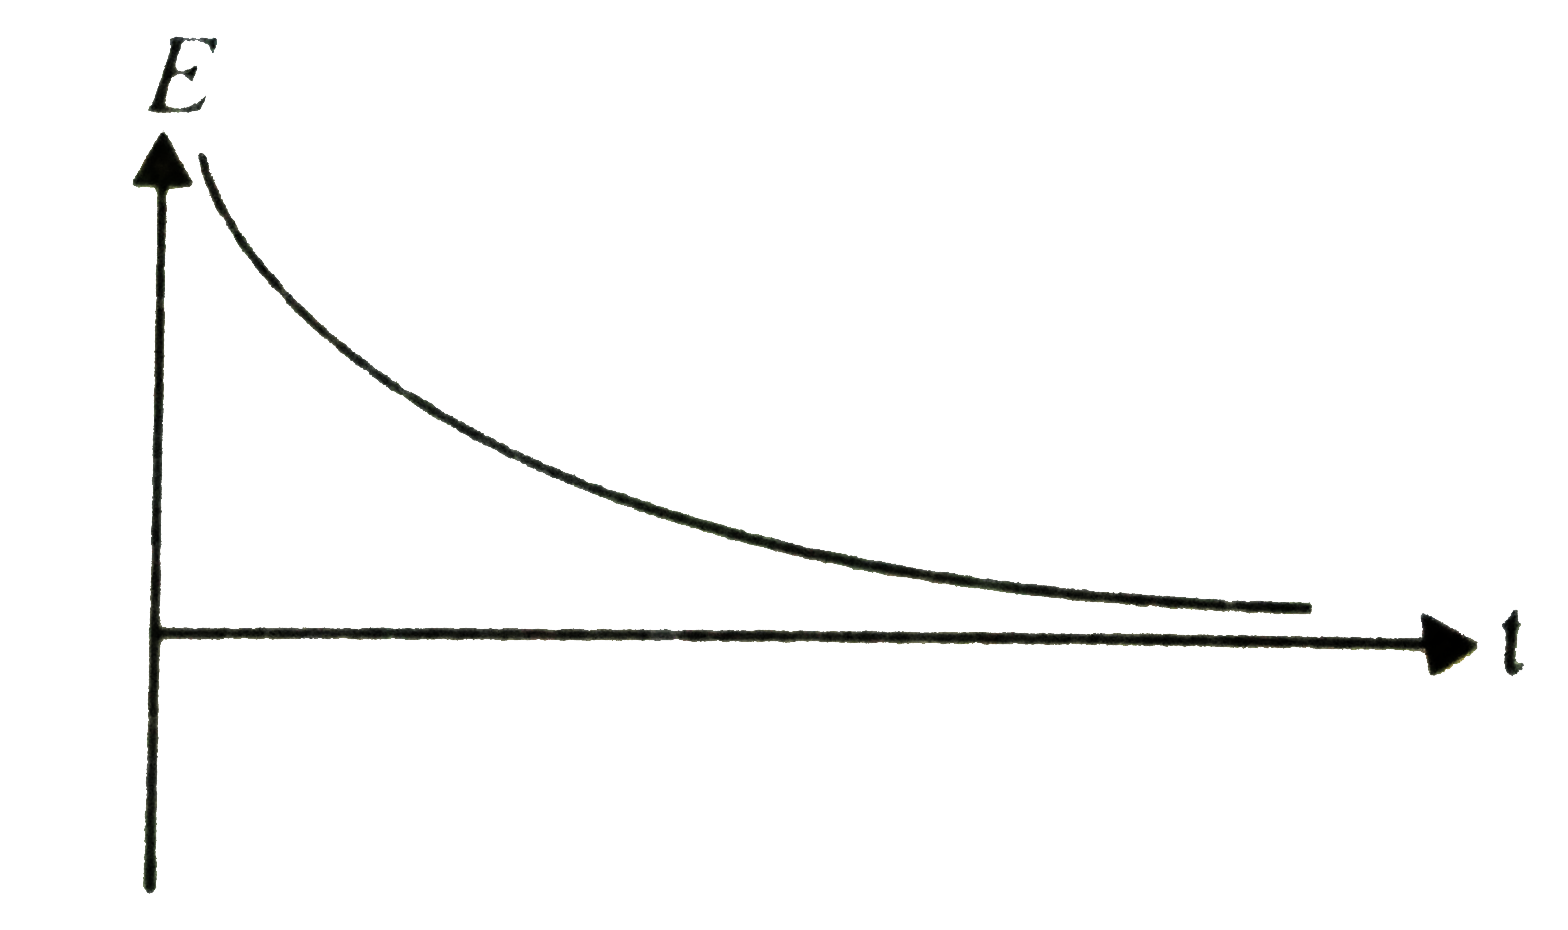 D
D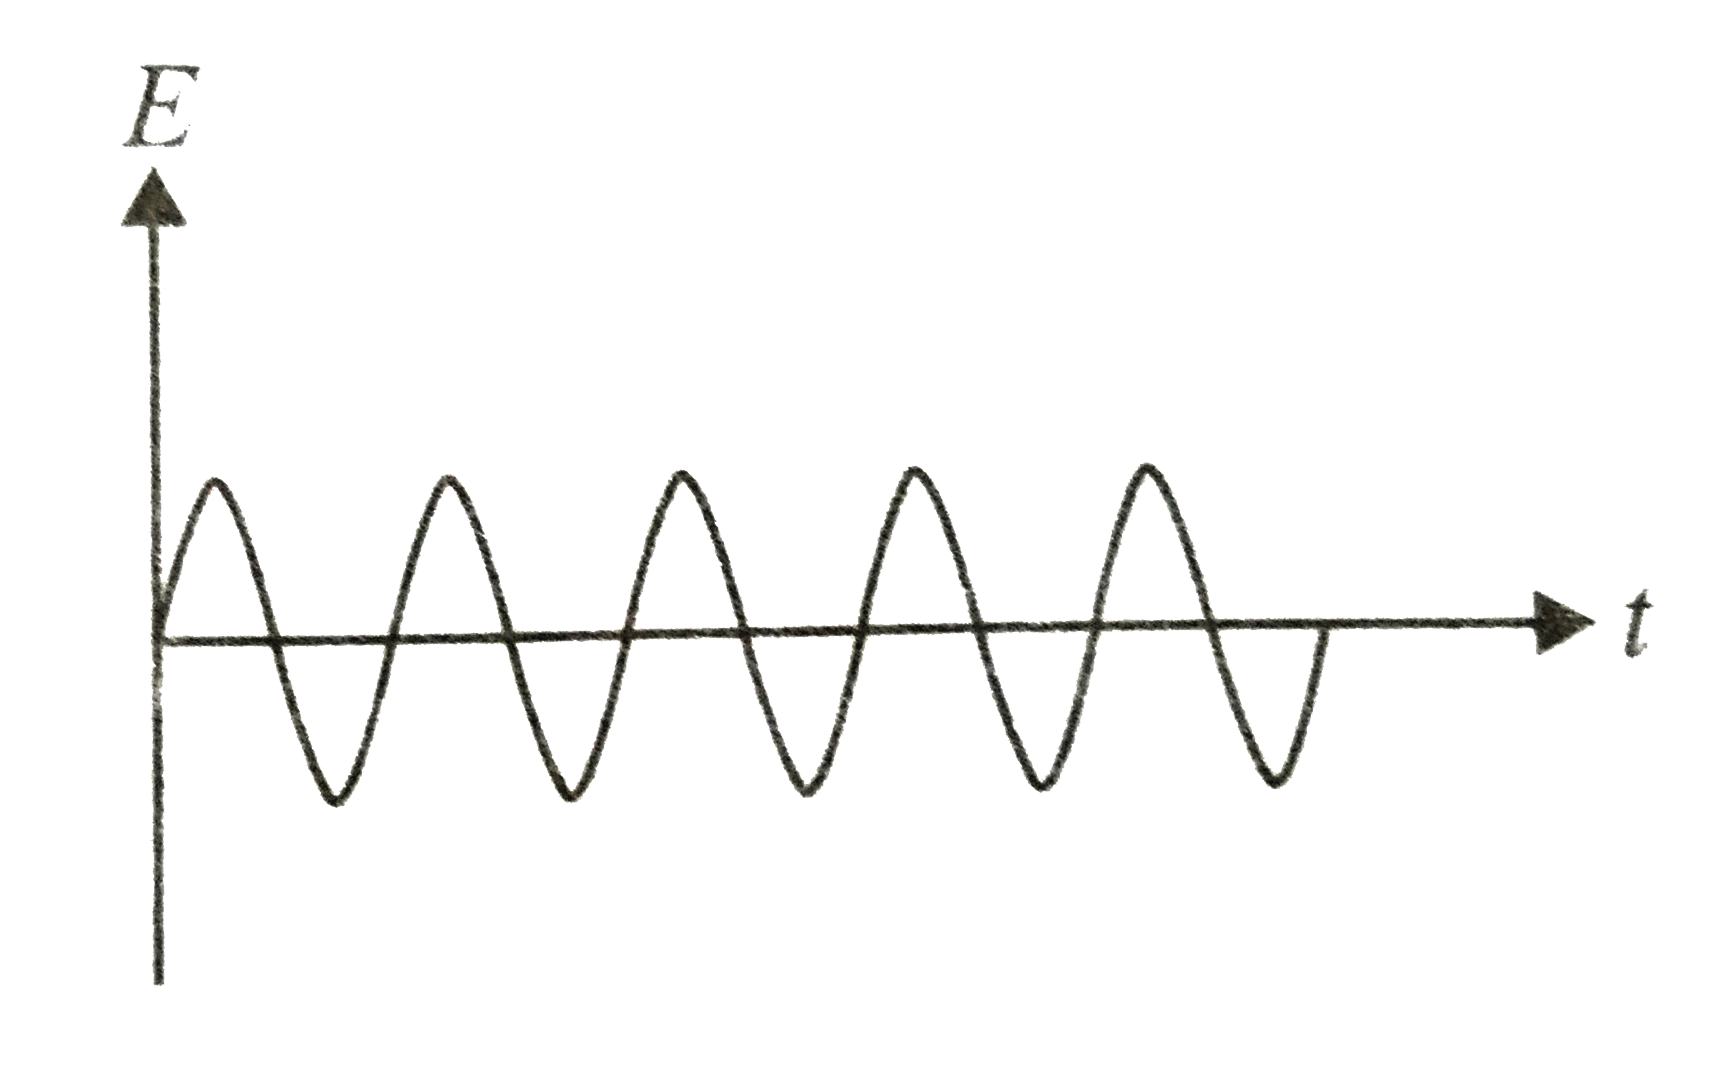
Which of the following energy-time graphs represents dajmped harmonic oscillator?
A B
B C
C D
D
Which of the following displacement-time graphs represent damped harmonic oscillation?
A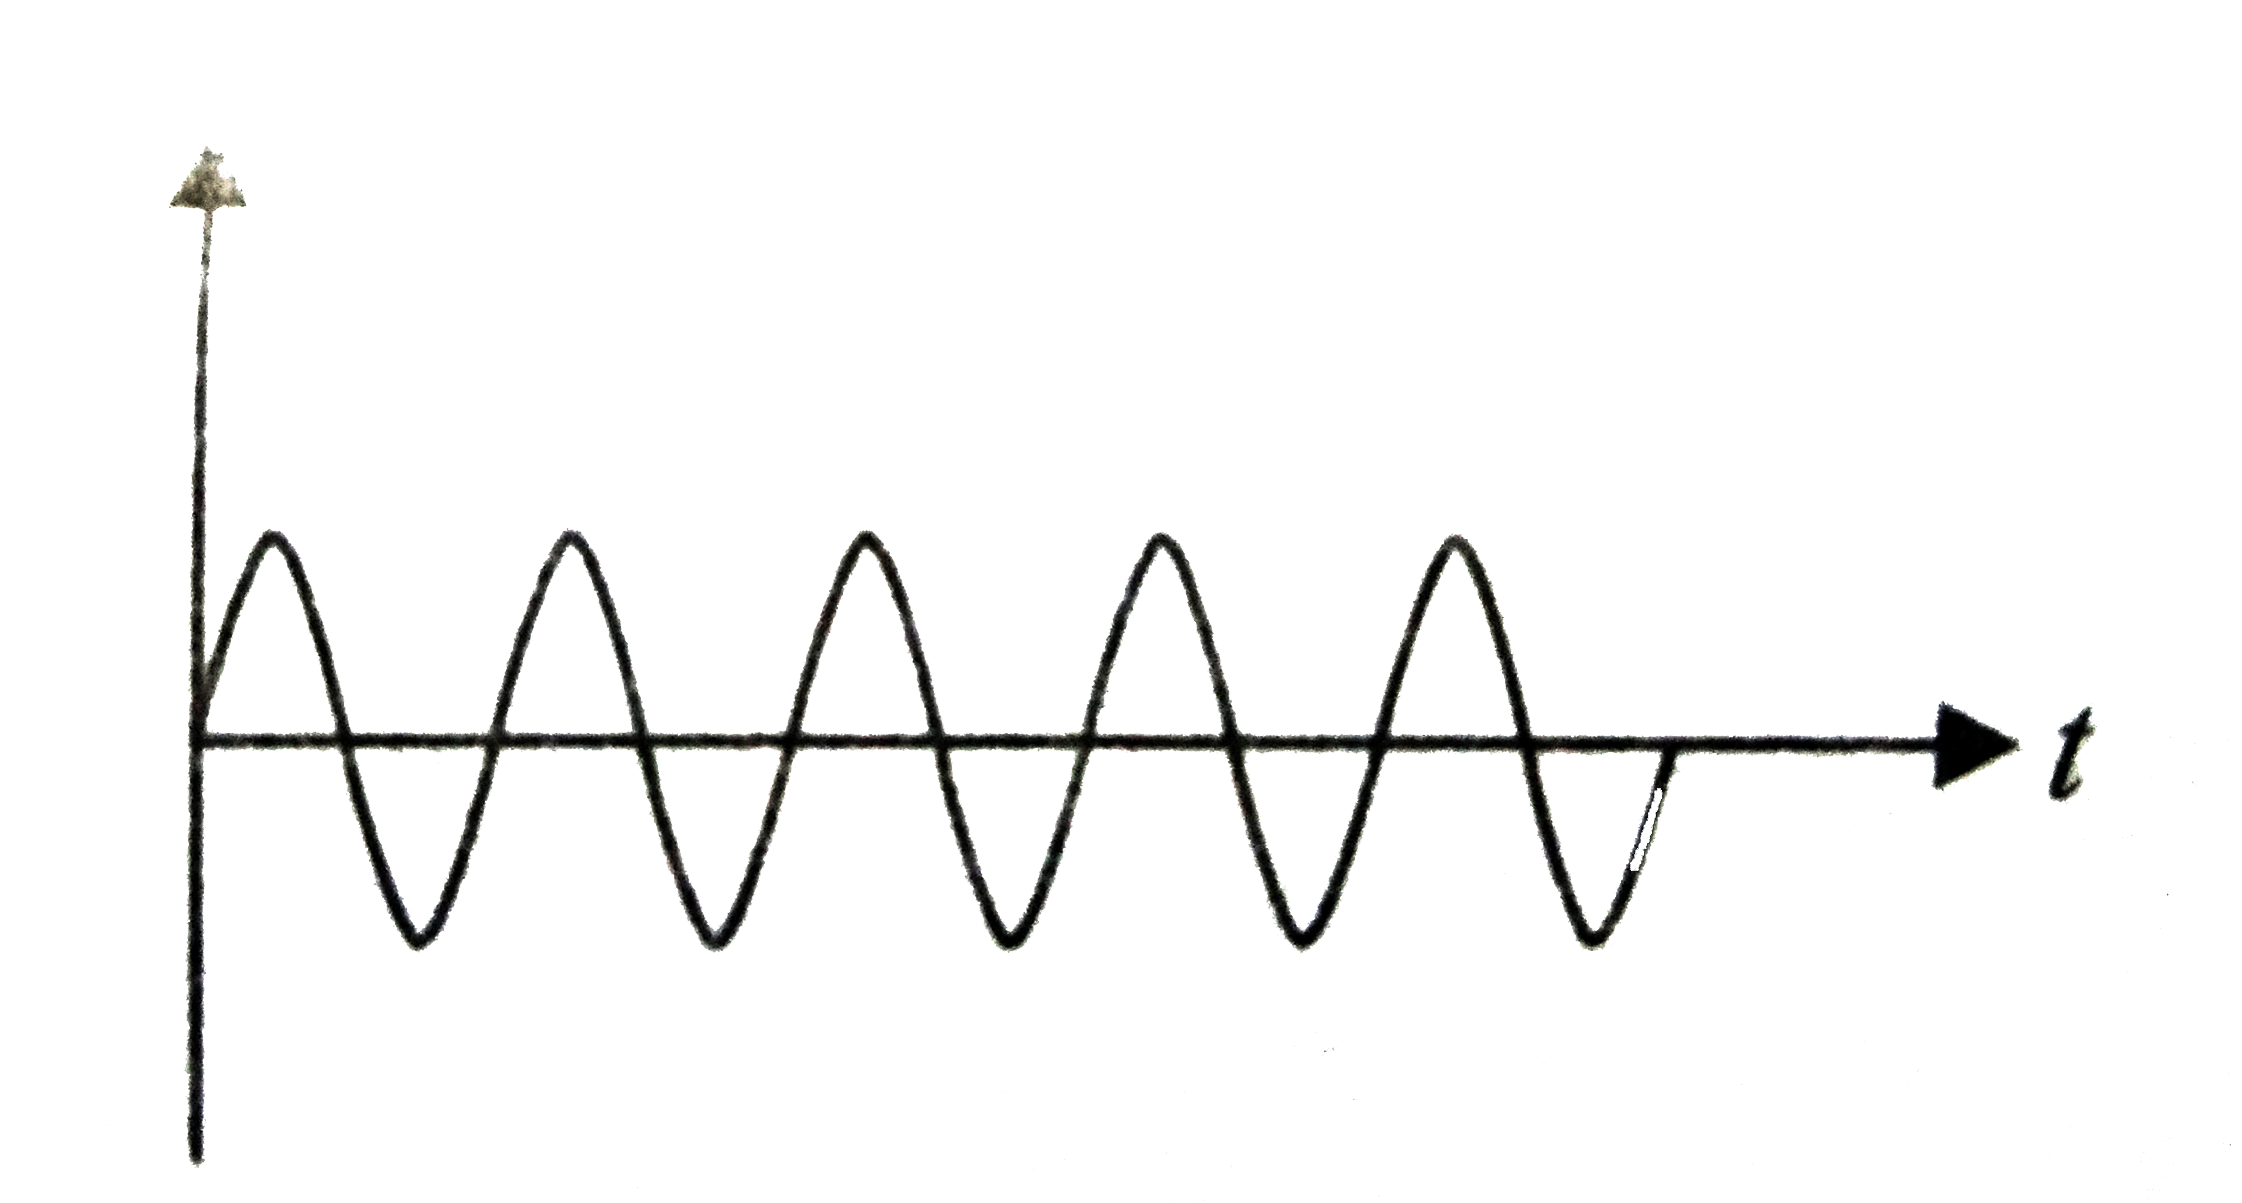 B
B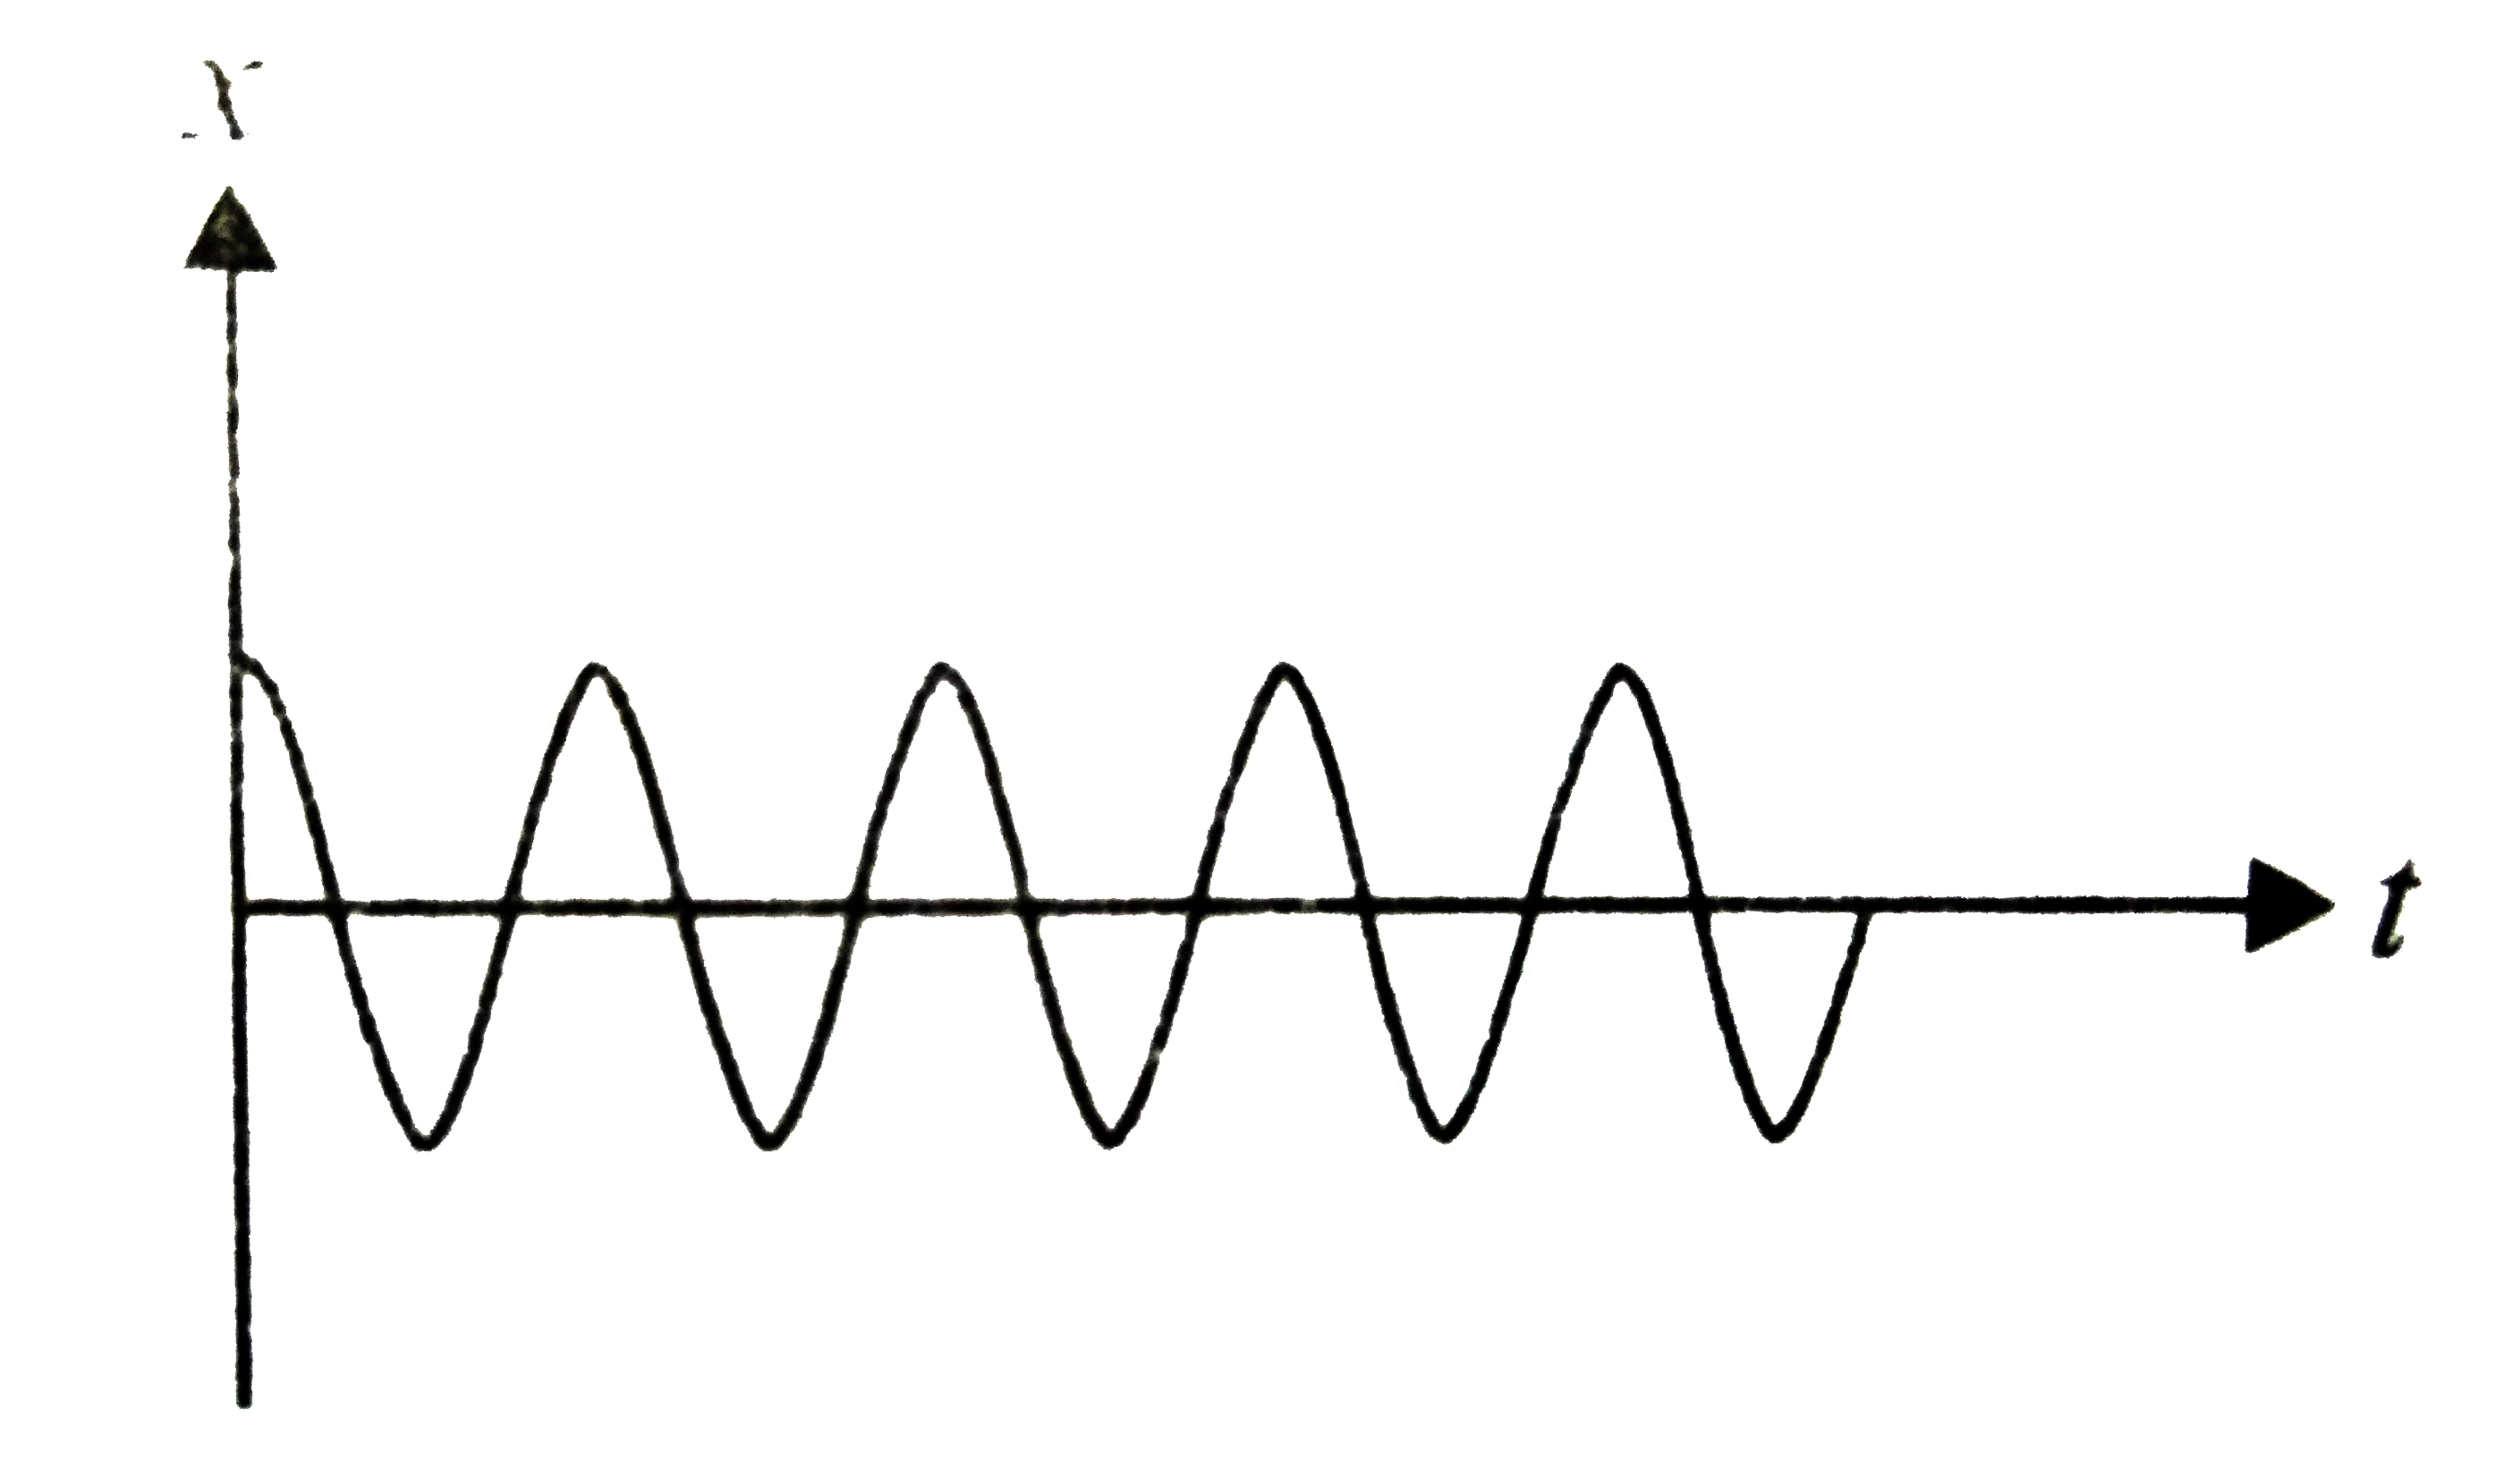 C
C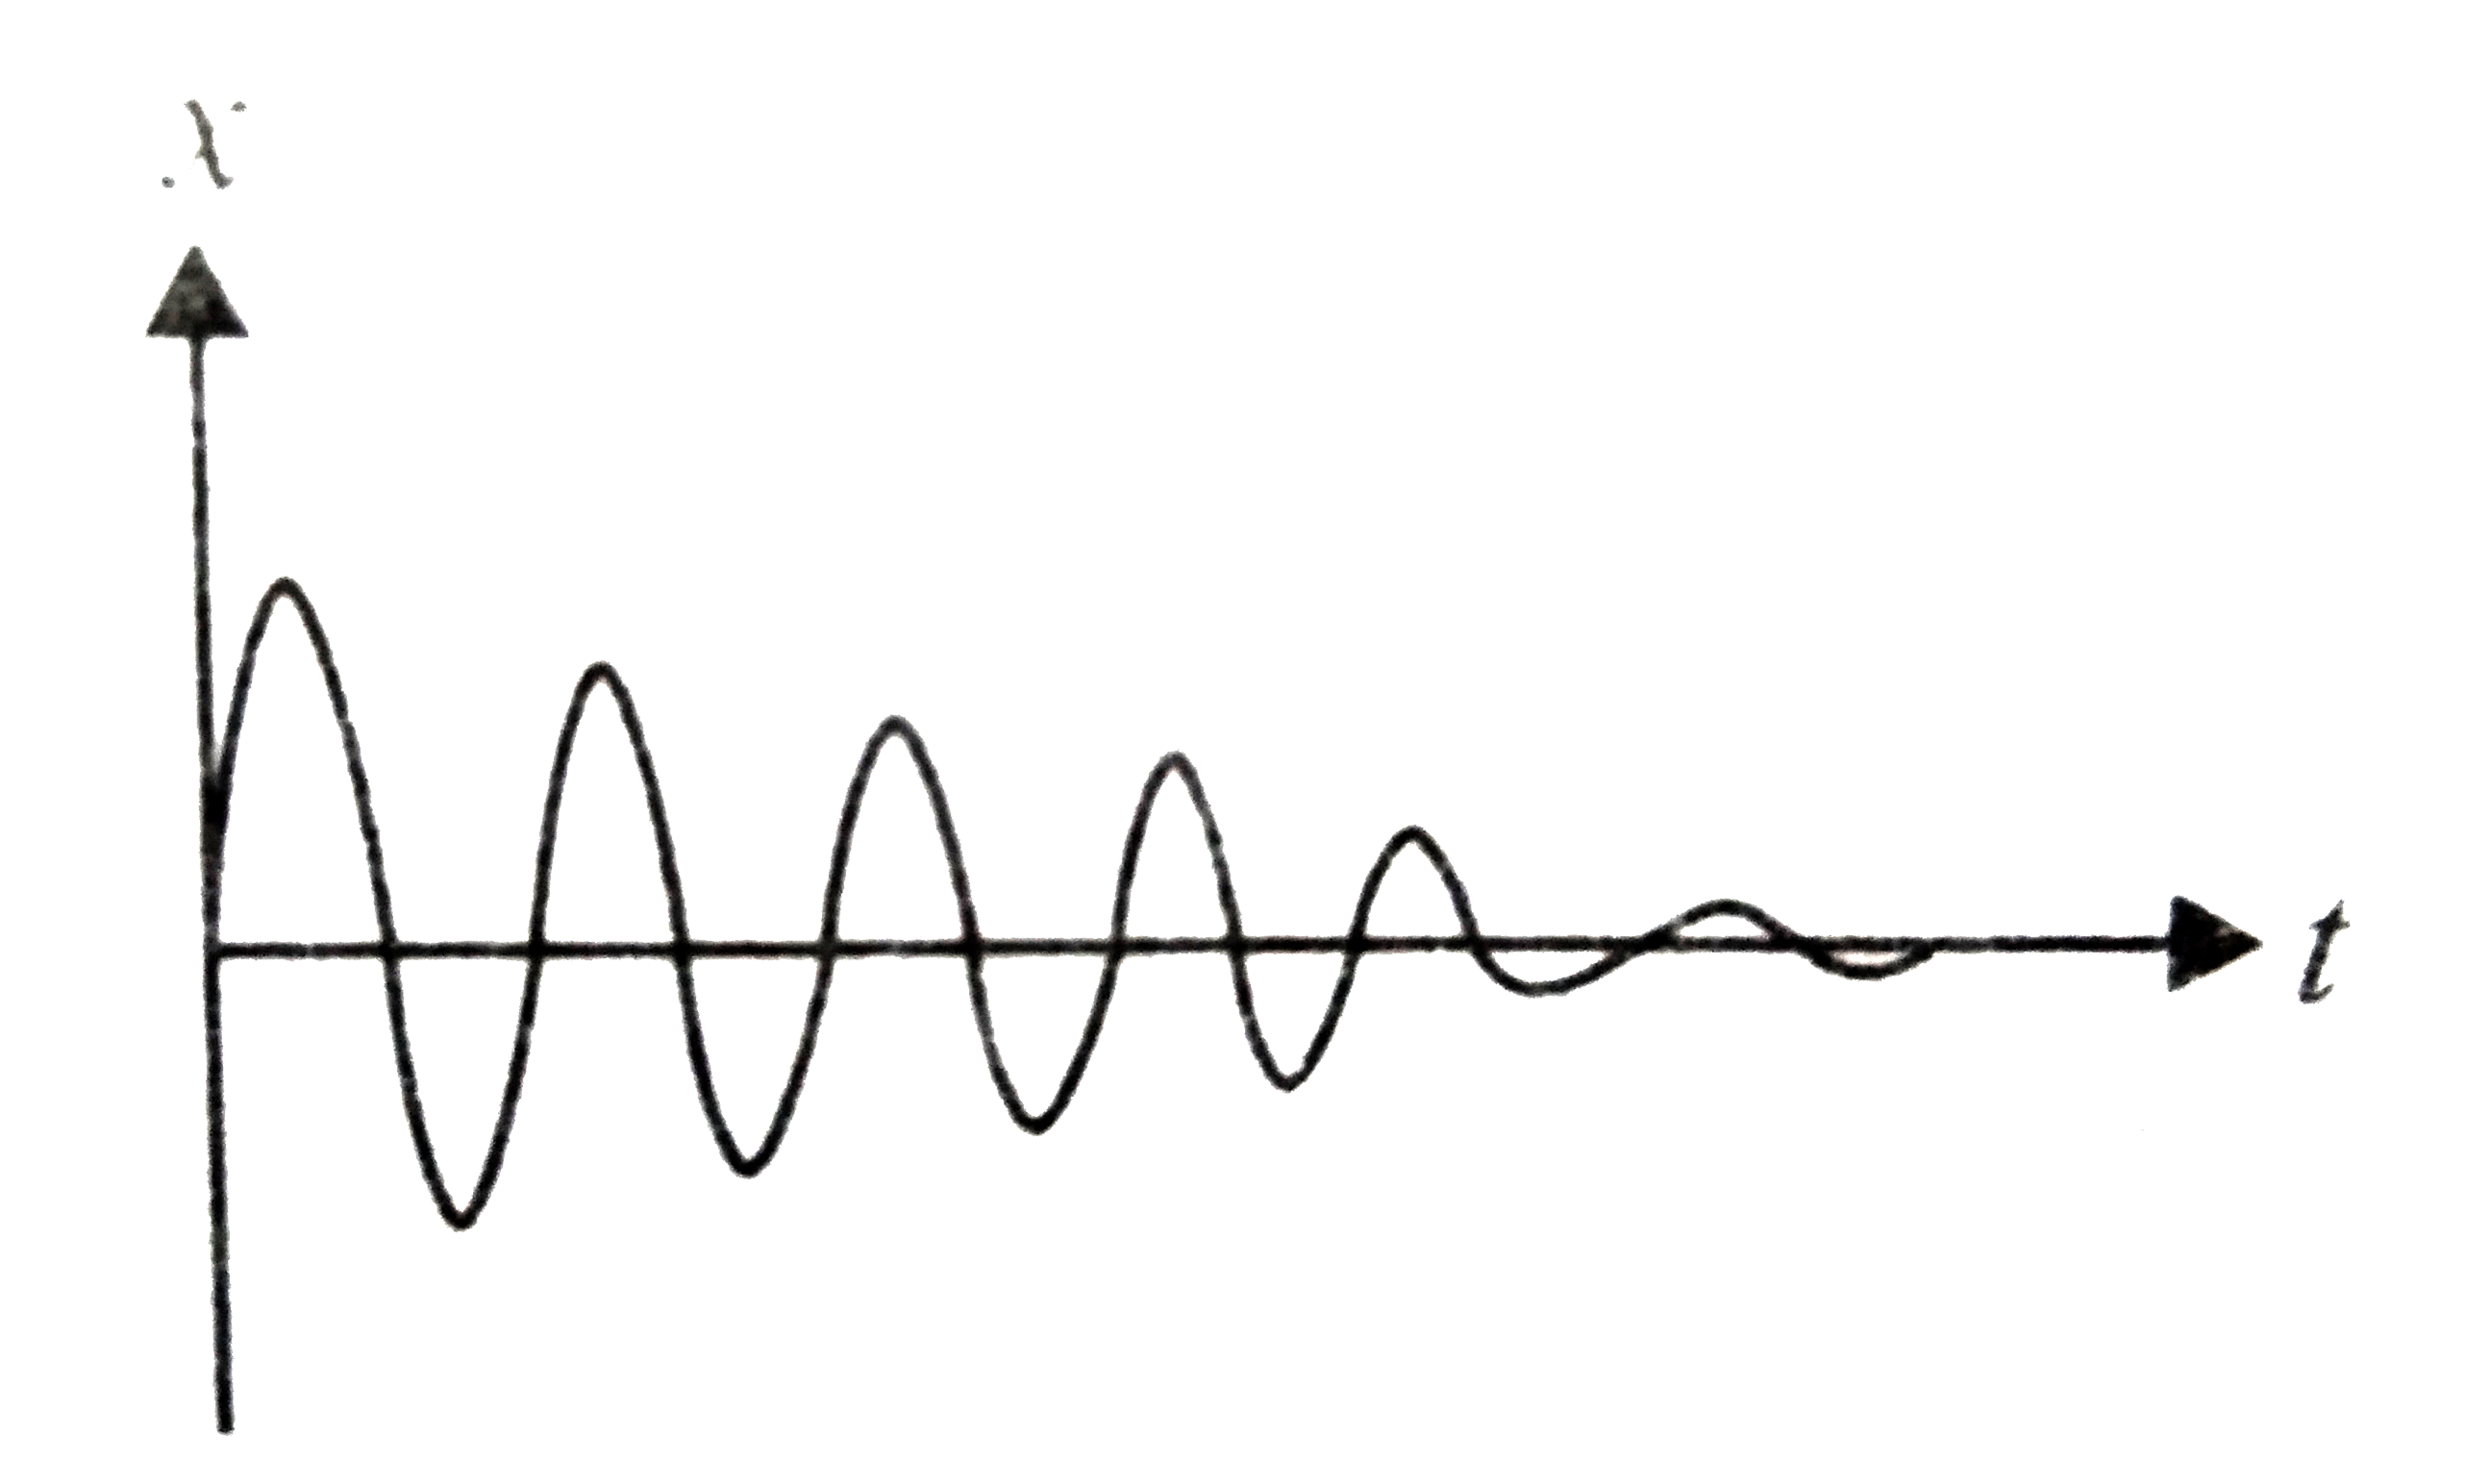 D
D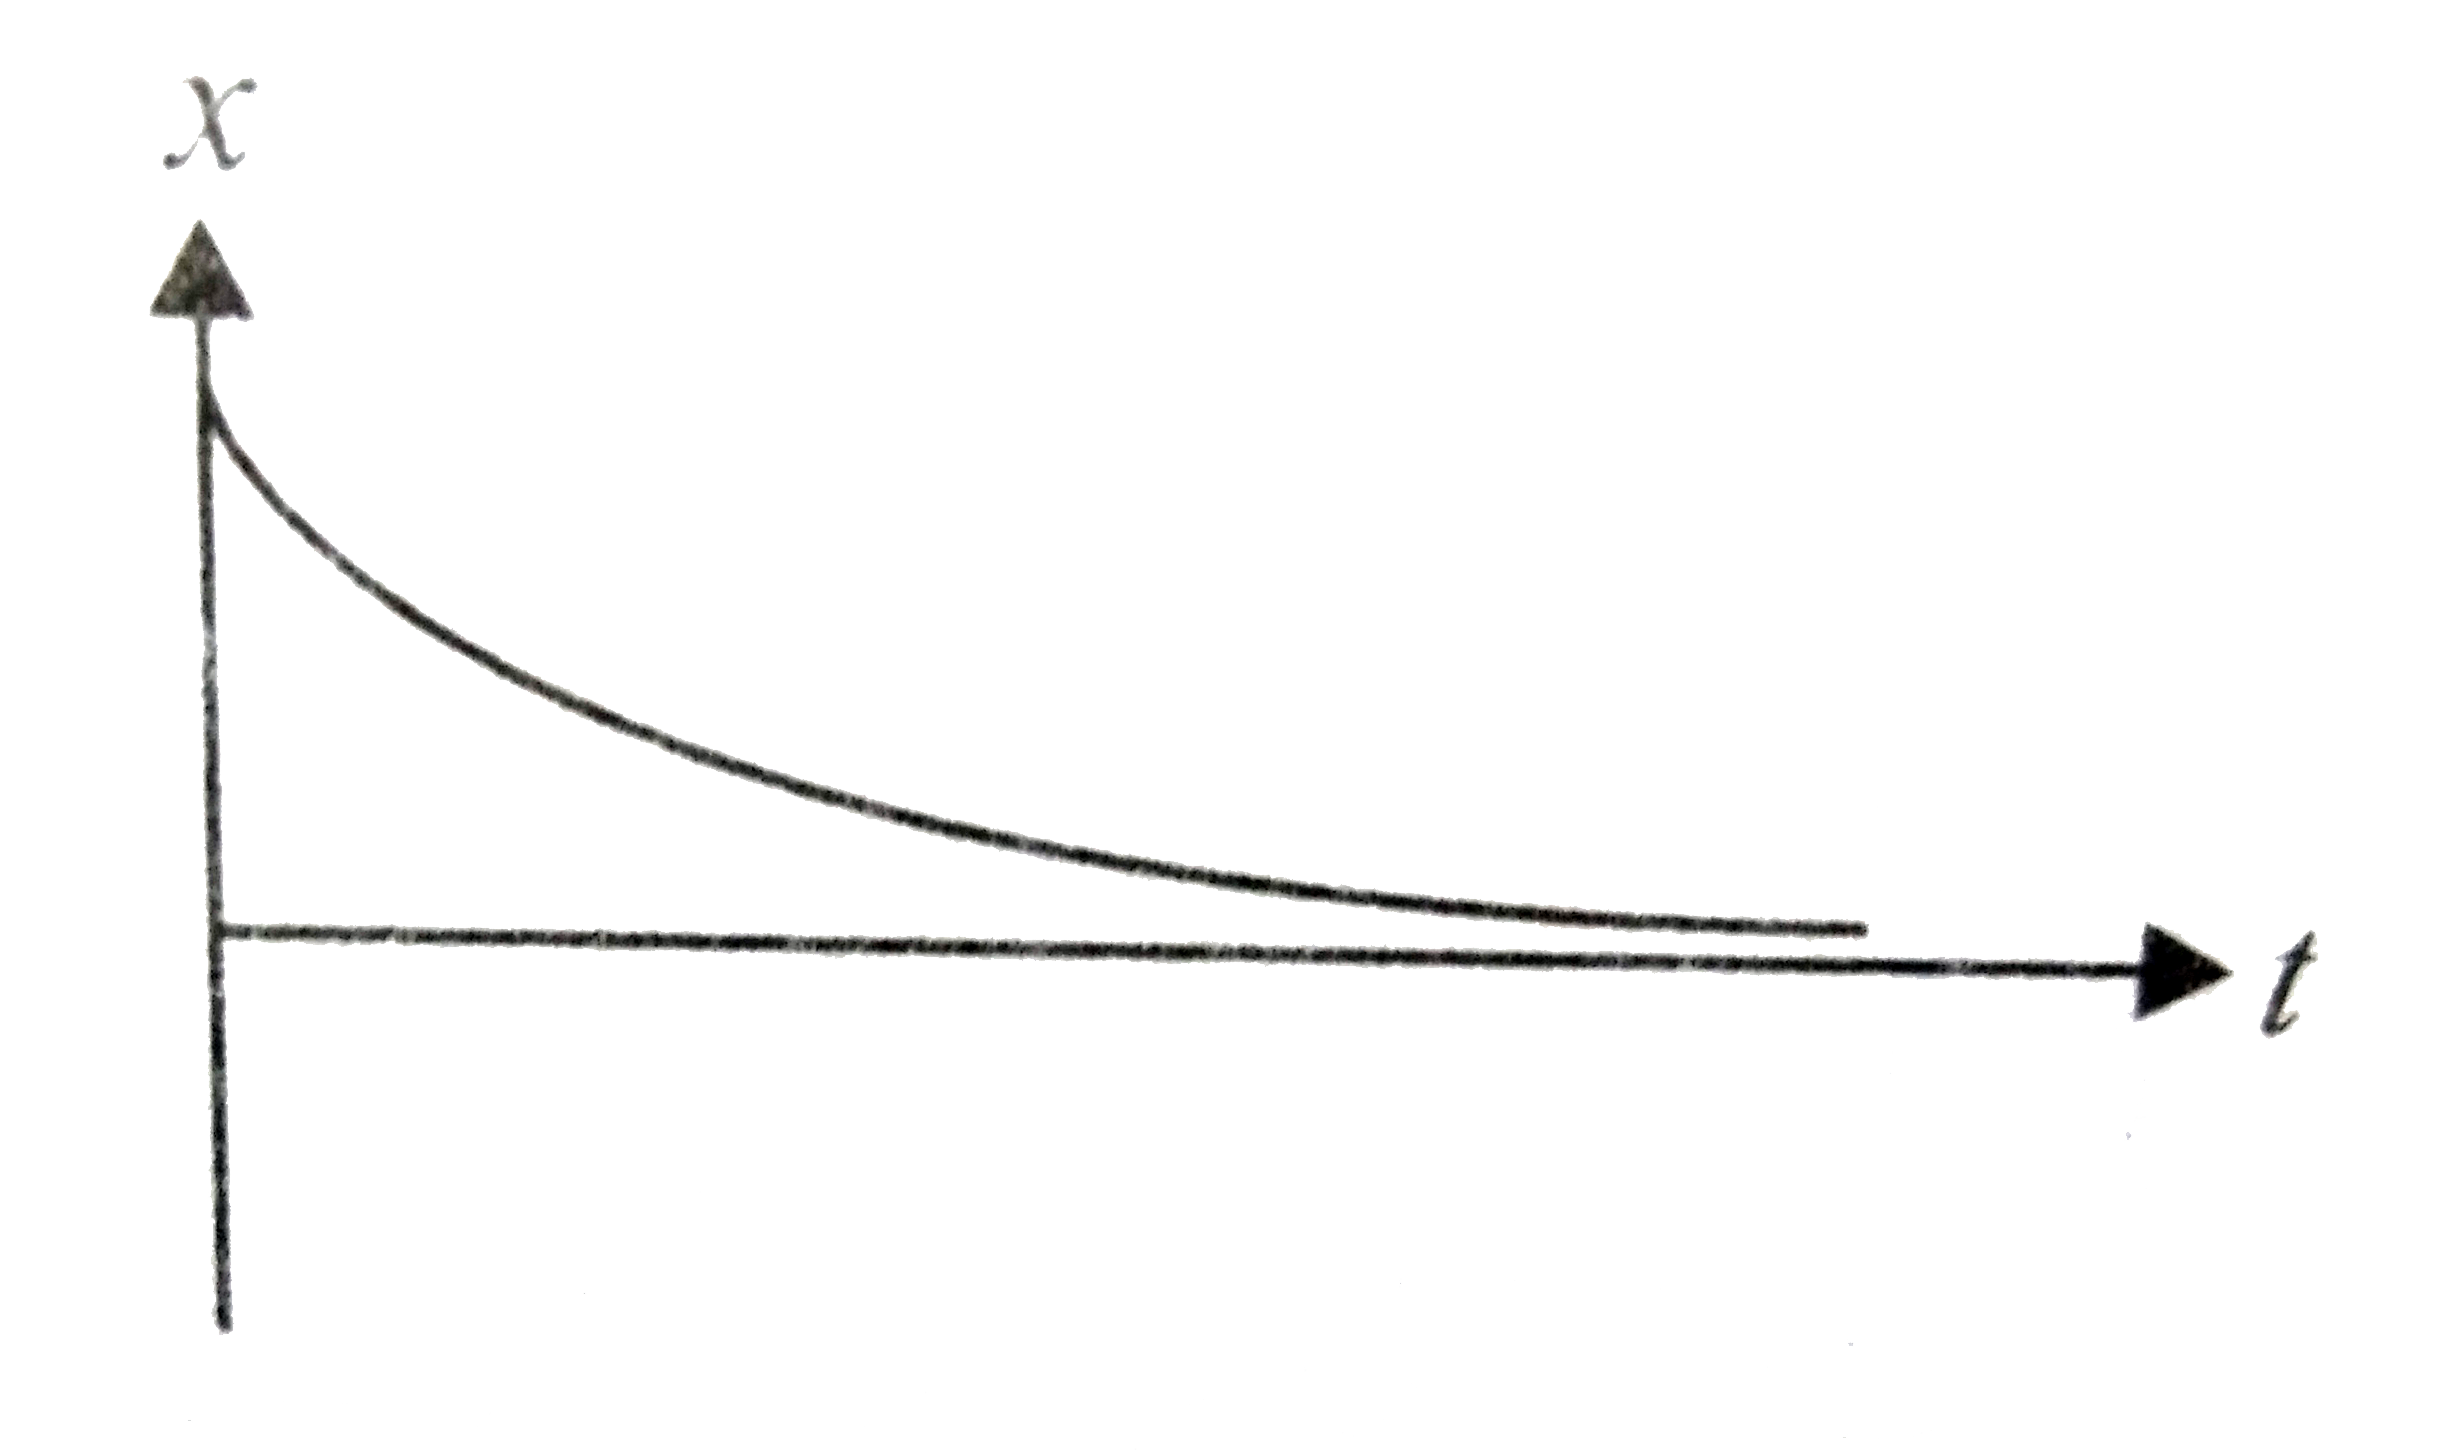
Which of the following displacement-time graphs represent damped harmonic oscillation?
View SolutionWhich of the following functionss represents a simple harmonic oscillation ?
View SolutionWhich of the following figure represents damped harmonic motion
View SolutionWhich of the following figure represents damped harmonic motion
View SolutionWhich of the following equation represents damped oscillation?
View Solution
