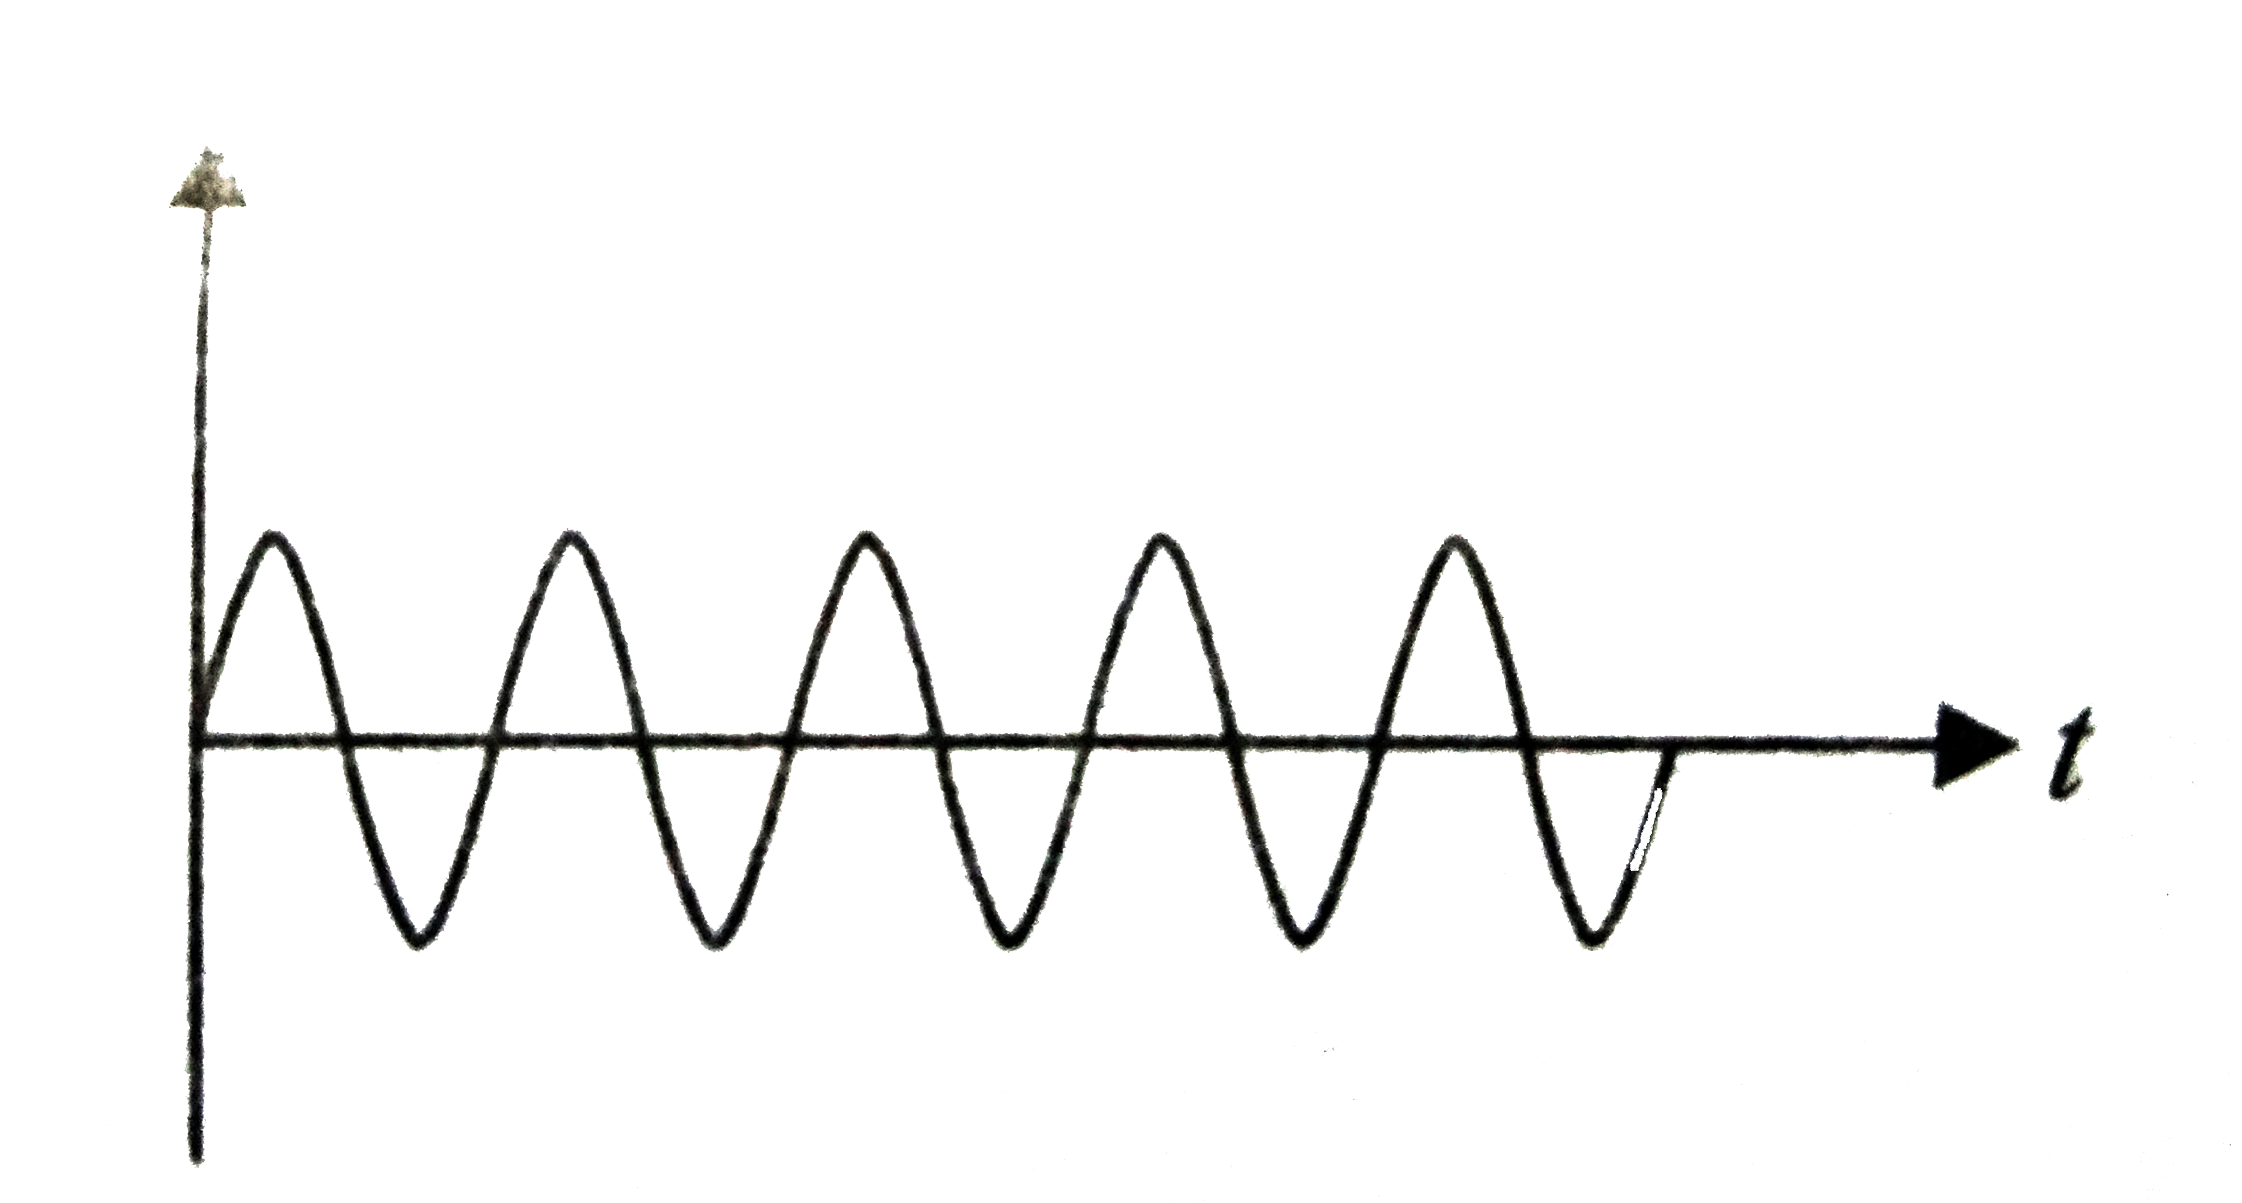
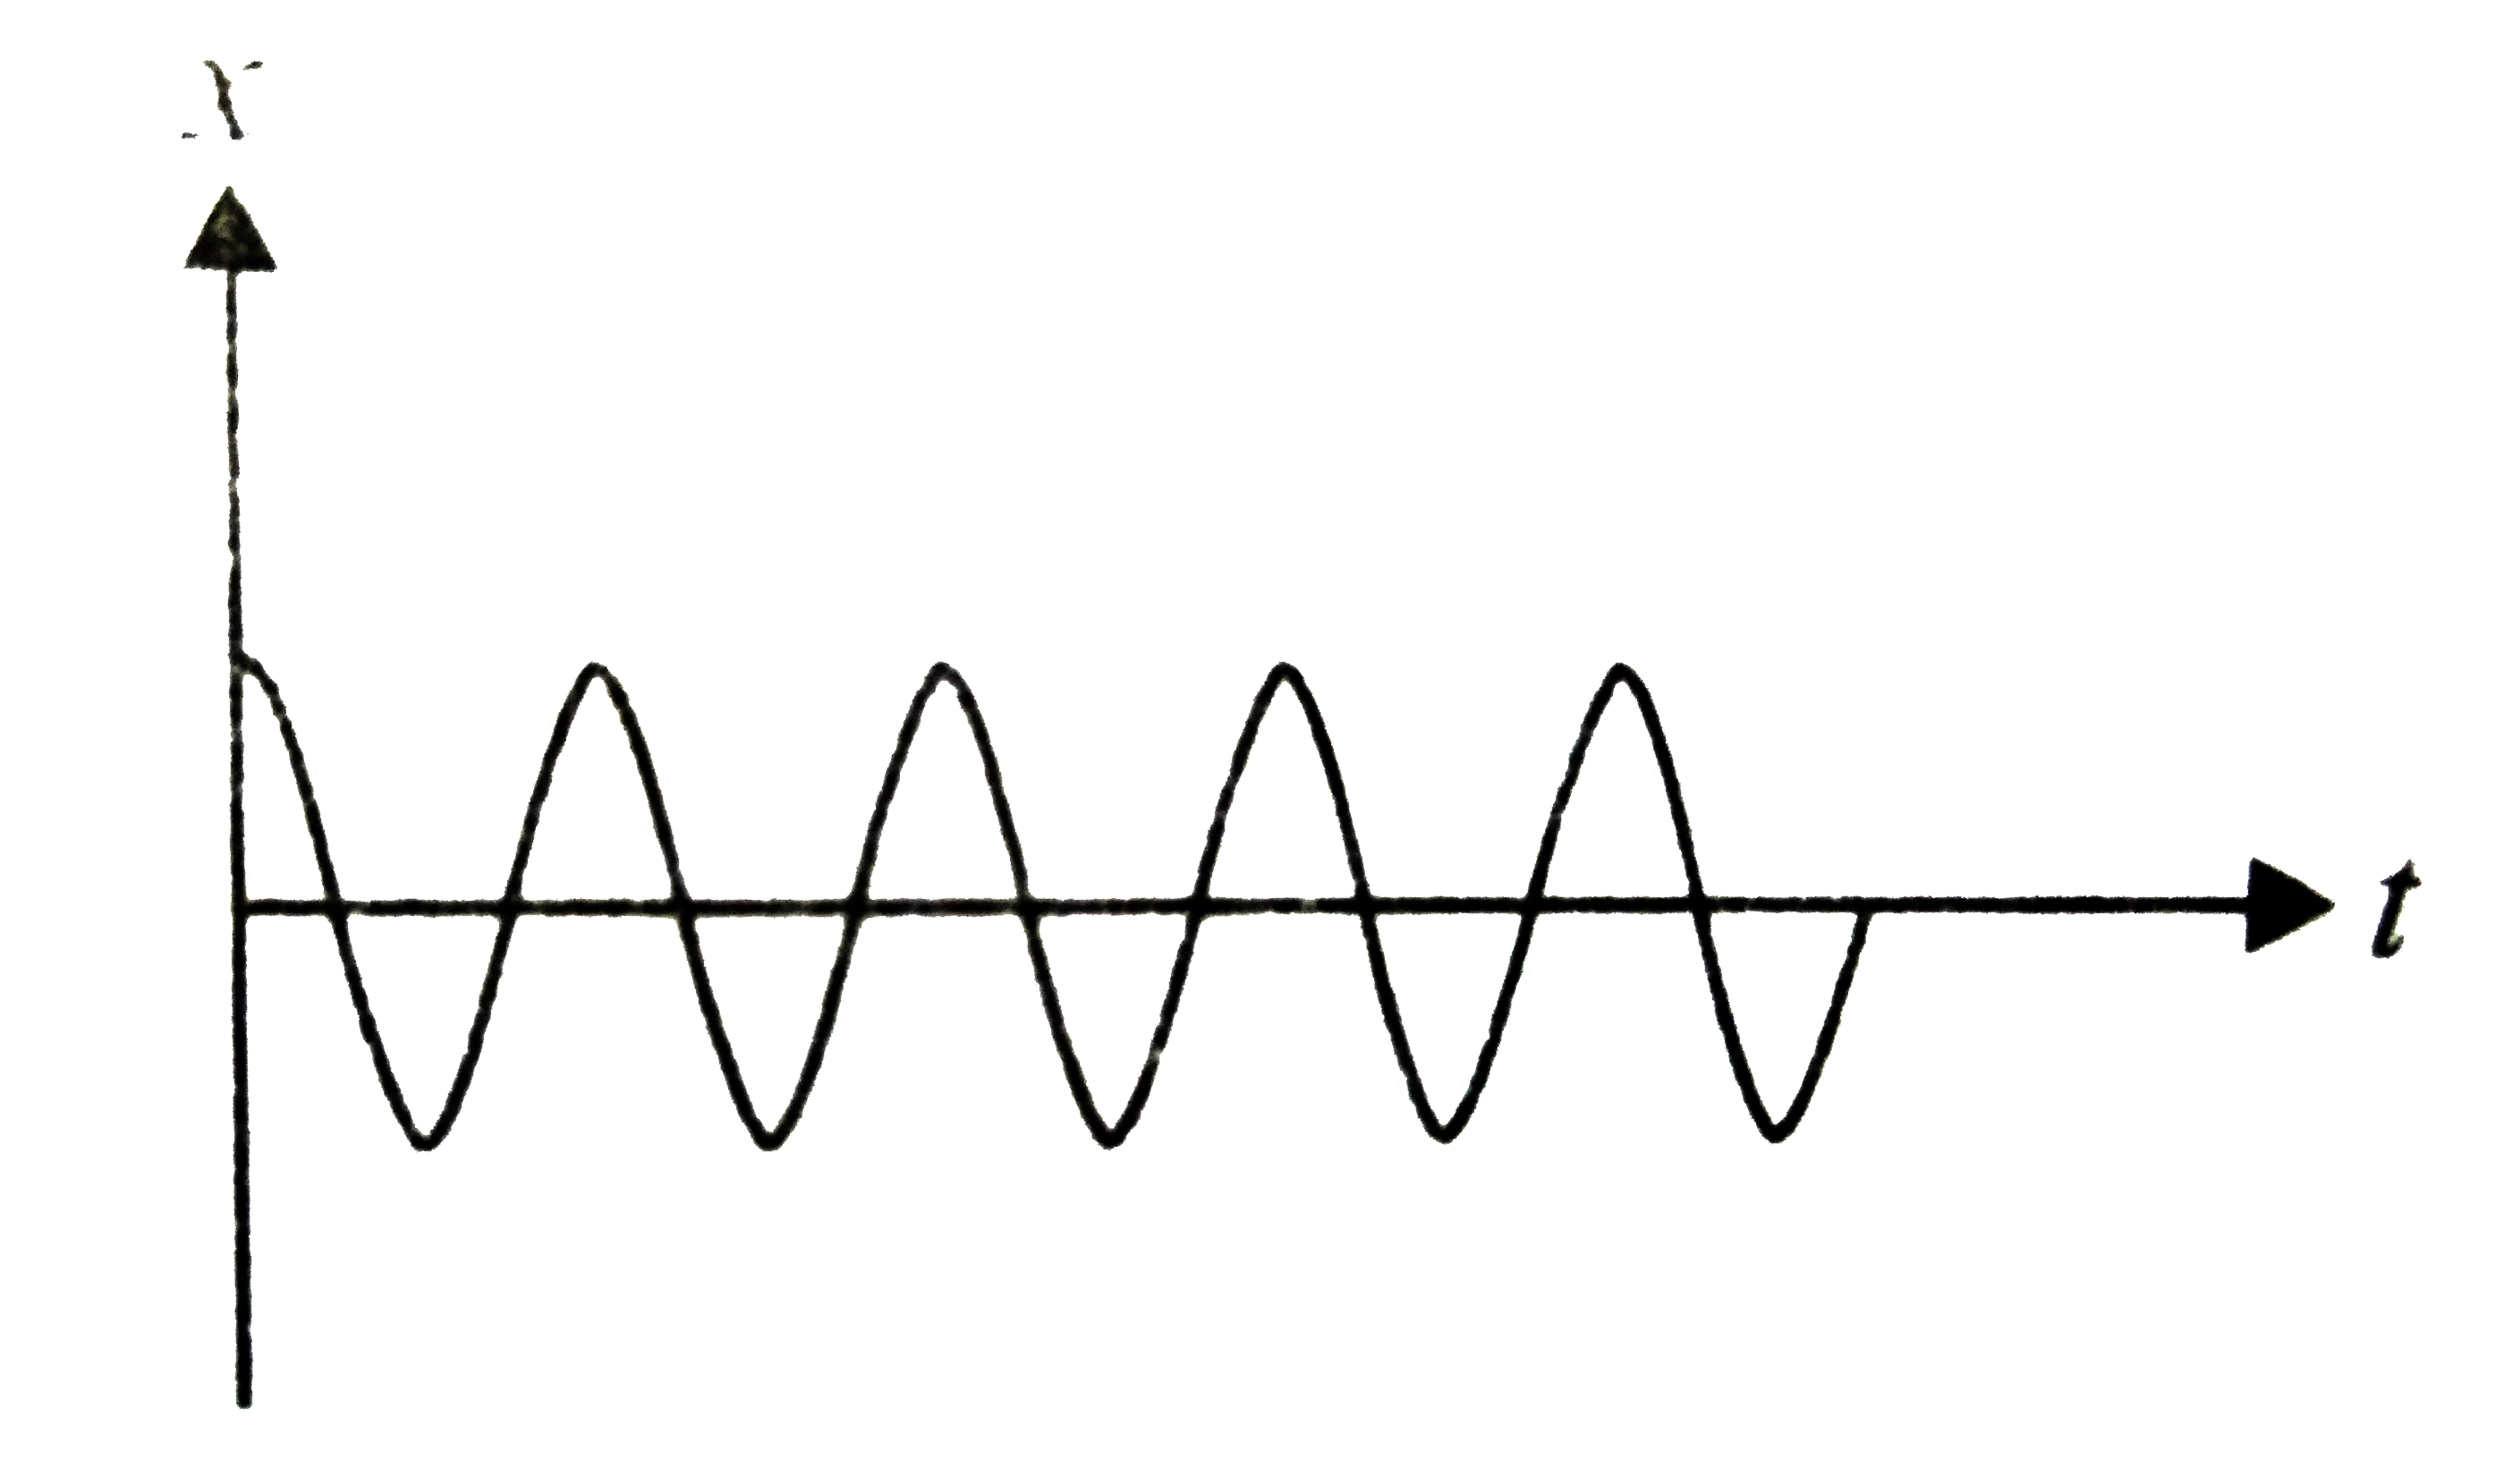
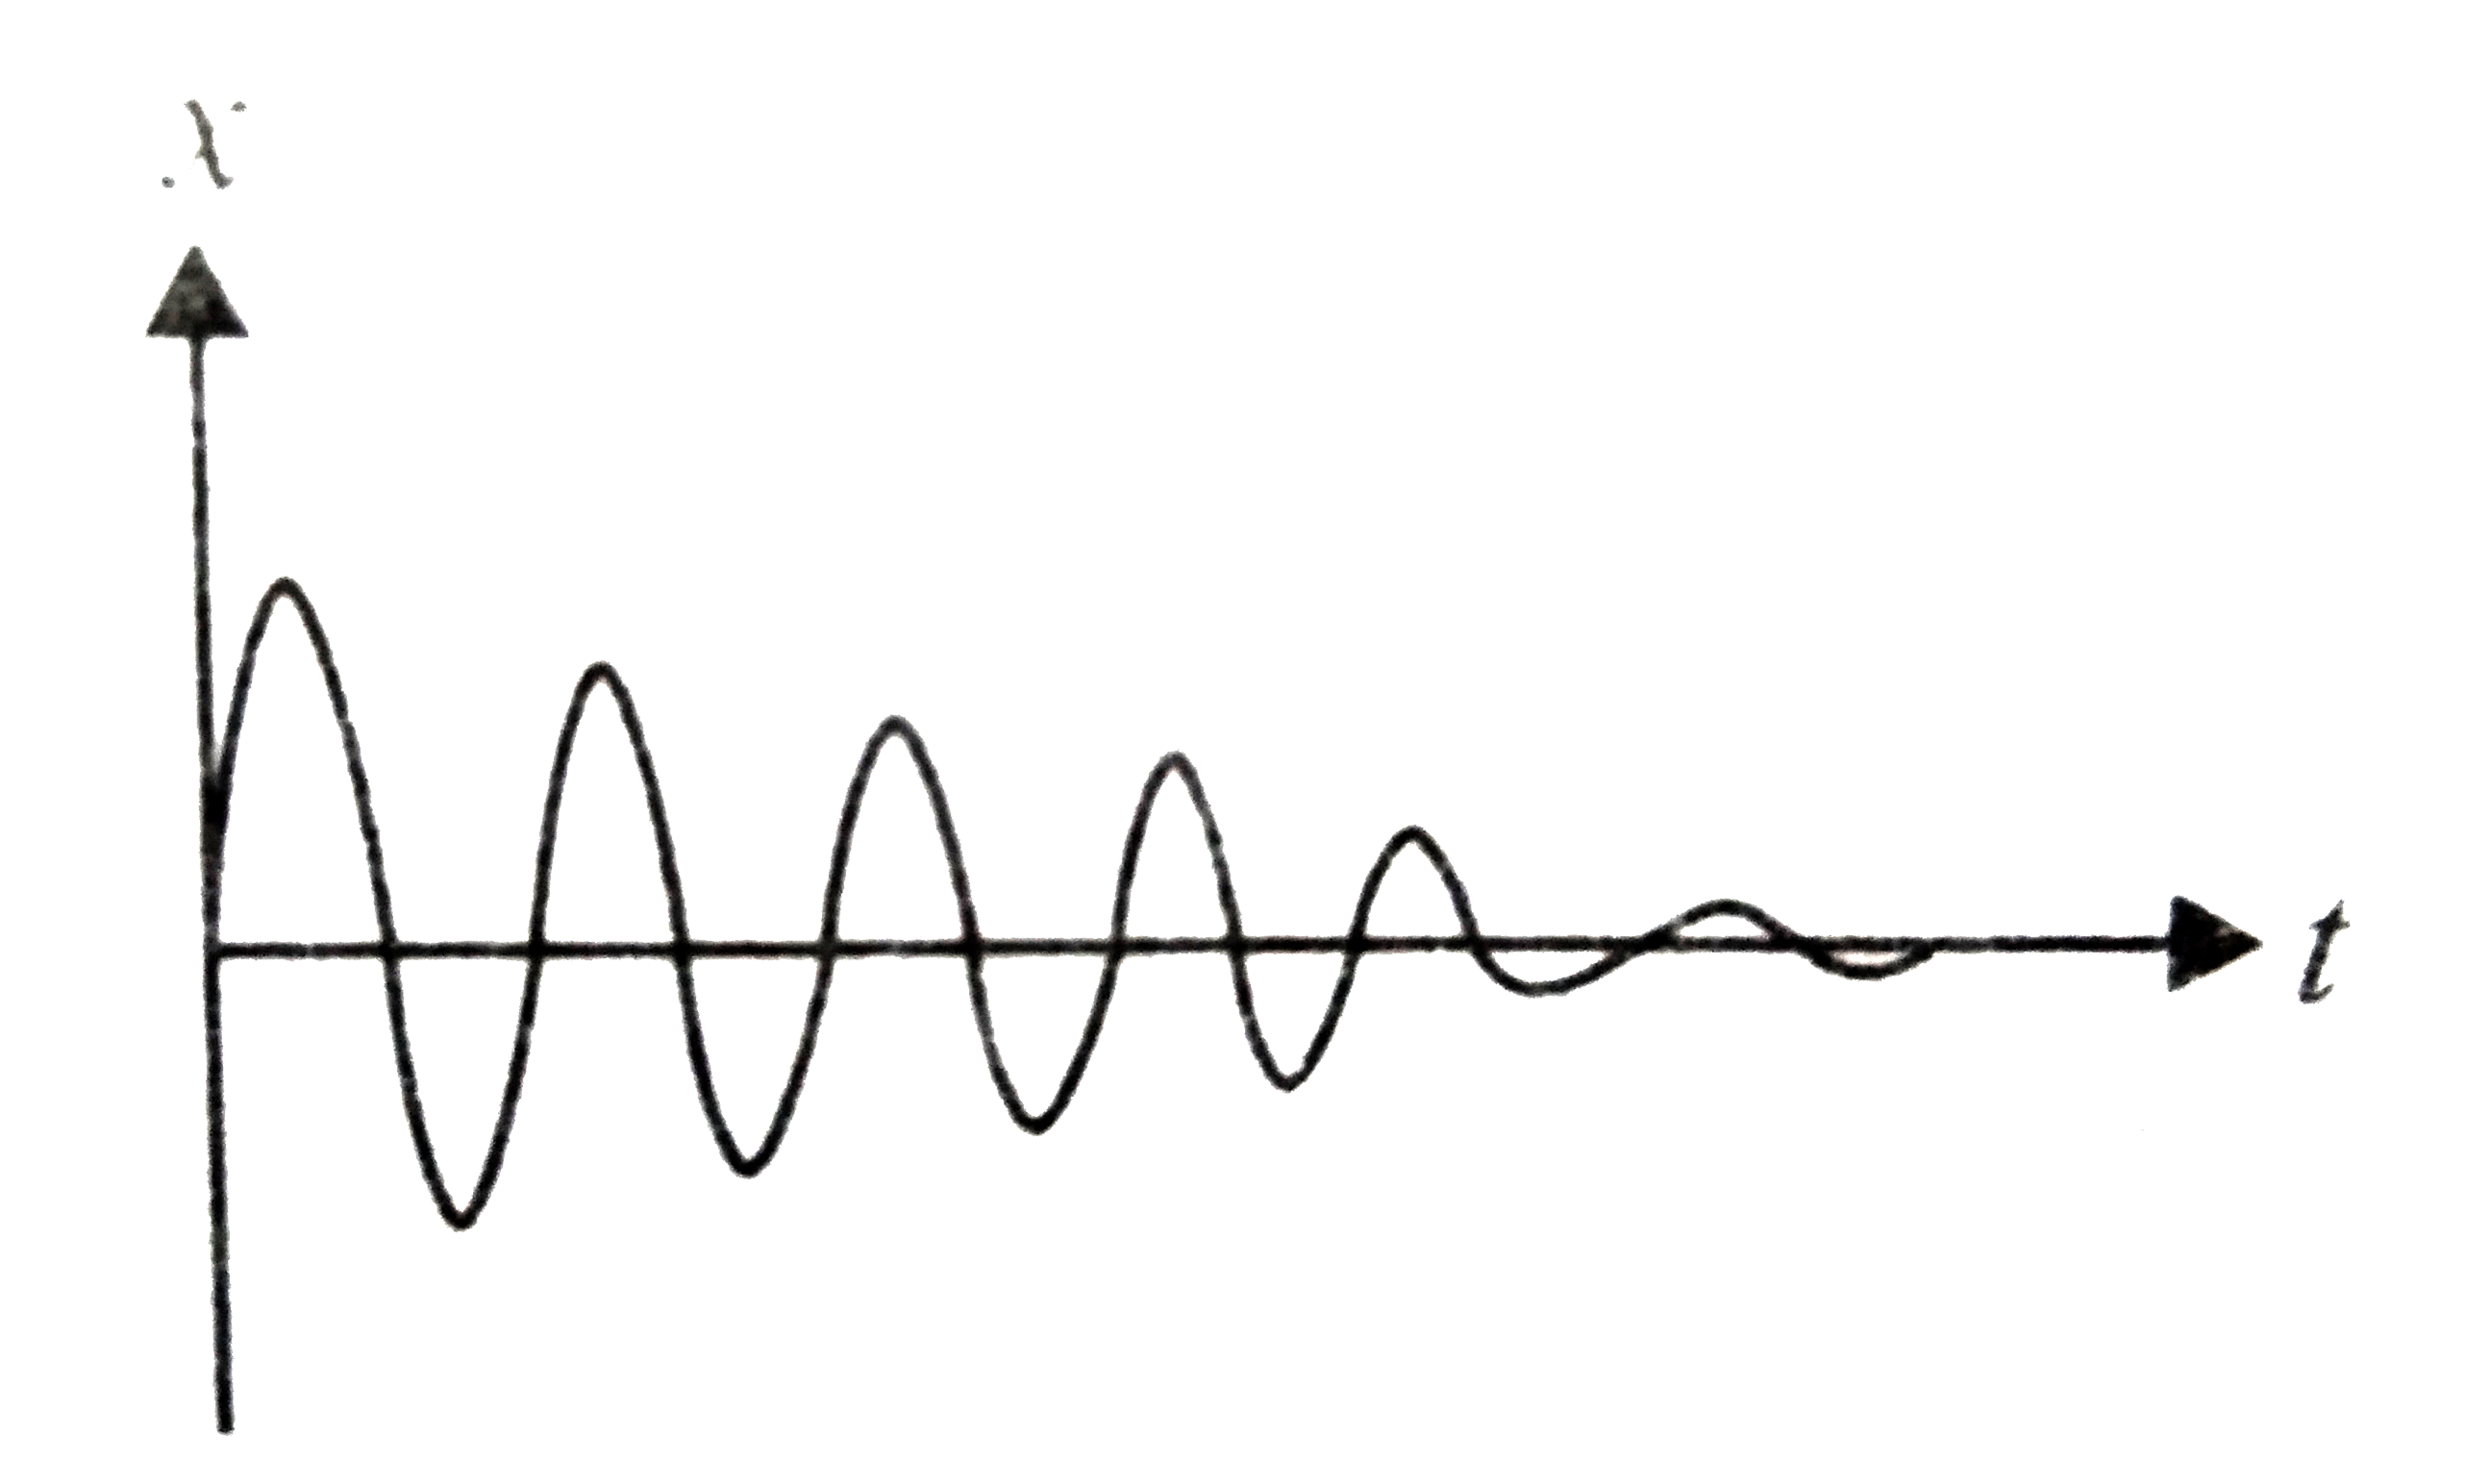
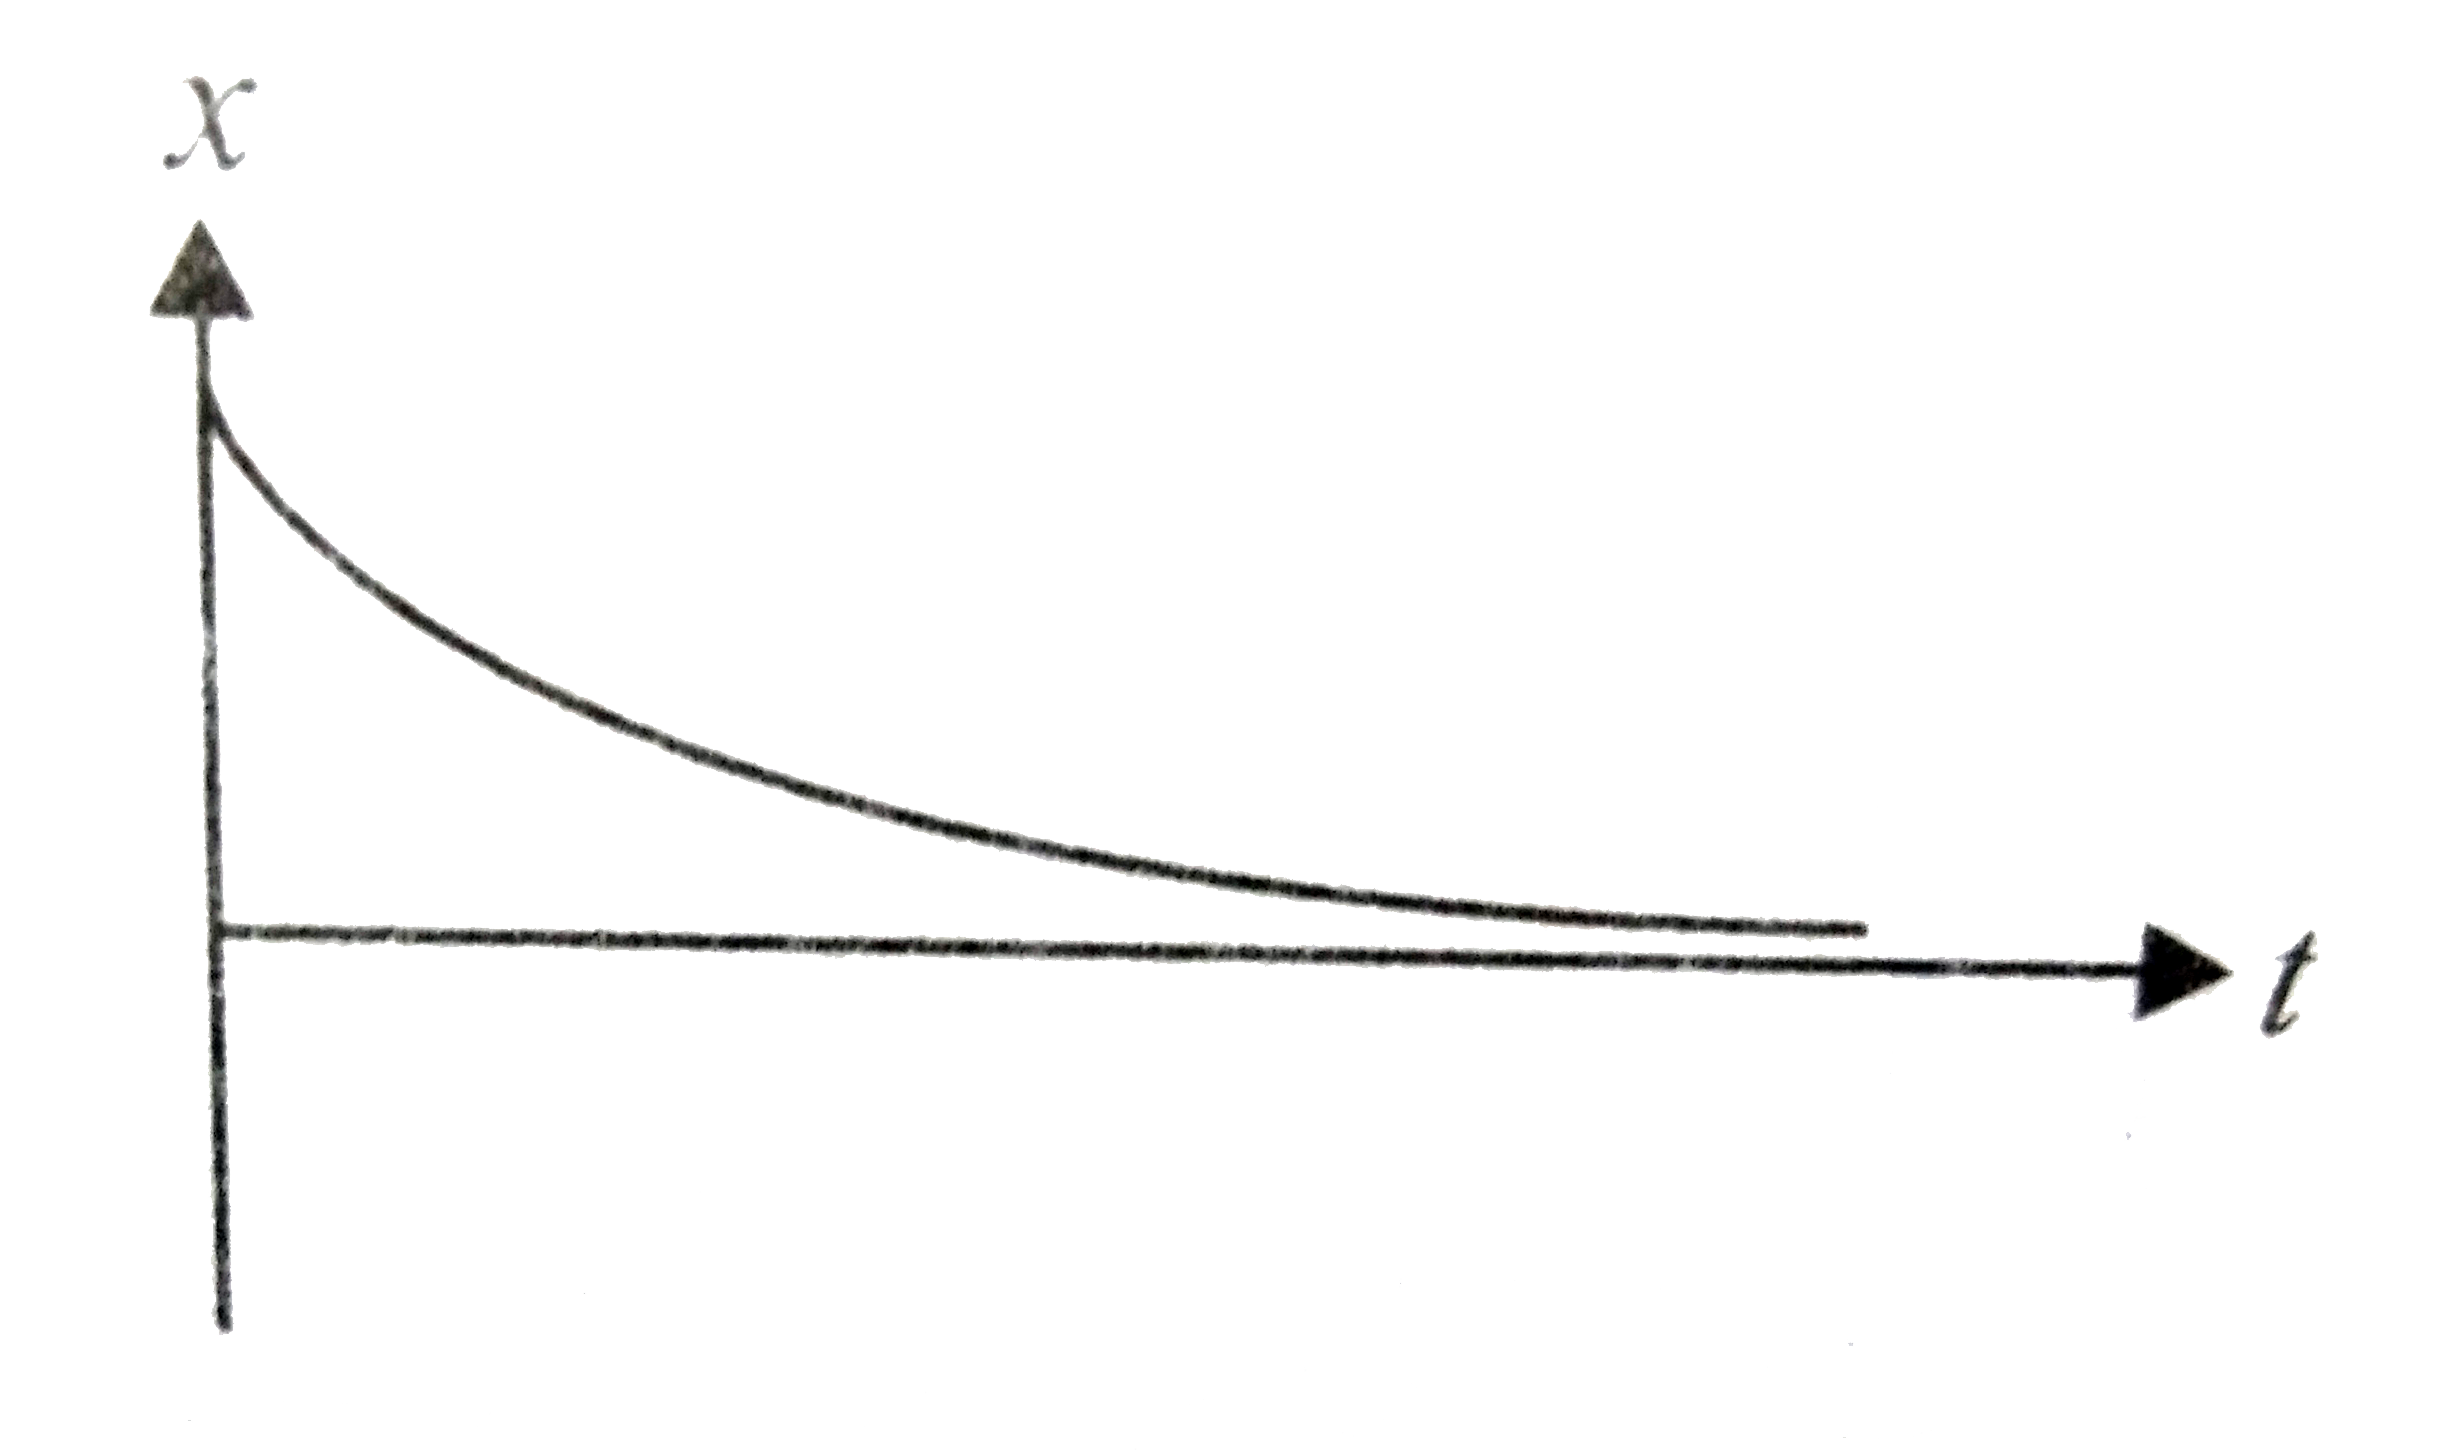
Which of the following displacement-time graphs represent damped harmonic oscillation?
The correct Answer is:C
To determine which displacement-time graph represents damped harmonic oscillation, we need to analyze the characteristics of damped harmonic motion.
1. Understanding Damped Harmonic Motion:
- Damped harmonic motion occurs when a system oscillates with a decreasing amplitude over time due to the presence of a damping force (like friction or air resistance).
- The general equation for the displacement x(t) of a damped harmonic oscillator is given by:
x(t)=x0e−b2mtcos(ωdt+ϕ)
- Here, x0 is the initial amplitude, b is the damping coefficient, m is the mass, and ωd is the damped angular frequency.
2. Identifying the Characteristics of the Graph:
- The key feature of a damped harmonic oscillator is that the amplitude of oscillation decreases exponentially over time.
- This means that if we were to plot the displacement x against time t, the peaks of the oscillations would get closer to the time axis as time progresses, indicating a decrease in amplitude.
3. Analyzing the Given Graphs:
- We need to look at the provided graphs and identify which one shows a clear exponential decay in amplitude.
- The correct graph should show oscillations that gradually decrease in height (amplitude) over time, rather than remaining constant or increasing.
4. Selecting the Correct Graph:
- After analyzing the provided graphs, we find that Option C shows the characteristic of damped harmonic motion, where the oscillations decrease in amplitude exponentially.
Conclusion:
Thus, the displacement-time graph that represents damped harmonic oscillation is Option C.
---
- Damped harmonic motion occurs when a system oscillates with a decreasing amplitude over time due to the presence of a damping force (like friction or air resistance).
- The general equation for the displacement x(t) of a damped harmonic oscillator is given by:
x(t)=x0e−b2mtcos(ωdt+ϕ)
- Here, x0 is the initial amplitude, b is the damping coefficient, m is the mass, and ωd is the damped angular frequency.
- The key feature of a damped harmonic oscillator is that the amplitude of oscillation decreases exponentially over time.
- This means that if we were to plot the displacement x against time t, the peaks of the oscillations would get closer to the time axis as time progresses, indicating a decrease in amplitude.
- We need to look at the provided graphs and identify which one shows a clear exponential decay in amplitude.
- The correct graph should show oscillations that gradually decrease in height (amplitude) over time, rather than remaining constant or increasing.
- After analyzing the provided graphs, we find that Option C shows the characteristic of damped harmonic motion, where the oscillations decrease in amplitude exponentially.
Thus, the displacement-time graph that represents damped harmonic oscillation is Option C.
Topper's Solved these Questions
- OSCILLATIONS BOOK - NCERT FINGERTPS ENGLISHCHAPTER - OSCILLATIONS EXERCISE - Higher Order Thinking Skills
8 Videos
- OSCILLATIONS BOOK - NCERT FINGERTPS ENGLISHCHAPTER - OSCILLATIONS EXERCISE - Exemplar Problems
9 Videos
- MOTION IN A STRAIGHT LINEBOOK - NCERT FINGERTPS ENGLISHCHAPTER - MOTION IN A STRAIGHT LINEEXERCISE - NCERT Exemplar
6 Videos
- PHYSICAL WORLDBOOK - NCERT FINGERTPS ENGLISHCHAPTER - PHYSICAL WORLDEXERCISE - Assertion And Reason
10 Videos
Similar Questions
Knowledge Check
Which of the following energy-time graphs represents dajmped harmonic oscillator?
A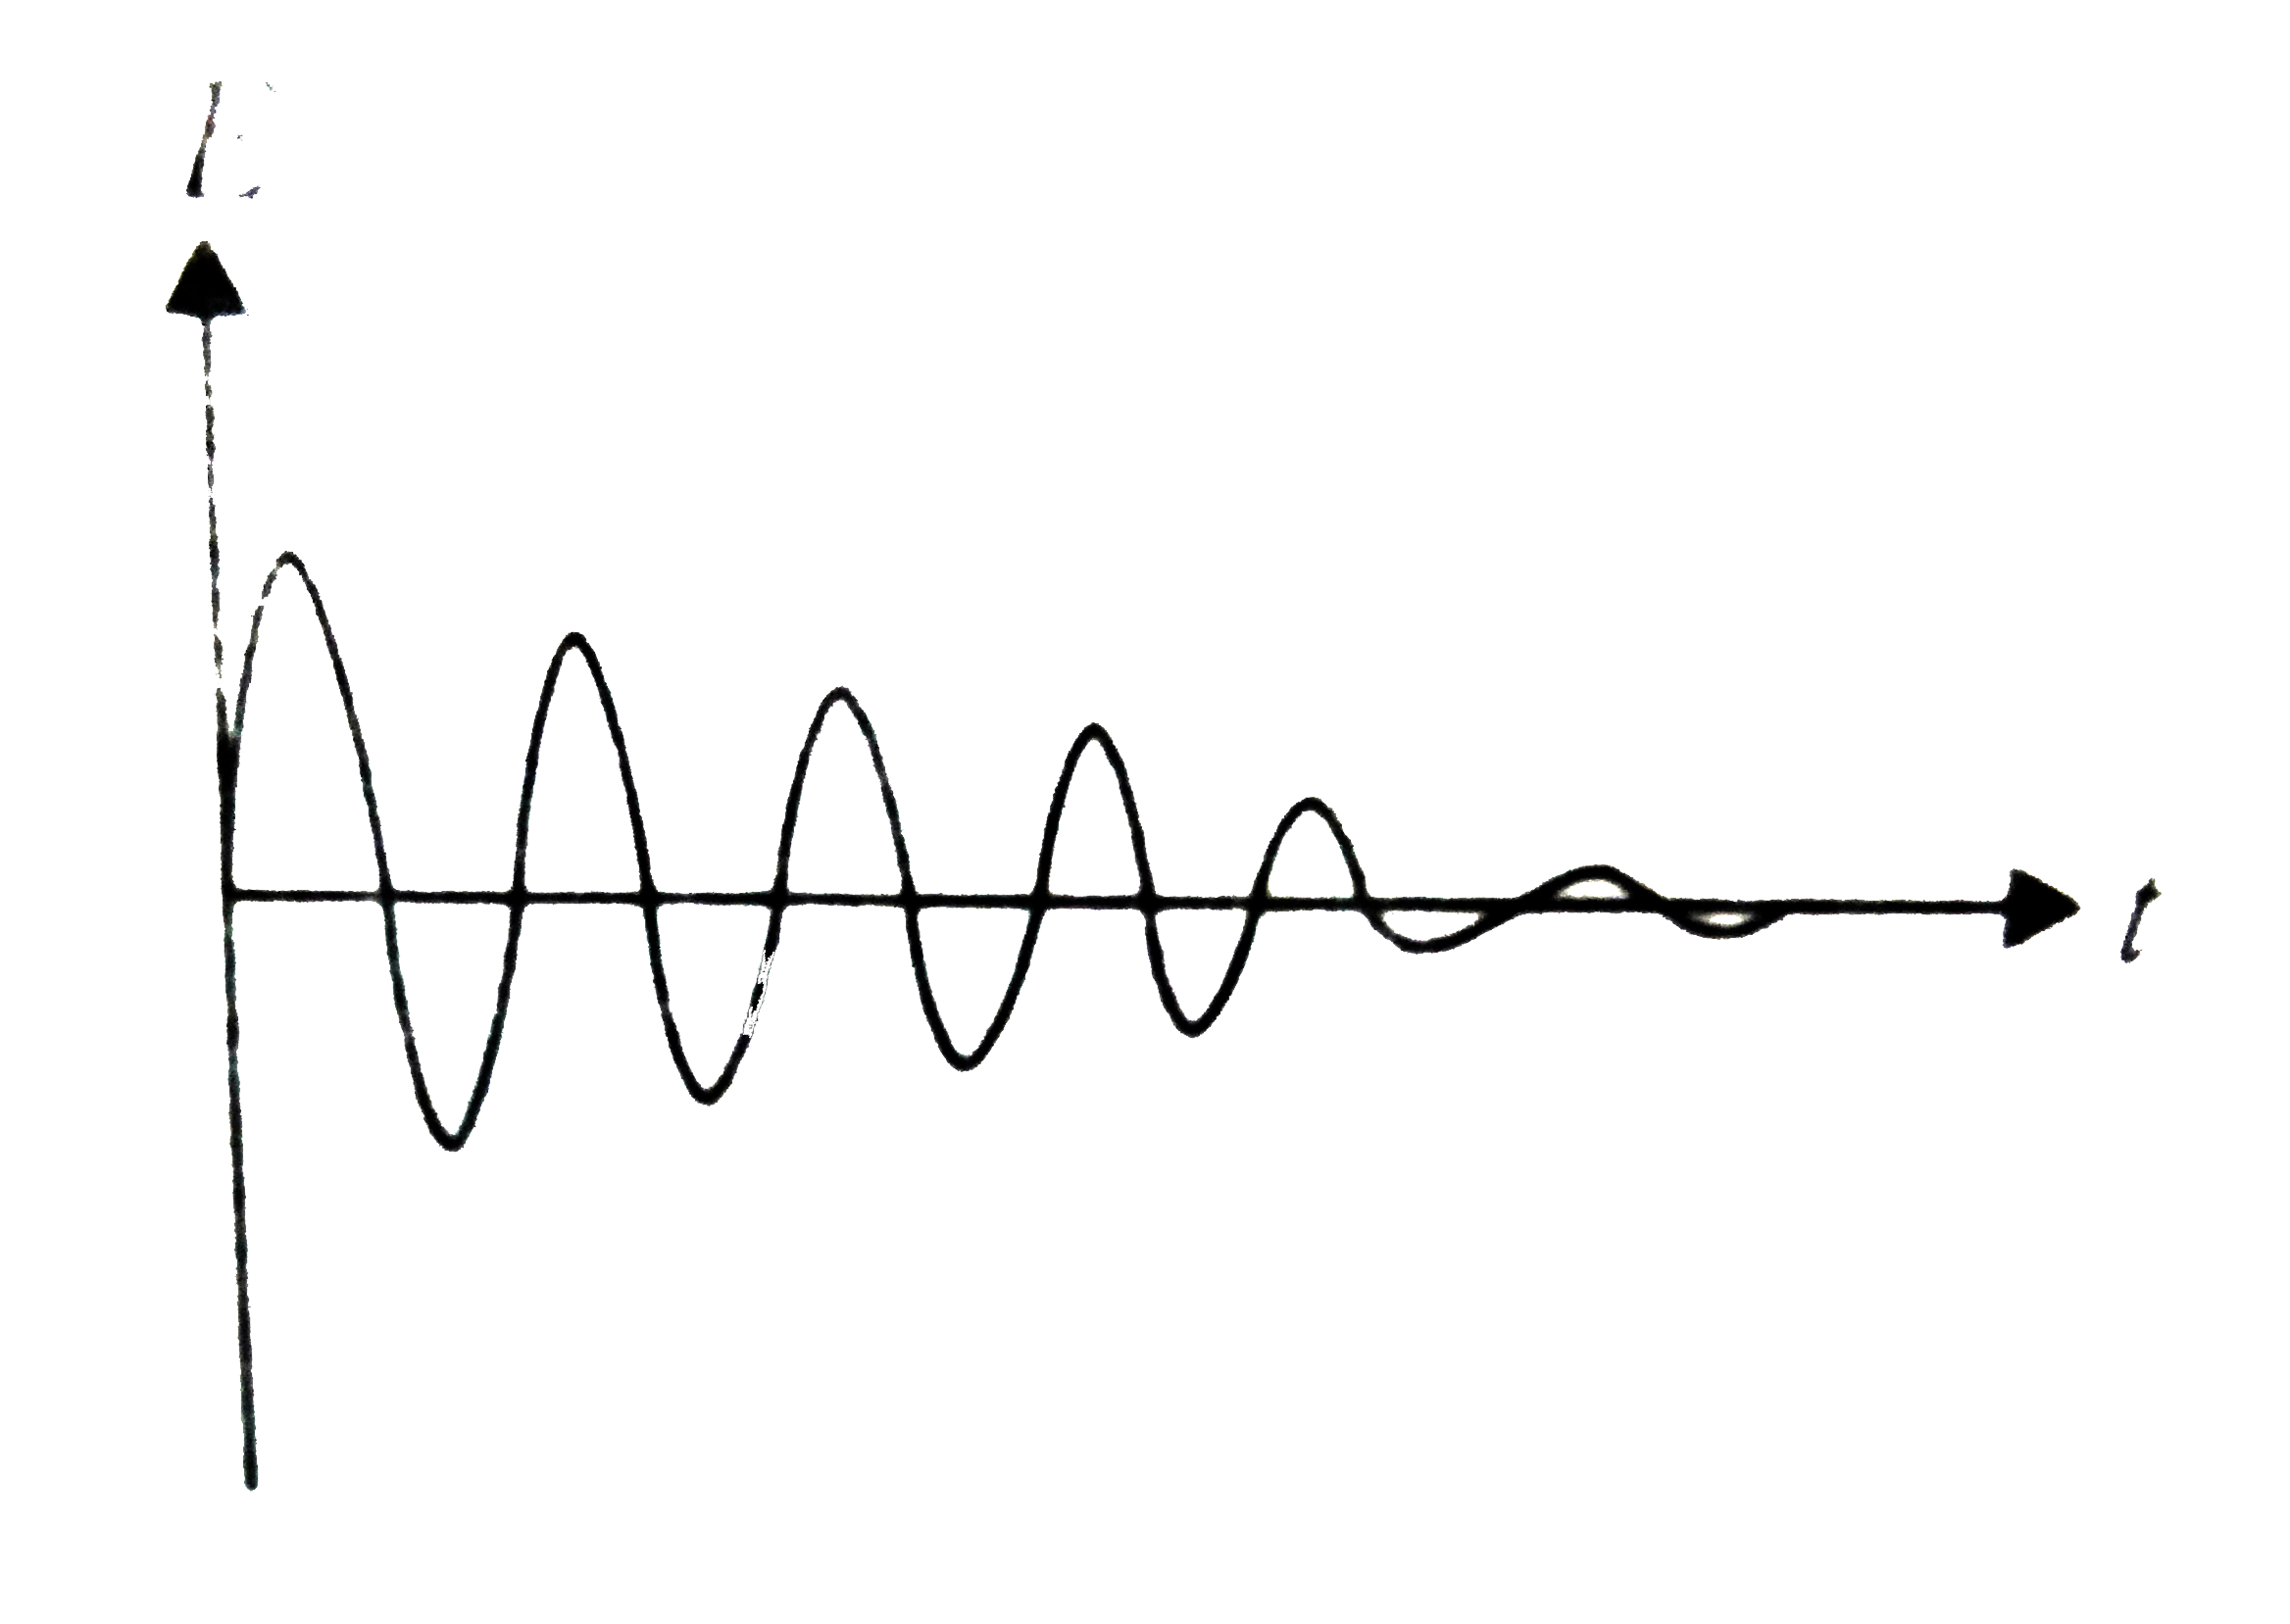 B
B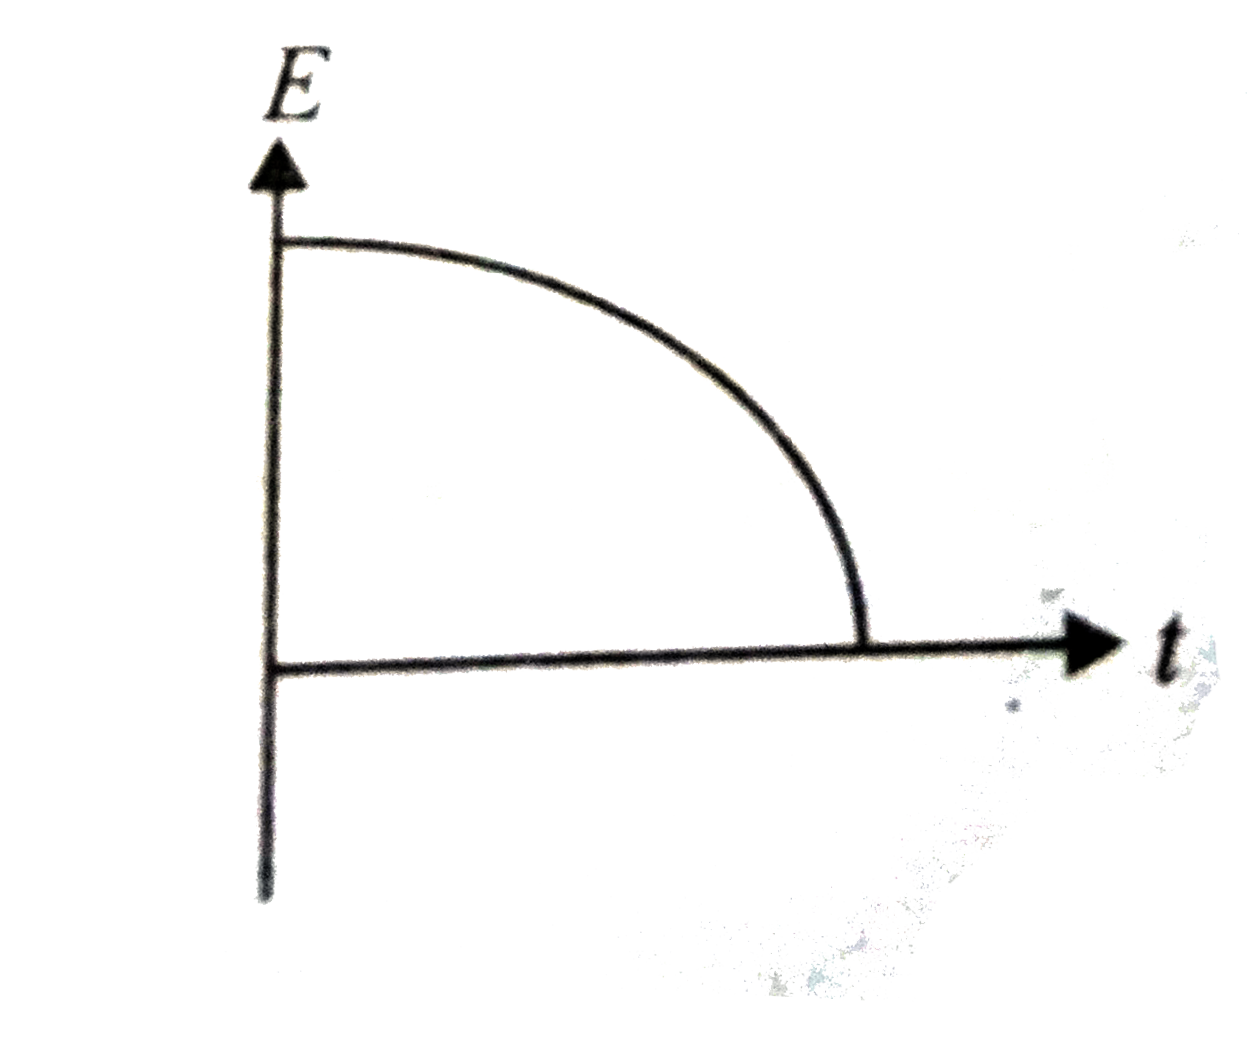 C
C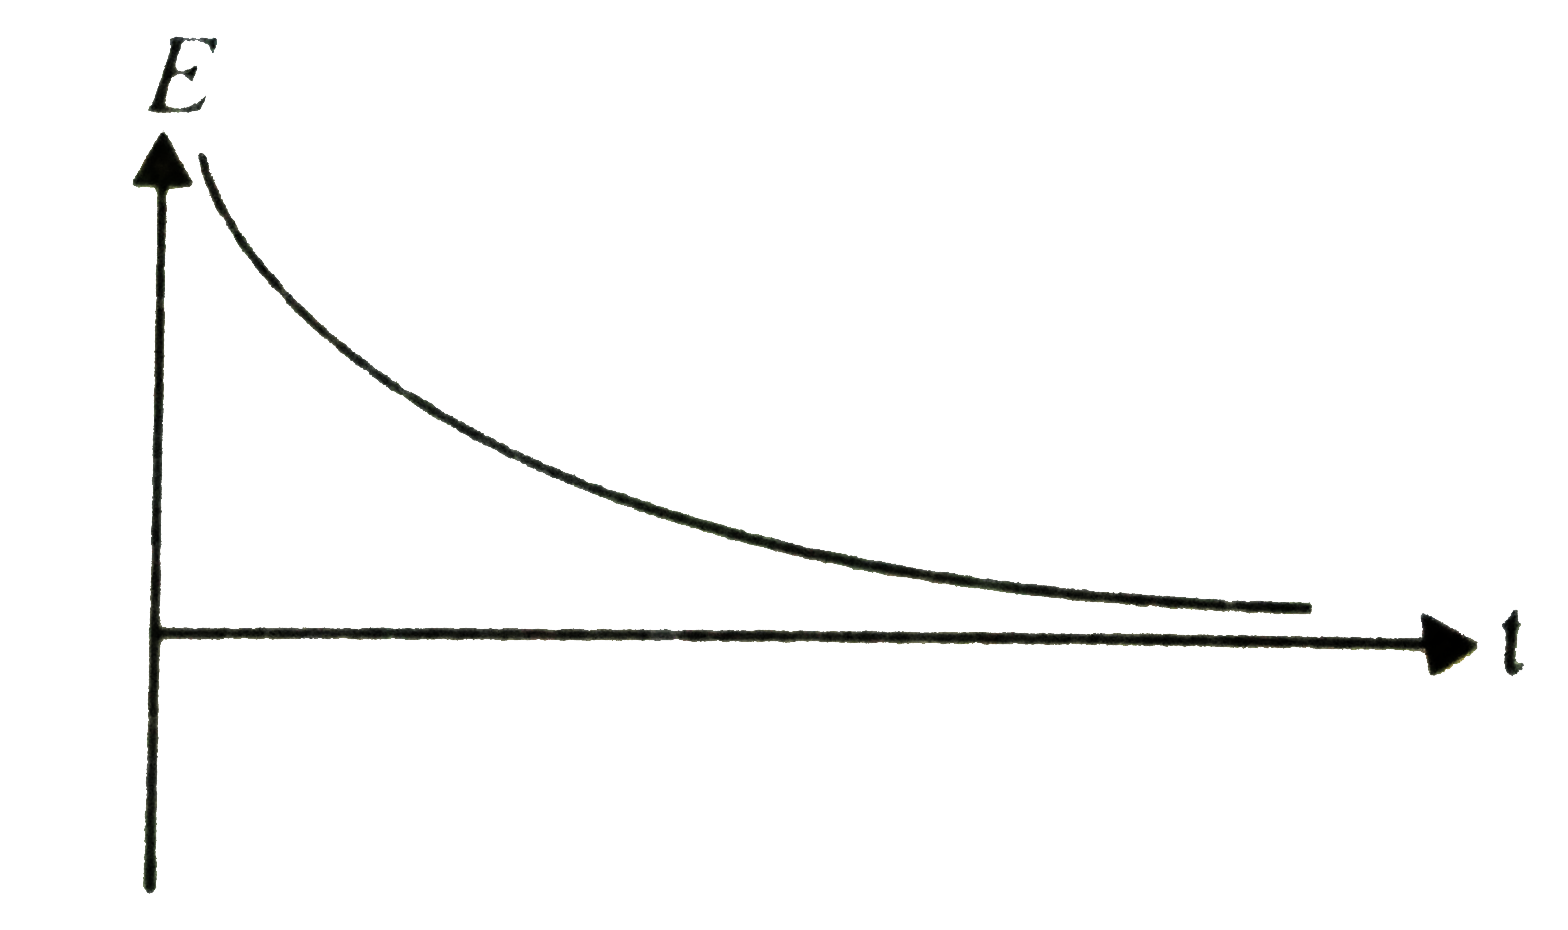 D
D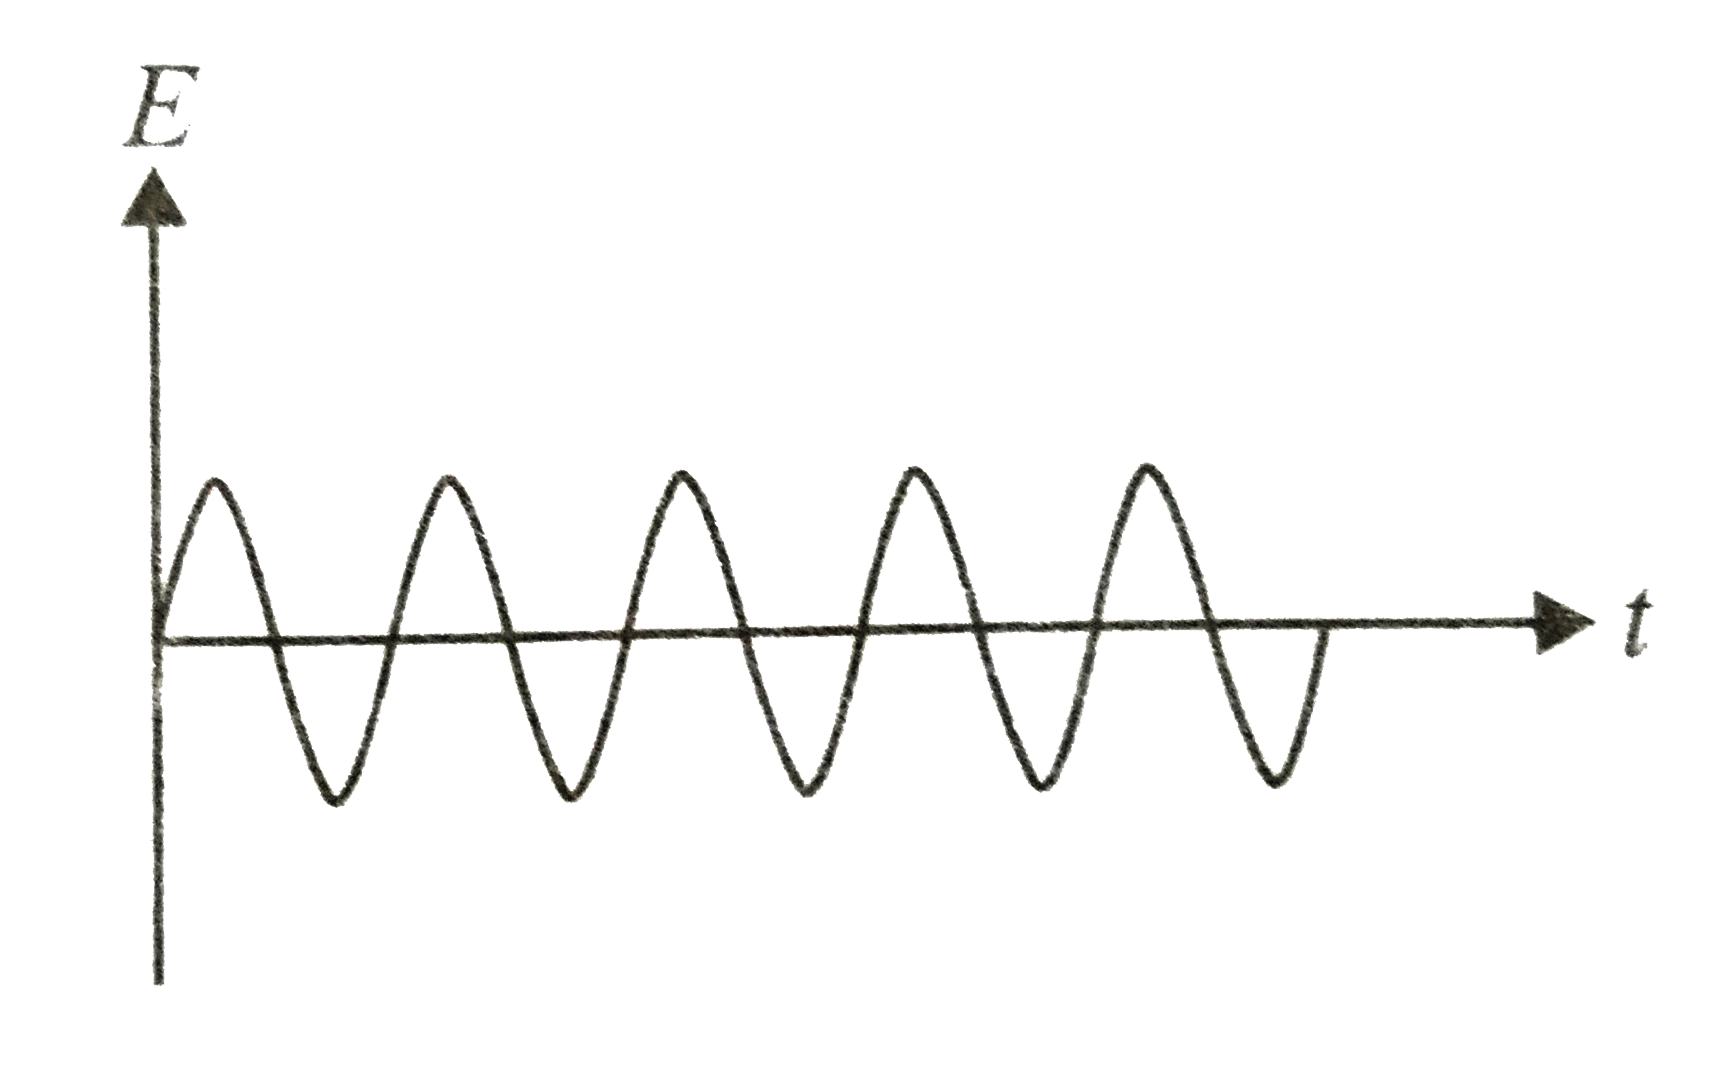
Which of the following expression does not represent simple harmonic motion?
Ax=Acosω+BsinωBx=Acos(ωt+α)Cx=Bsin(ωt+B)Dx=Asinωtcos2ωt
Which of the following velocity-time graphs represent uniform motion
View SolutionWhich of the following functionss represents a simple harmonic oscillation ?
View SolutionWhich of the following statements is/are true for a simple harmonic oscillator ?
View SolutionWhich of the following equation represents damped oscillation?
View SolutionWhich one of the following equations of motion represents simple harmonic motion ?
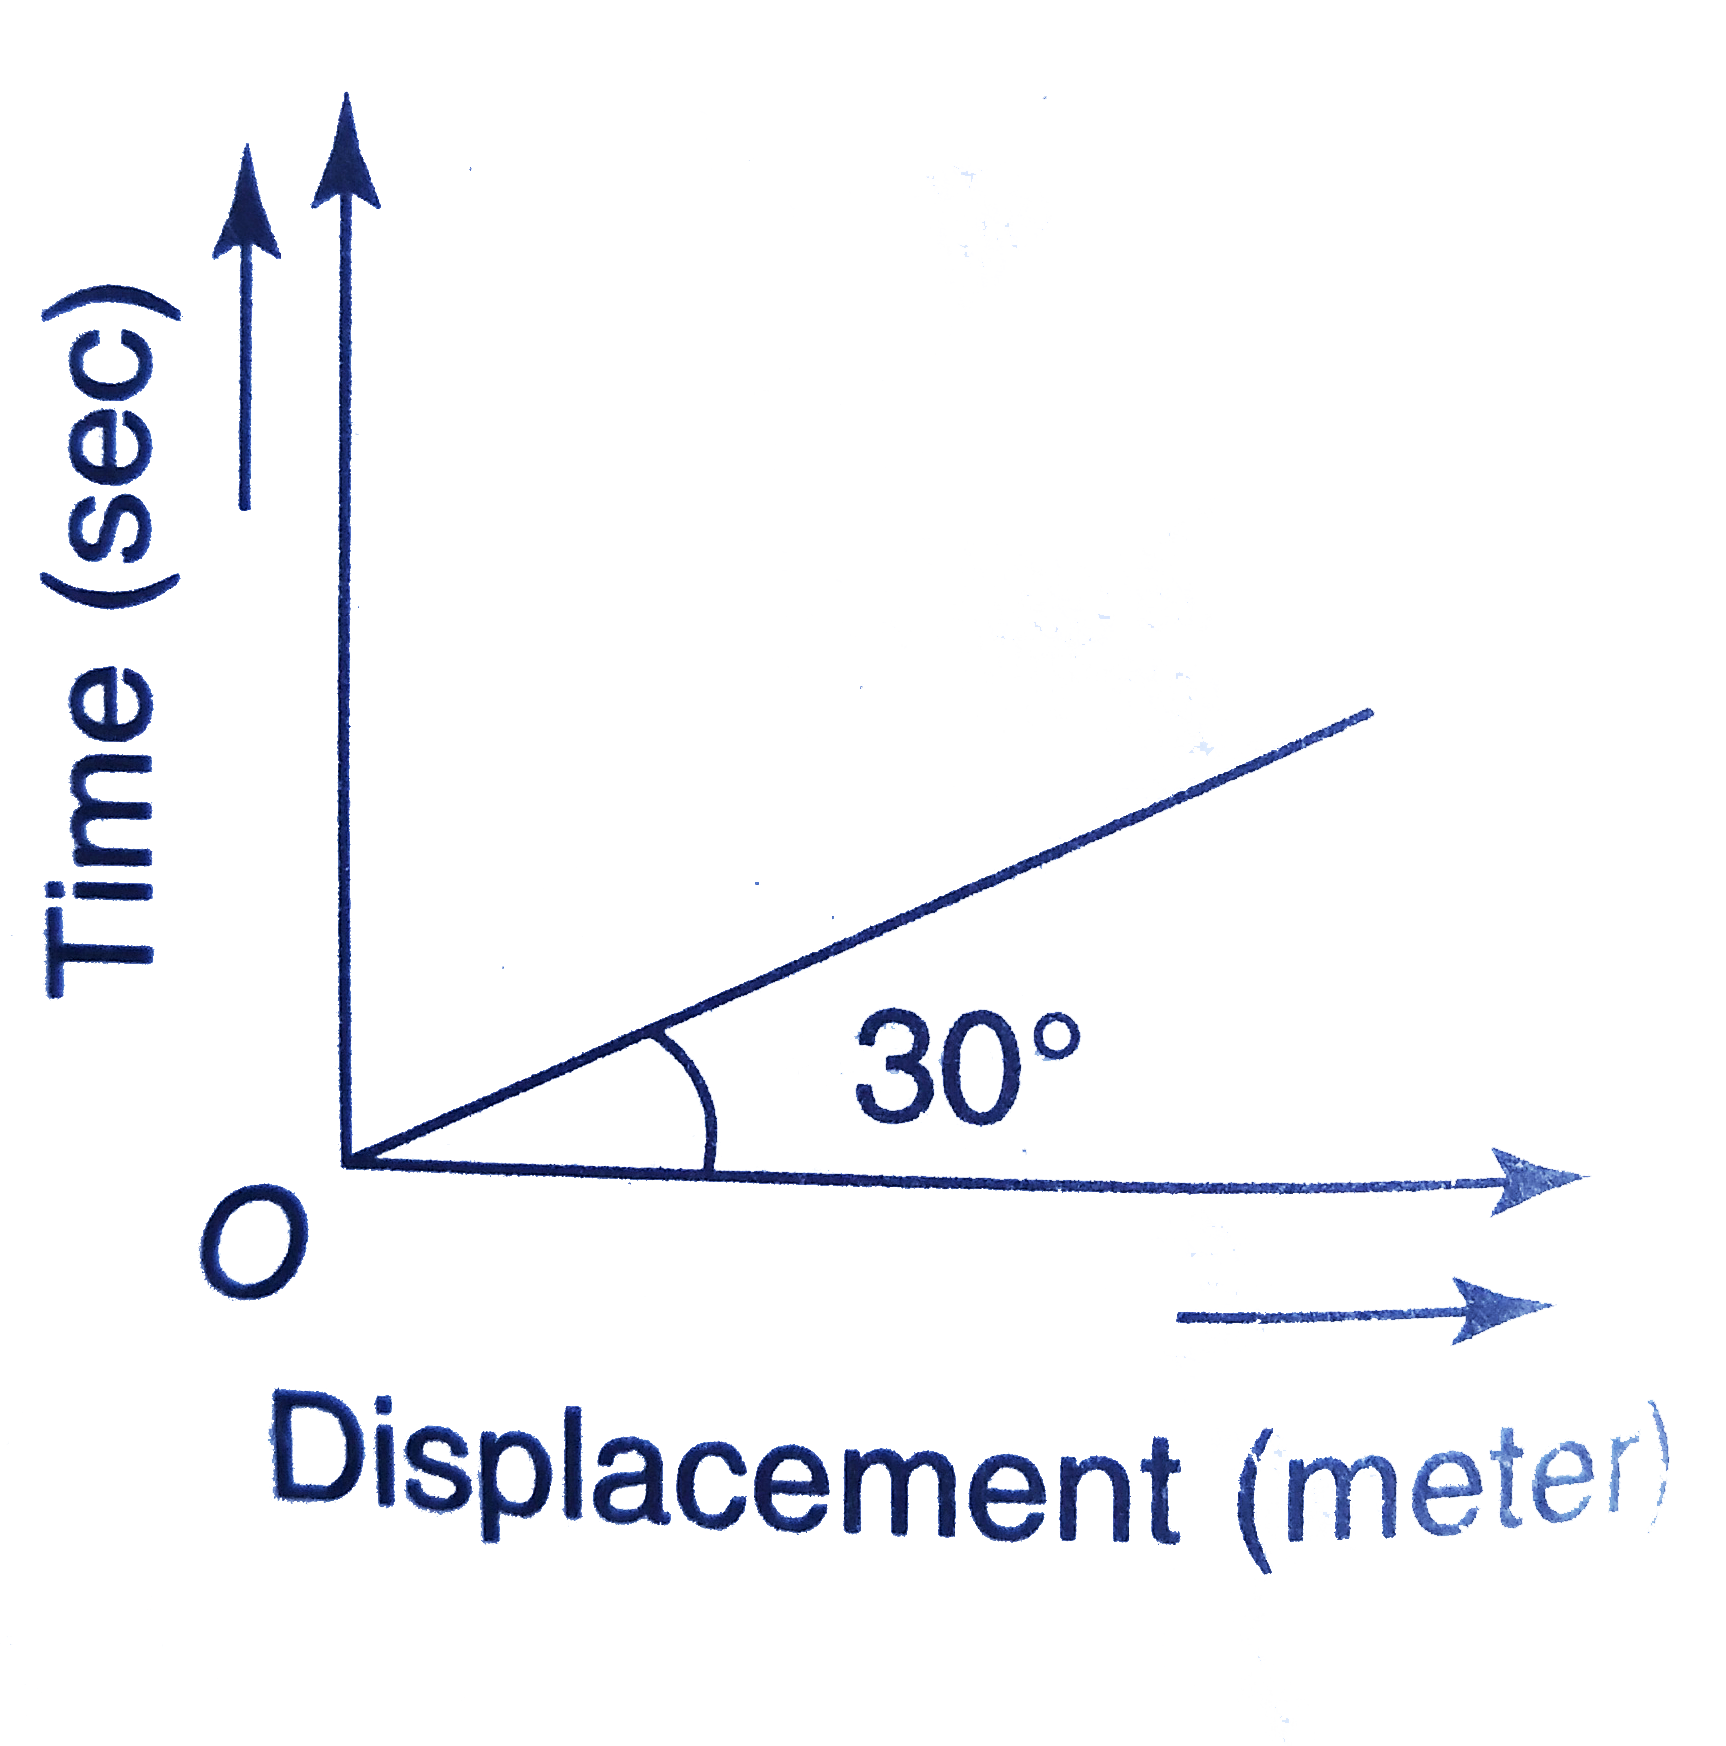
View SolutionFrom the following displacement-time graph find out the velocity of a moving body.
View Solution