Which of the following graphs represent the behaviour of an ideal gas ?
The correct Answer is:A
To determine which graph represents the behavior of an ideal gas, we can follow these steps:
Step 1: Understand the Ideal Gas Law
The ideal gas law is given by the equation:
pV=nRT
where:
- p = pressure
- V = volume
- n = number of moles of gas
- R = universal gas constant
- T = temperature
Step 2: Analyze the Relationships
From the ideal gas law, we can derive relationships between different variables:
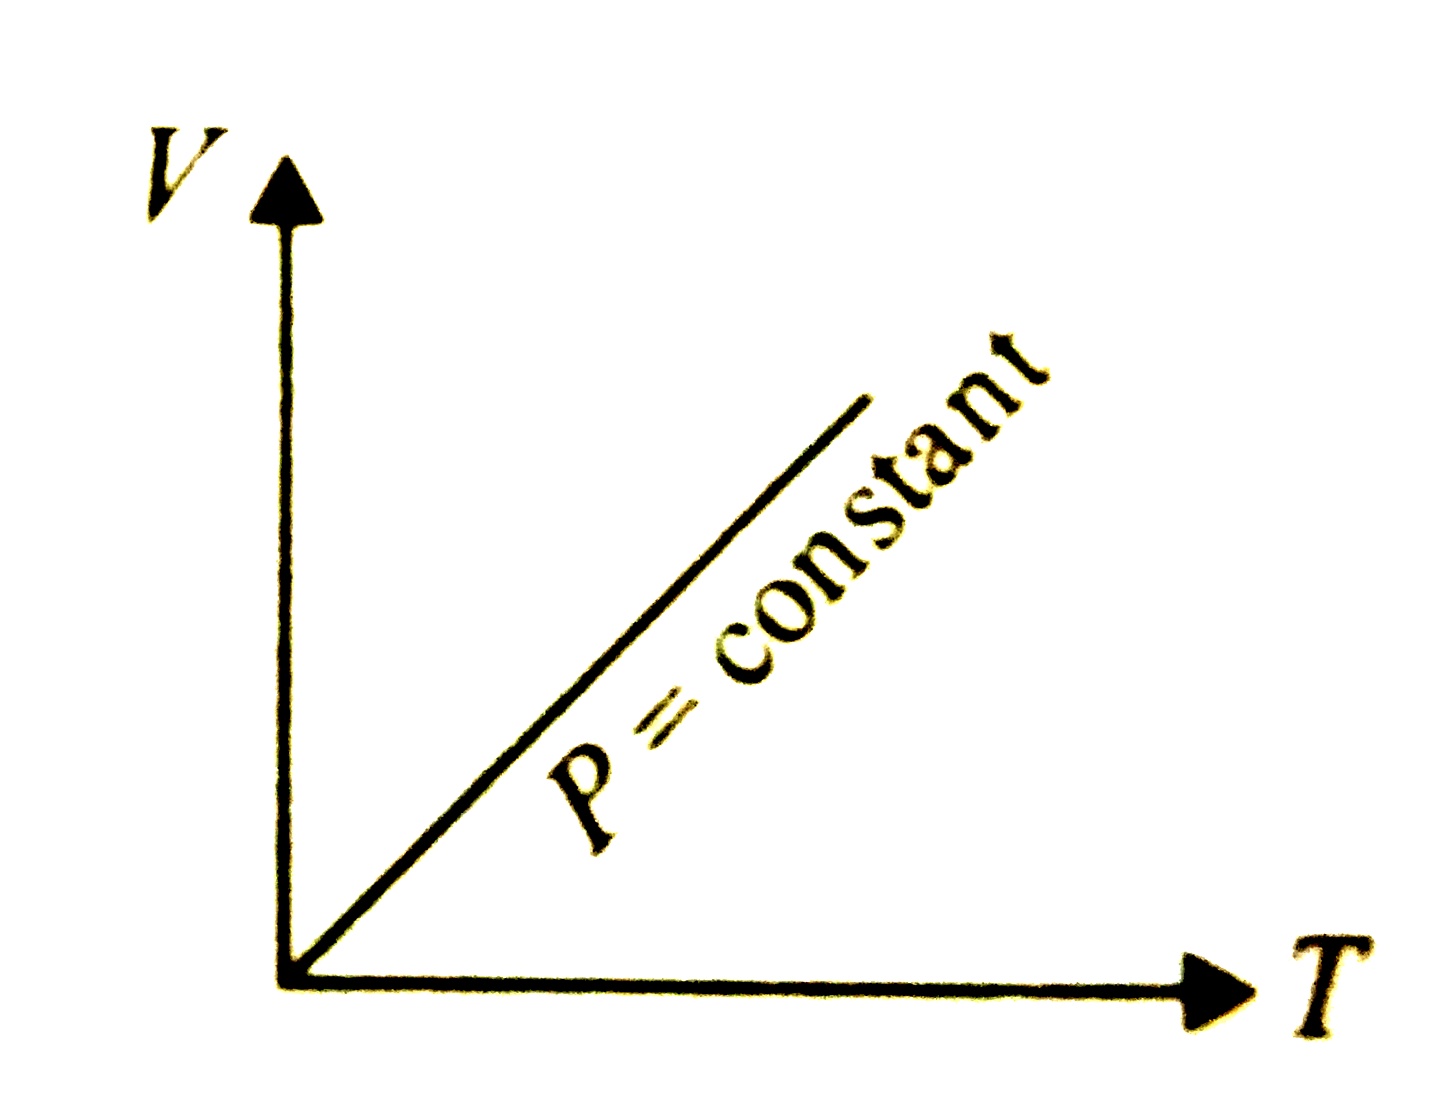
1. If pressure (p) is held constant, then volume (V) is directly proportional to temperature (T):
V∝T
This means that if we plot a graph of volume (y-axis) versus temperature (x-axis), we should see a straight line that slopes upwards.
Step 3: Evaluate the Given Graphs
Now, we need to evaluate the four graphs provided:
1. Graph 1: If this graph shows a straight line with volume on the y-axis and temperature on the x-axis, it represents the relationship V∝T at constant pressure. This graph is correct.
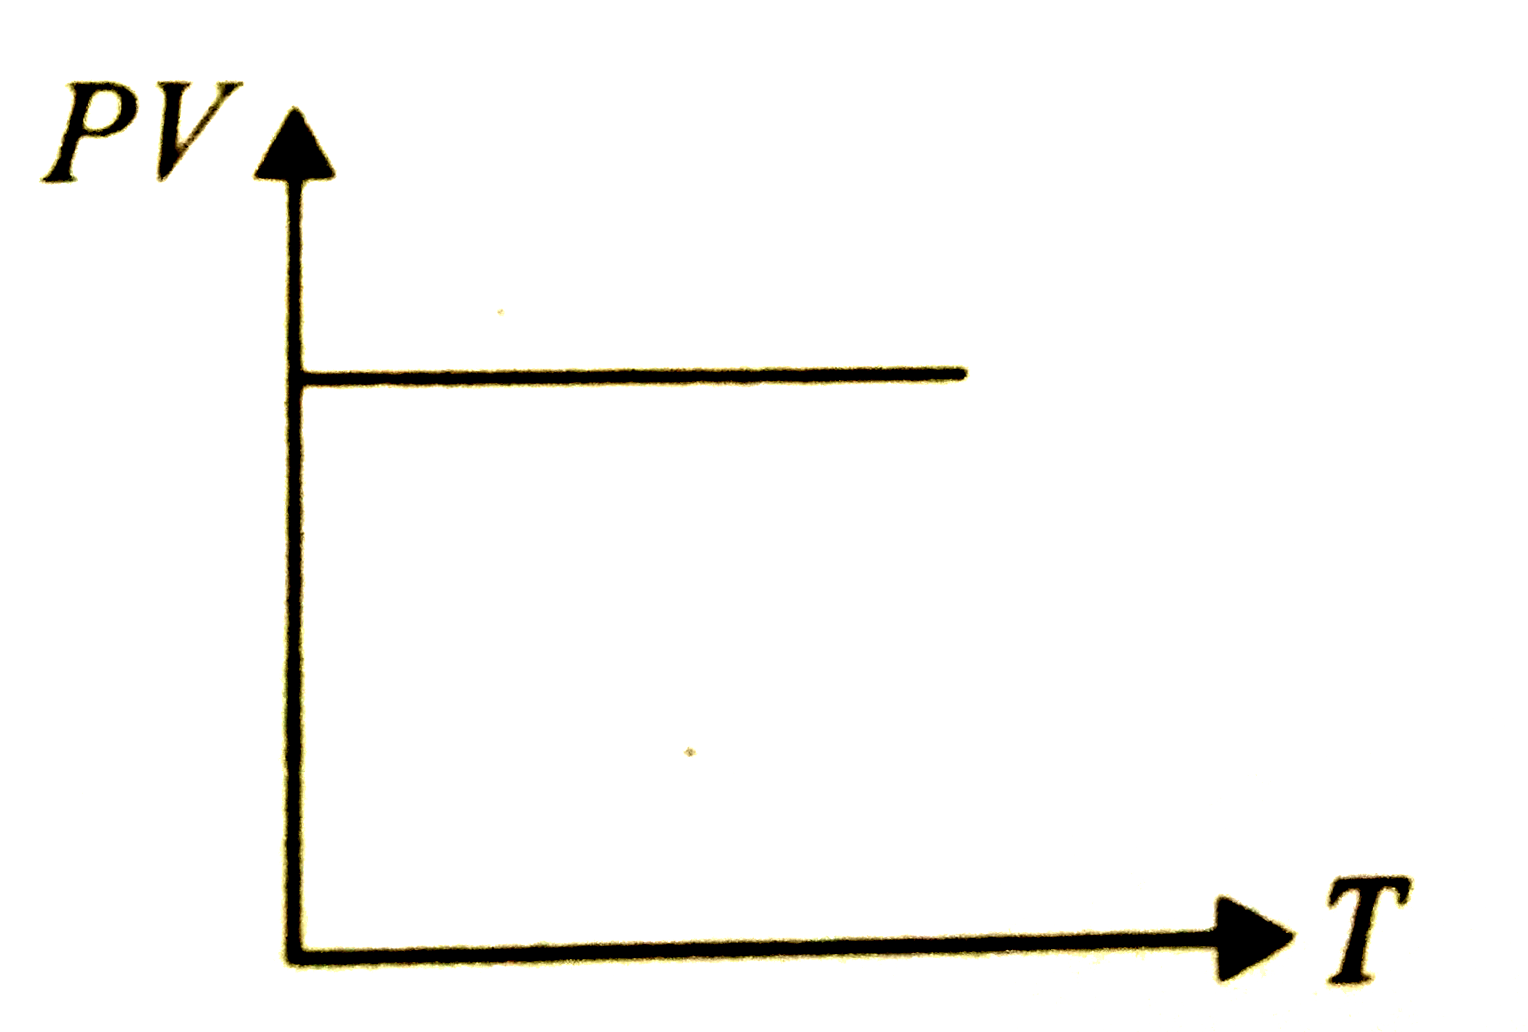
2. Graph 2: If this graph suggests that pV is dependent on T directly, it is incorrect because pV is equal to nRT and not dependent on T alone.
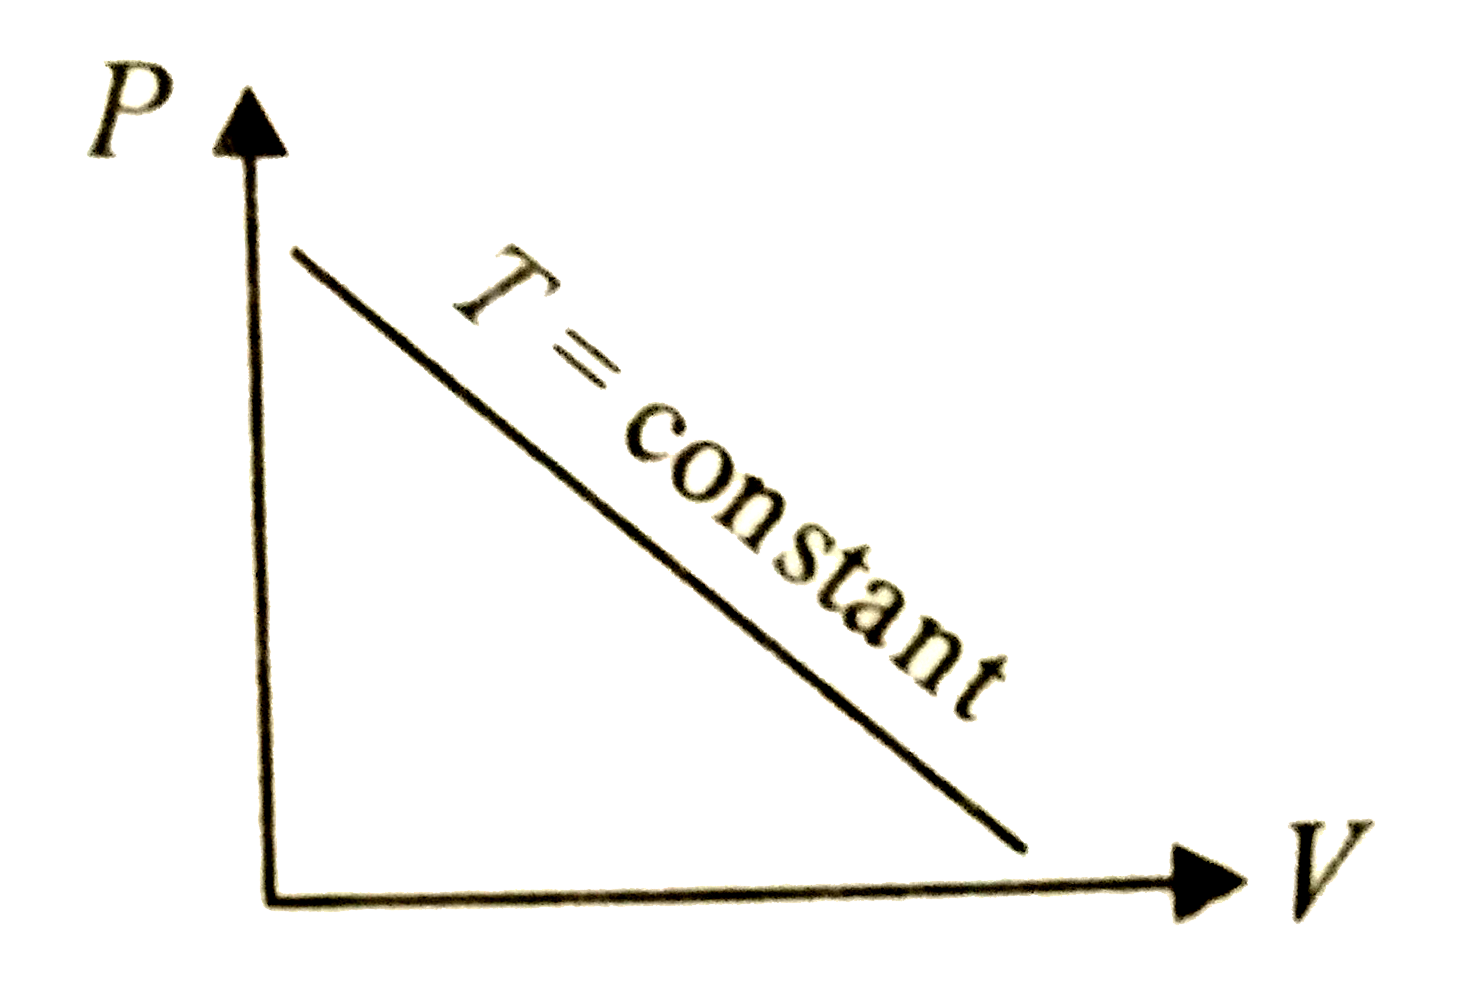
3. Graph 3: If this graph shows a linear decrease between pressure and volume, it is incorrect. According to Boyle's Law, pressure is inversely proportional to volume at constant temperature, which should yield a hyperbolic curve.
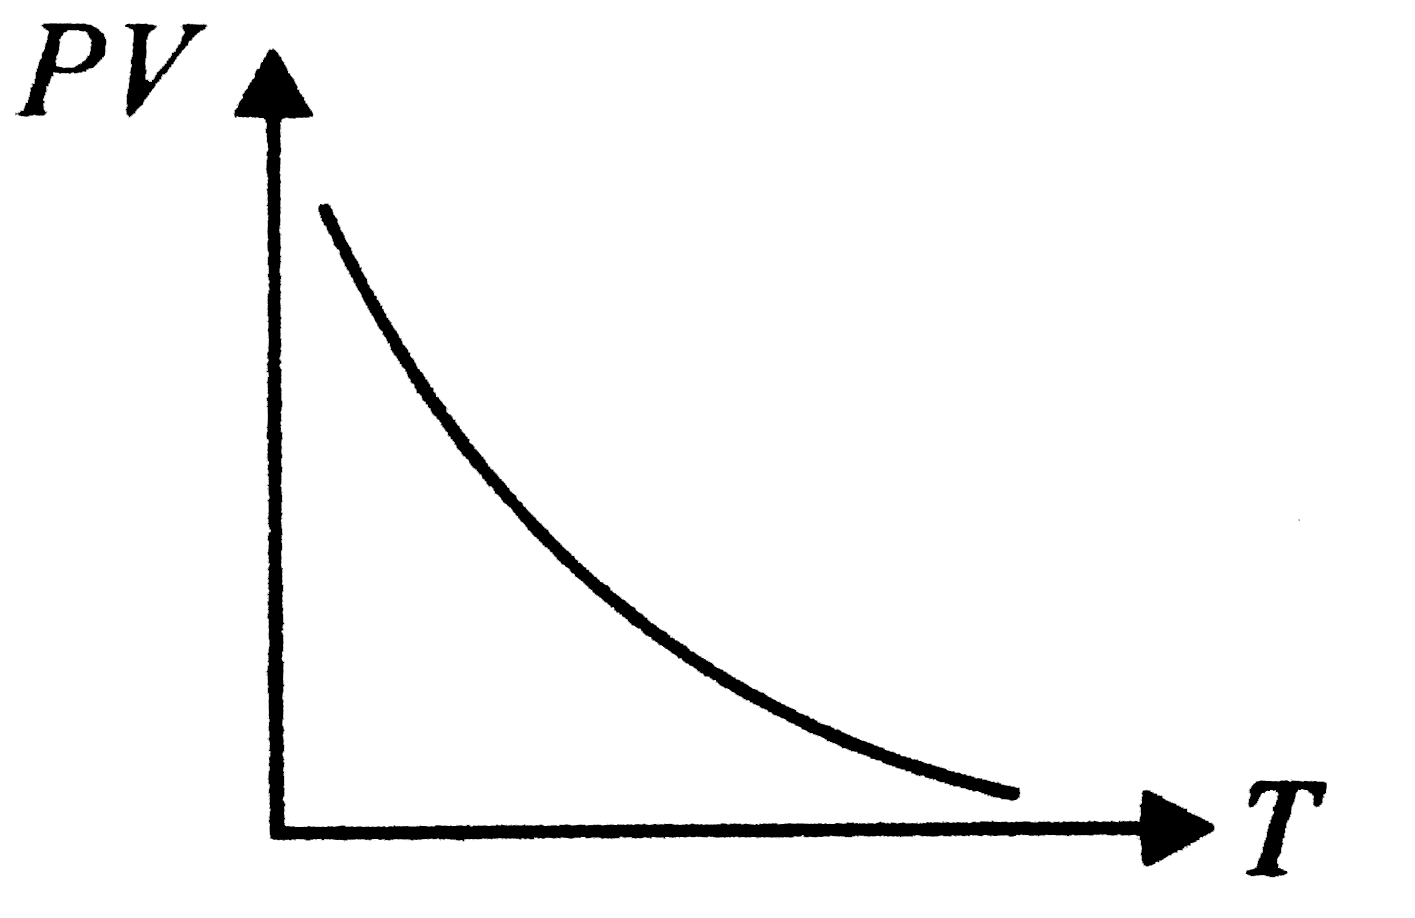
4. Graph 4: If this graph indicates that pV is dependent on T in a linear fashion, it is also incorrect since pV is equal to nRT and does not vary linearly with T.
Step 4: Conclusion
After evaluating all the graphs, we conclude that Graph 1 correctly represents the behavior of an ideal gas.
Final Answer
The correct graph that represents the behavior of an ideal gas is Graph 1.
---
The ideal gas law is given by the equation:
pV=nRT
where:
- p = pressure
- V = volume
- n = number of moles of gas
- R = universal gas constant
- T = temperature
From the ideal gas law, we can derive relationships between different variables:
1. If pressure (p) is held constant, then volume (V) is directly proportional to temperature (T):
V∝T
This means that if we plot a graph of volume (y-axis) versus temperature (x-axis), we should see a straight line that slopes upwards.
Now, we need to evaluate the four graphs provided:
1. Graph 1: If this graph shows a straight line with volume on the y-axis and temperature on the x-axis, it represents the relationship V∝T at constant pressure. This graph is correct.
2. Graph 2: If this graph suggests that pV is dependent on T directly, it is incorrect because pV is equal to nRT and not dependent on T alone.
3. Graph 3: If this graph shows a linear decrease between pressure and volume, it is incorrect. According to Boyle's Law, pressure is inversely proportional to volume at constant temperature, which should yield a hyperbolic curve.
4. Graph 4: If this graph indicates that pV is dependent on T in a linear fashion, it is also incorrect since pV is equal to nRT and does not vary linearly with T.
After evaluating all the graphs, we conclude that Graph 1 correctly represents the behavior of an ideal gas.
The correct graph that represents the behavior of an ideal gas is Graph 1.
Topper's Solved these Questions
- KINETIC THEORYBook:NCERT FINGERTIPSChapter:KINETIC THEORYExercise:Kinetic Theory Of An Ideal Gas
Explore 18 Videos
- KINETIC THEORYBook:NCERT FINGERTIPSChapter:KINETIC THEORYExercise:Law Of Equipartition Of Energy
Explore 5 Videos
- KINETIC THEORYBook:NCERT FINGERTIPSChapter:KINETIC THEORYExercise:Assertion And Reason
Explore 10 Videos
- GRAVITATIONBook:NCERT FINGERTIPSChapter:GRAVITATIONExercise:Assertion And Reason
Explore 15 Videos
- LAWS OF MOTIONBook:NCERT FINGERTIPSChapter:LAWS OF MOTIONExercise:Assertion And Reason
Explore 15 Videos
Similar Questions
Knowledge Check
Which of the following plots represents the behavior of an ideal binary liquid solution ?
APlot of PtotalvsYA (mol-fraction of A in vapour phase) is linearBplote of PtotalvsYB is linearCPlote of 1/PtotalvsYA is linearDPlote of 1/PtotalvsYB is non-linearWhich of the following plots does not represent the behaviour of an ideal binary liquid solution?
APlot of pA versus xA (mole fraction of A in liquid phase) is linearBPlot of pB versus xB is linearCPlot of ptotal versus xA (or xB) is linearDPlot of ptotal versus xA is non-linearWhich of the following plots does not represent the behaviour of an ideal binary liquid solution of A and B?
APlot of PB versus XB is linear.BPlot of PA versus XA is linear.CPlot of PTotal Versus XAorXB is linear.DPlot of PTotal versus XA is non-linear.
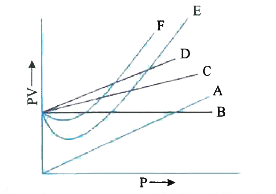
Which curve in the following graph represents the curve of ideal gas ?
View SolutionThe graph that does represent the behaviour of an ideal gas is :
View SolutionWhich of the following graphs is not a straight line for an ideal gas ?
View Solution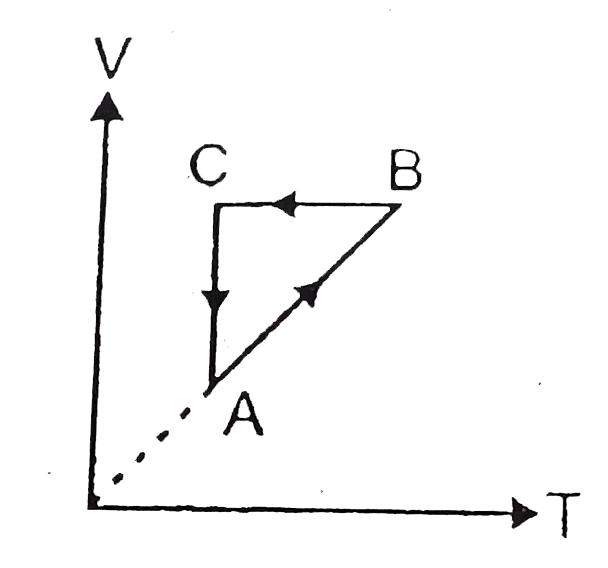
An ideal undergoes a thermodynamic cycle as shown in figure. Which of the following graphs represent the same cycle?
View SolutionThe graph that does not repersent the behaviour of an ideal gas is-
View Solution