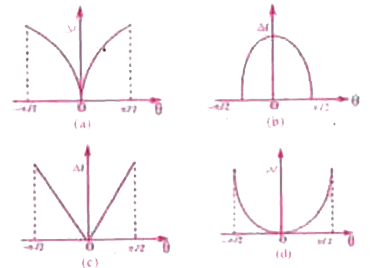
Which of the following graphs represent the variation of the path difference (△l) between the interferring waves in a double slit experiment with the .angular position. (θ) of the point on the screen?

△L=dsinθ
∴△L versus θ is a sine curve, with |θ|≤π2.
Topper's Solved these Questions
Similar Questions
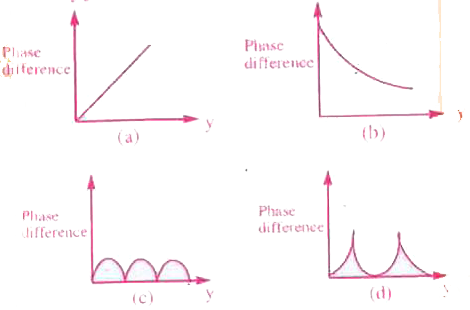
Which of the following graphs best represent the variation of phase difference between he interferring waves in a double slit experiment with the distance from the central maximum?
 View Solution
If the path difference between the interfering waves is nλ, then the fringes obtained on the screen will be
View Solution
Knowledge Check
- Question 1 - Select One
If path difference between two interfering waves arriving at a point is zero, then the point will
Abe a dark pointBbe a bright pointCremains as it isDbe eigher a dary or a bright point. - Question 2 - Select One
If path difference between two interfering waves is zero, then the point will be
AdarkBbrightCas it isDeither dark of bright - Question 3 - Select One
If the path difference between the interfering waves is nλ, then the fringes obtained on the screen will be
ADarkBBrightCcolouredDWhite
In Young's double slit experiment,the intensity at a point where the path difference is
View SolutionThe graph between the shifts of the interferring pattern in a double slit experiment with the thickness t of a transparent slab introduced in front of one of the slits is best represented by
 View Solution
In Young's double-slit experiment, the path difference between two interfering waves at a point on the screen is 13.5 times the wavelength. The point is
View SolutionThe path difference between two interfering waves at a point on screen is 70.5 tomes the wave length. The point is
View SolutionIn Young's double-slit experiment, the path difference between two interfering waves at a point on the screen is 13.5 times the wavelength. The point is
View Solution

