Which of the following P-V diagram represent the graph of isometric process?
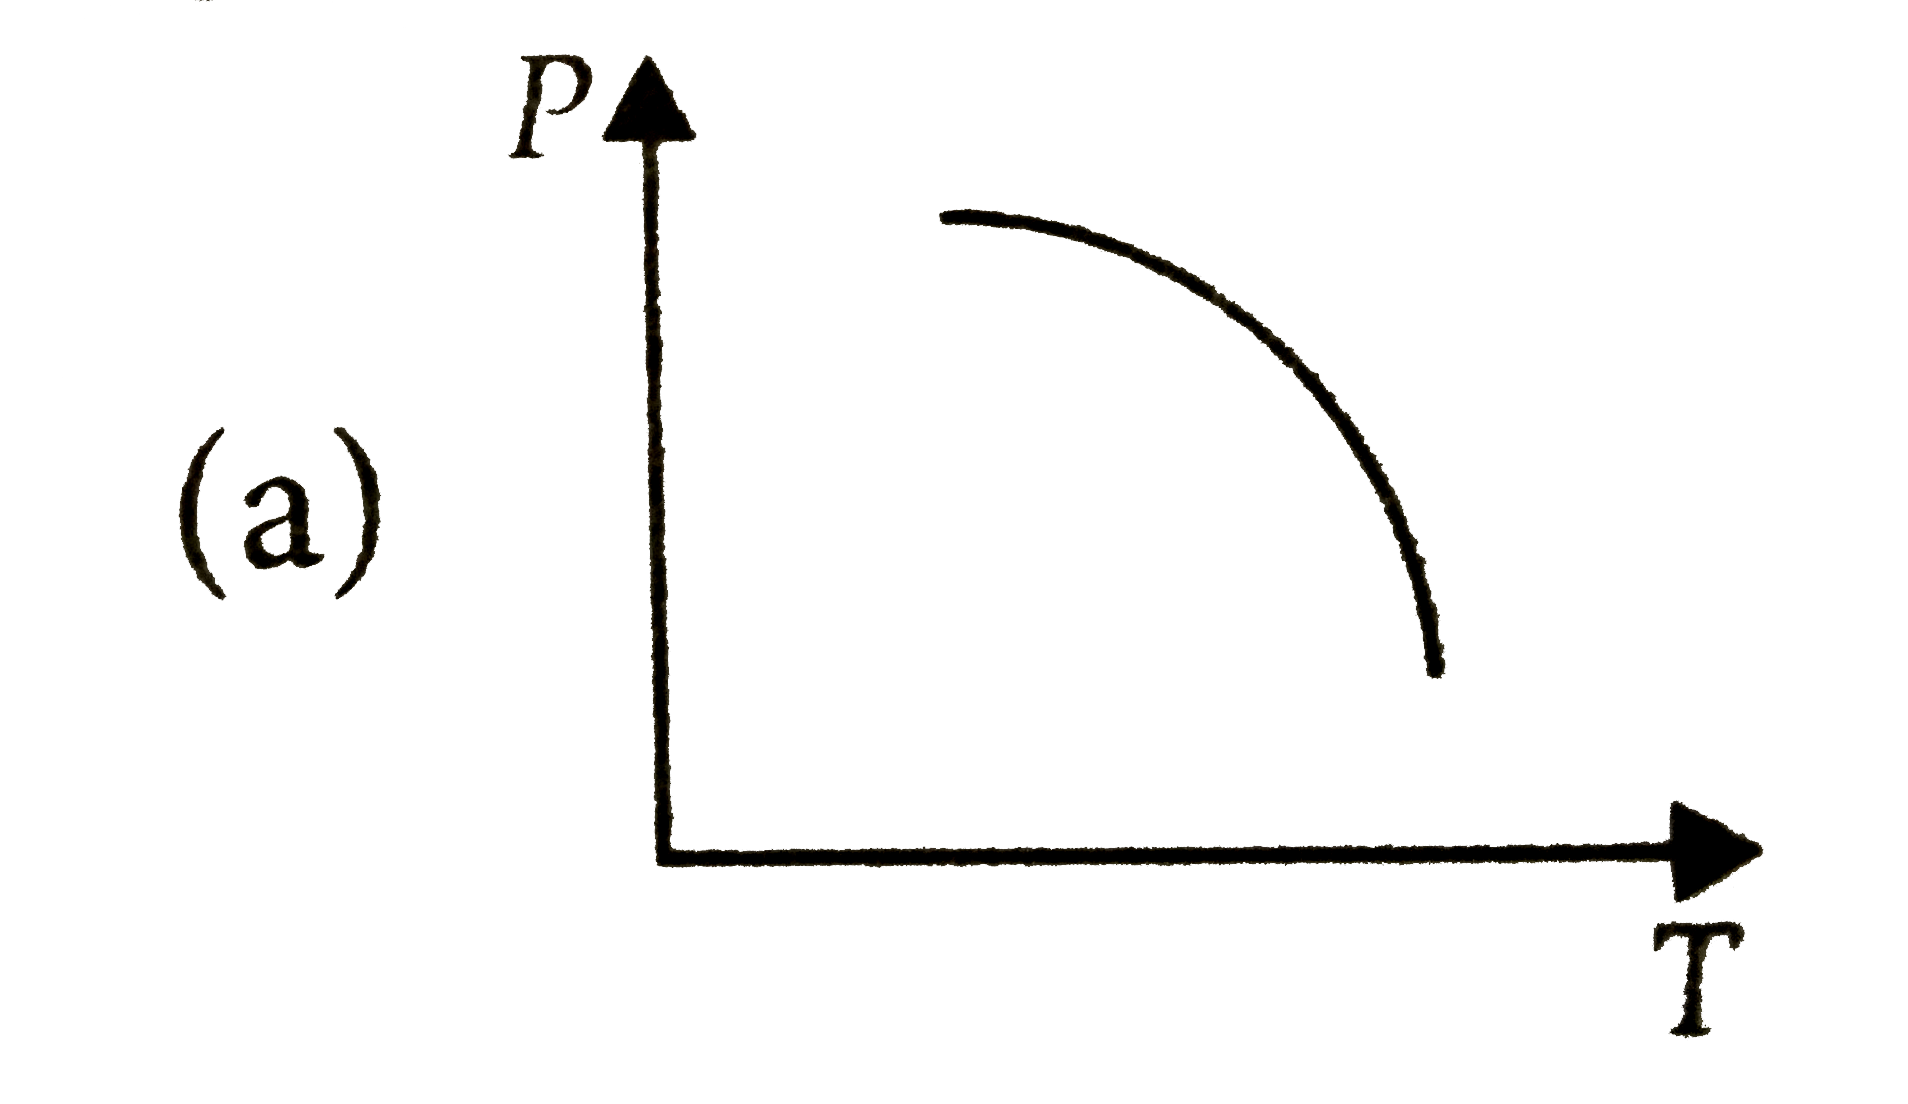
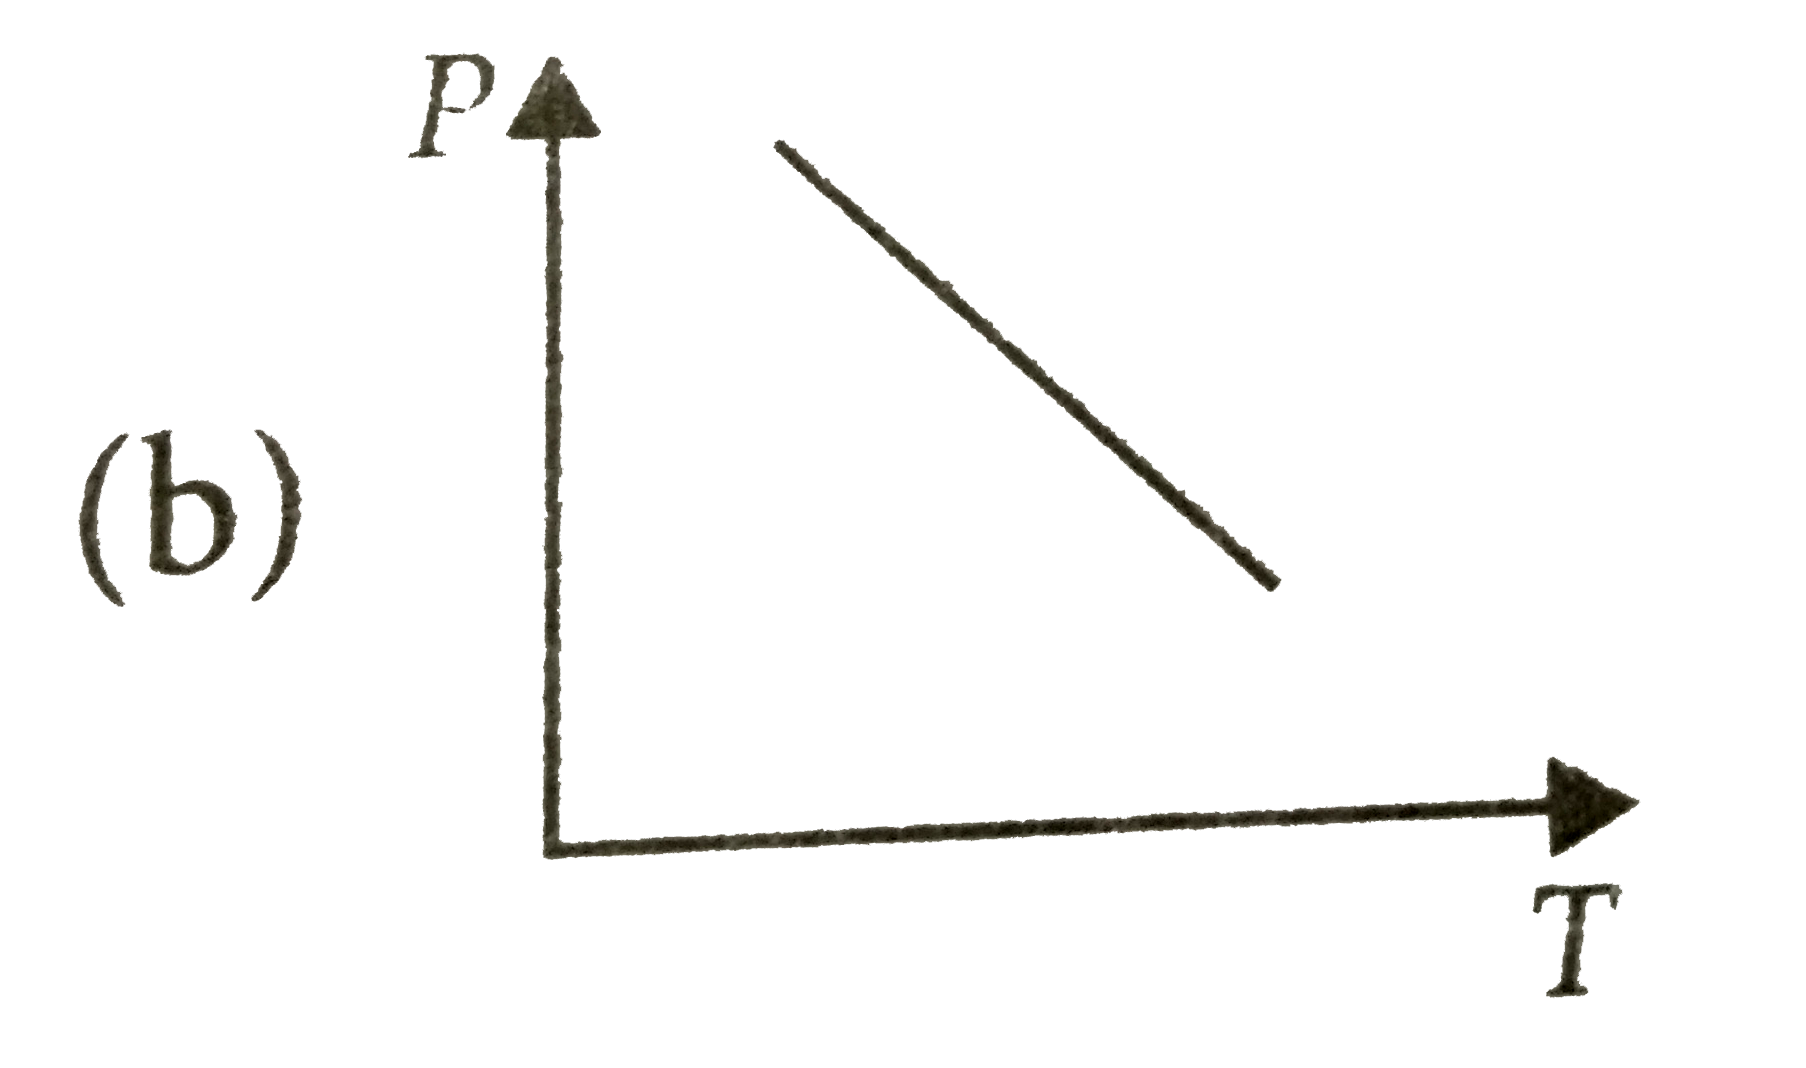
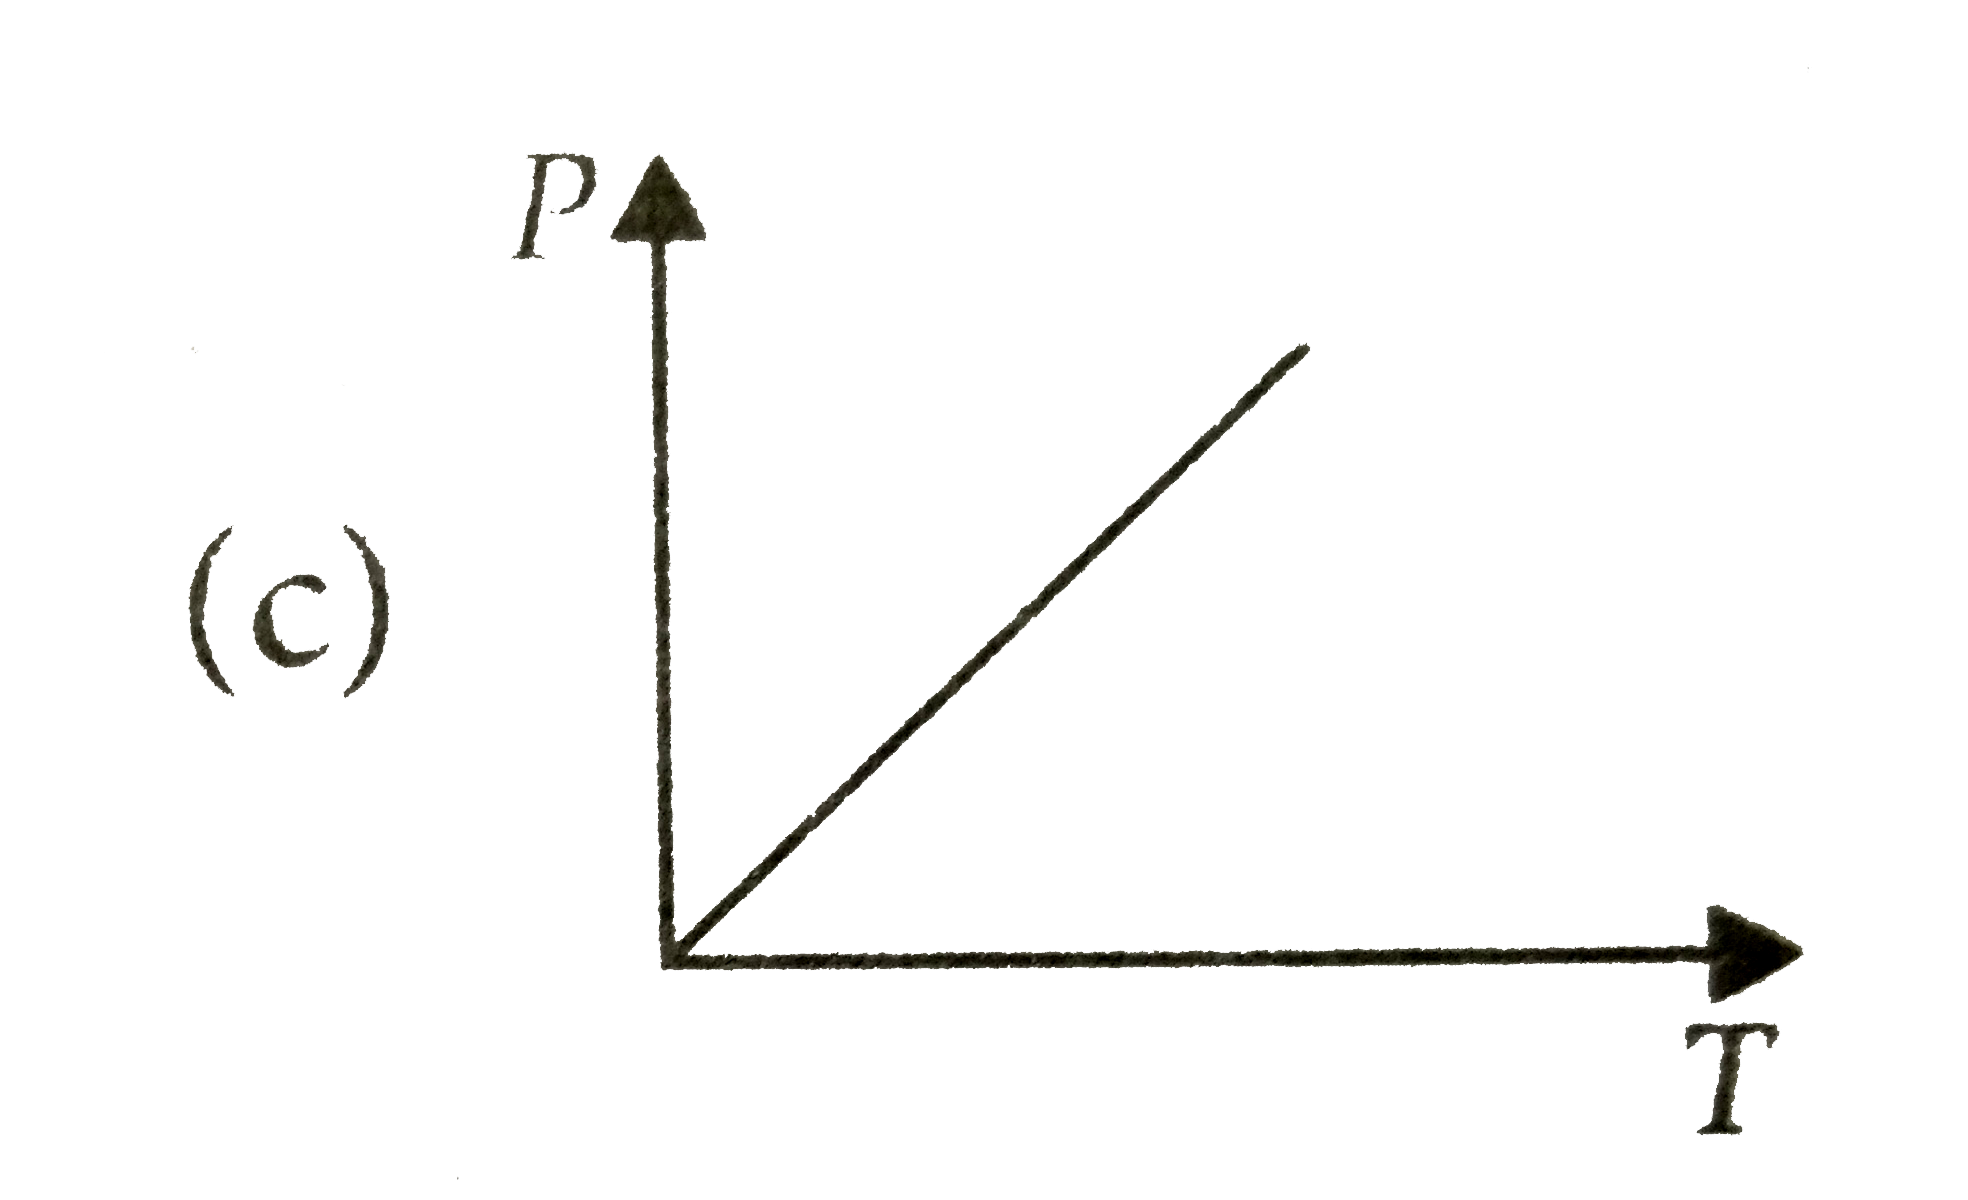
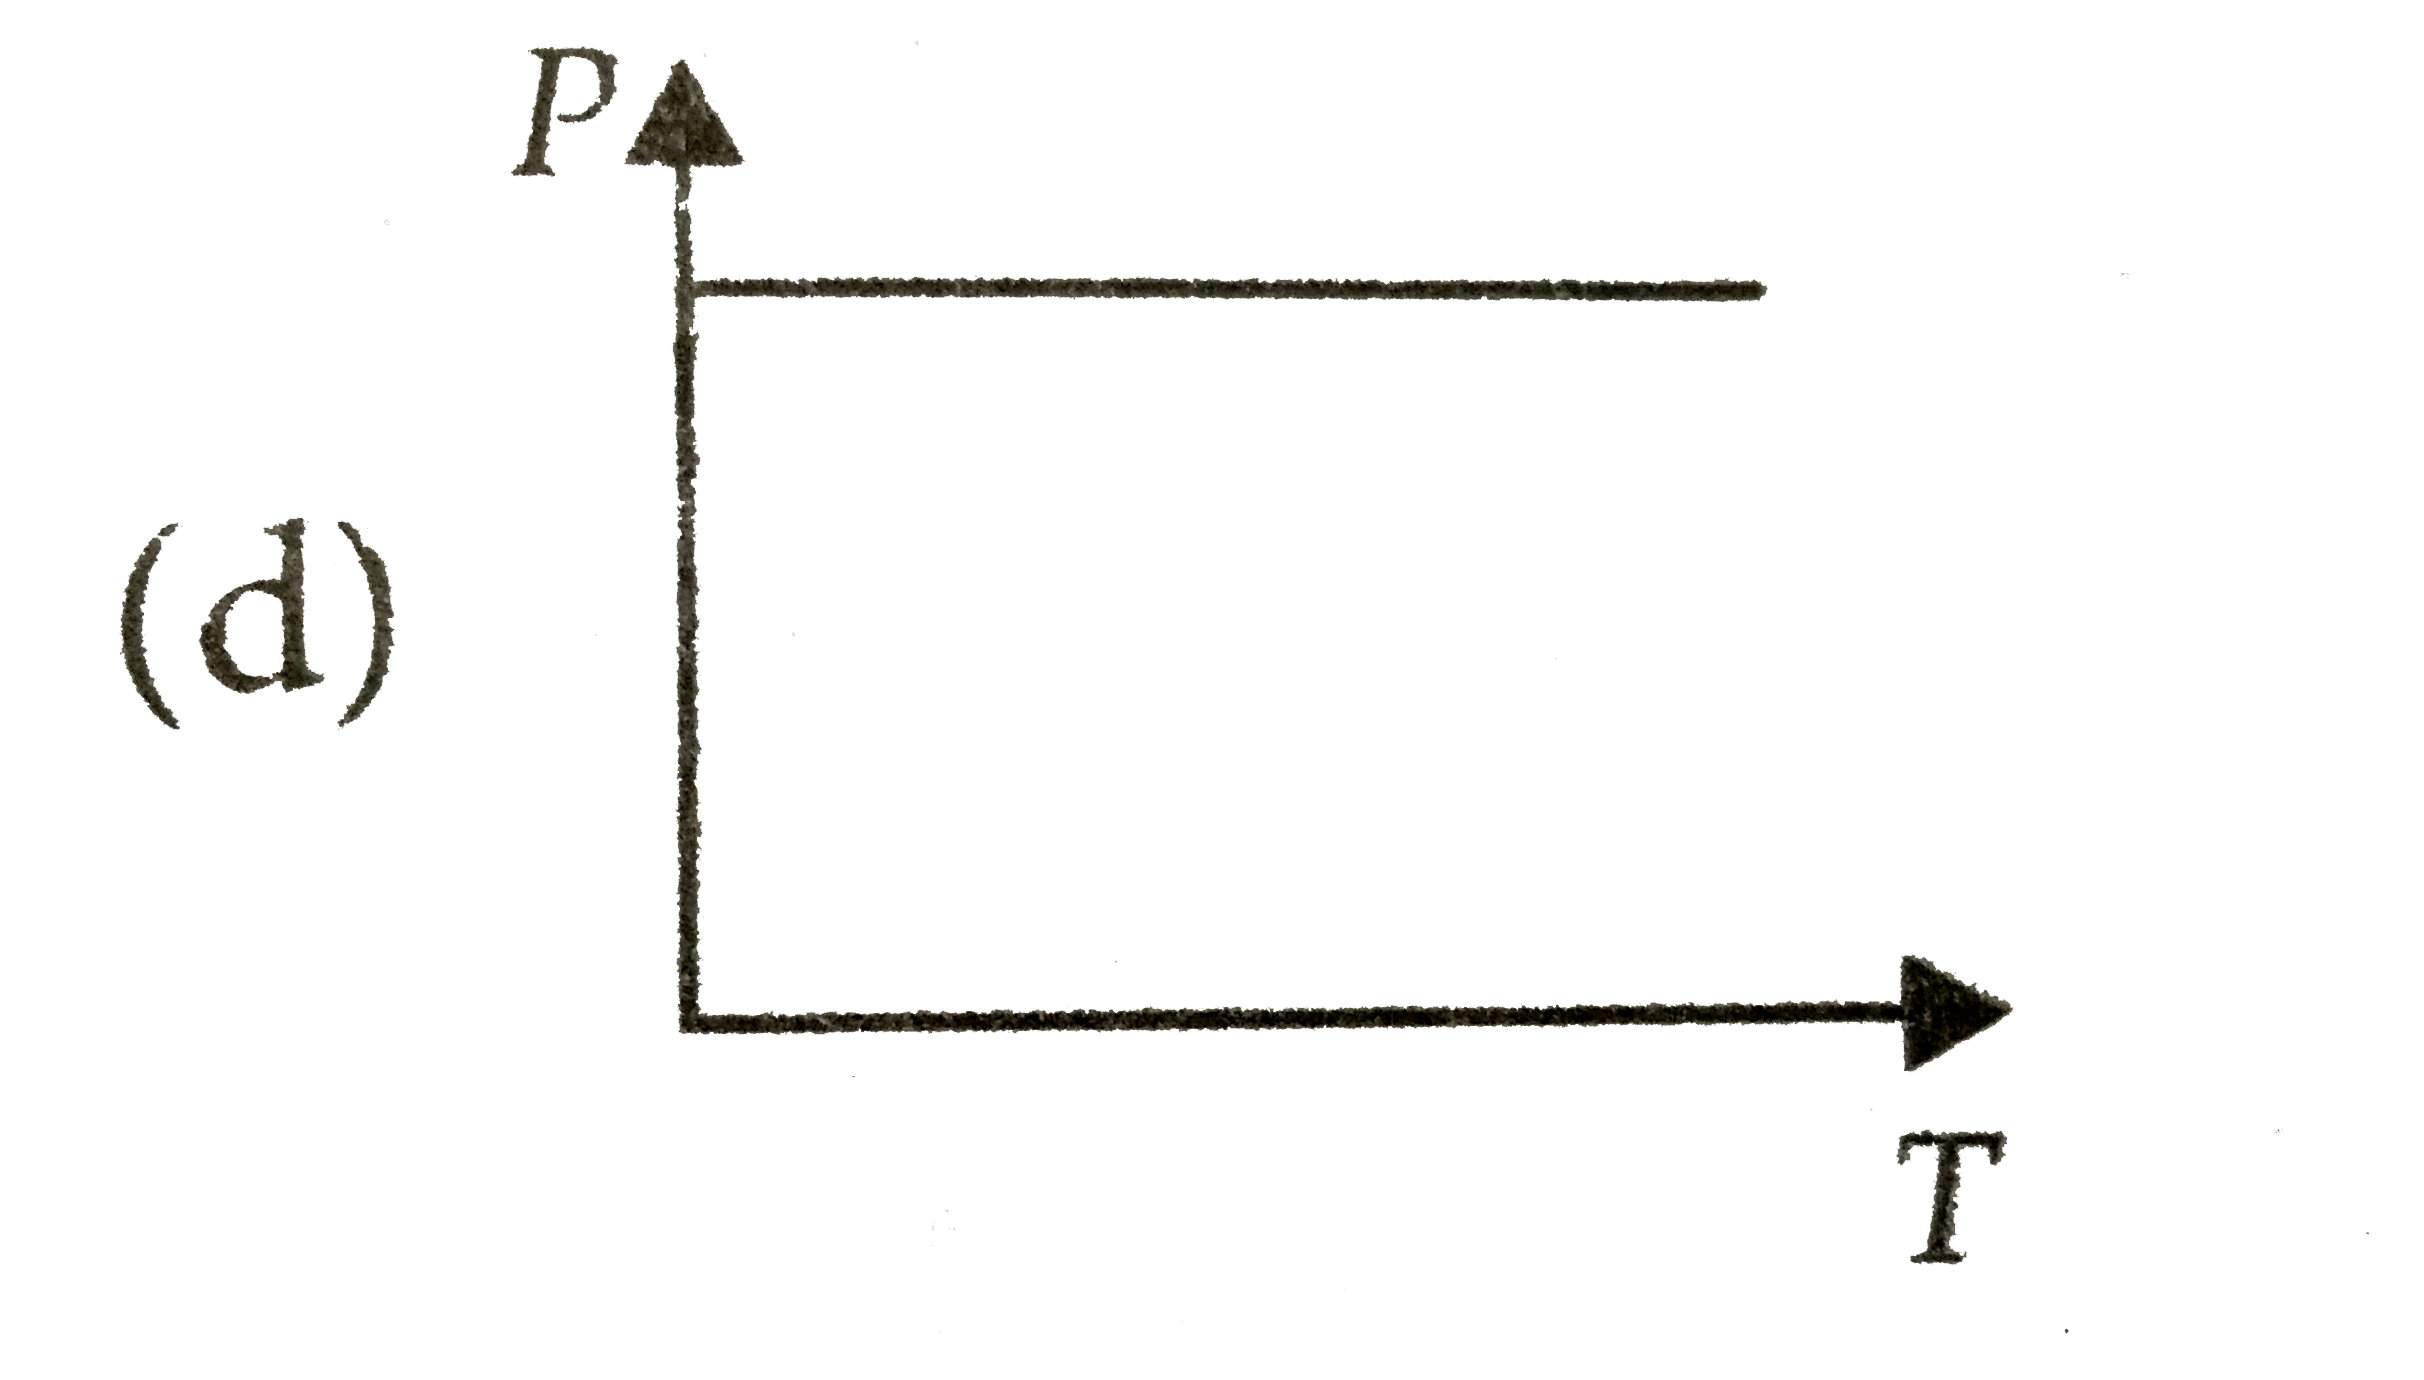
The correct Answer is:C
To determine which P-V diagram represents an isometric process, we need to understand what an isometric process is. An isometric process, also known as an isochoric process, is one in which the volume remains constant.
1. Understand the Isometric Process:
- An isometric process is characterized by constant volume. This means that during the process, the volume of the gas does not change.
2. Ideal Gas Law:
- The ideal gas law is given by the equation PV=nRT, where P is pressure, V is volume, n is the number of moles of gas, R is the ideal gas constant, and T is temperature.
- For an isometric process, since the volume V is constant, we can rearrange the ideal gas law to express pressure in terms of temperature:
P=nRVT
- Here, nRV is a constant (let's call it k), so we can write:
P=kT
- This indicates that pressure P is directly proportional to temperature T.
3. Identify the Graph:
- In a P-V diagram, if the volume is constant, the graph will be a vertical line. This is because, for a given volume, pressure can change with temperature, but the volume does not change.
- Therefore, we need to look for a graph that shows a vertical line, indicating that as temperature increases, pressure increases while the volume remains constant.
4. Analyze the Options:
- Option A: If T increases and P decreases, this is not an isometric process.
- Option B: Similar to option A, if T increases and P decreases, this is also not an isometric process.
- Option C: If T increases and P increases, this indicates a constant volume process, which is characteristic of an isometric process.
- Option D: If P is constant while T increases, this represents an isobaric process, not an isometric process.
5. Conclusion:
- Based on the analysis, Option C is the correct representation of an isometric process.
Final Answer:
The correct P-V diagram that represents an isometric process is Option C.
- An isometric process is characterized by constant volume. This means that during the process, the volume of the gas does not change.
- The ideal gas law is given by the equation PV=nRT, where P is pressure, V is volume, n is the number of moles of gas, R is the ideal gas constant, and T is temperature.
- For an isometric process, since the volume V is constant, we can rearrange the ideal gas law to express pressure in terms of temperature:
P=nRVT
- Here, nRV is a constant (let's call it k), so we can write:
P=kT
- This indicates that pressure P is directly proportional to temperature T.
- In a P-V diagram, if the volume is constant, the graph will be a vertical line. This is because, for a given volume, pressure can change with temperature, but the volume does not change.
- Therefore, we need to look for a graph that shows a vertical line, indicating that as temperature increases, pressure increases while the volume remains constant.
- Option A: If T increases and P decreases, this is not an isometric process.
- Option B: Similar to option A, if T increases and P decreases, this is also not an isometric process.
- Option C: If T increases and P increases, this indicates a constant volume process, which is characteristic of an isometric process.
- Option D: If P is constant while T increases, this represents an isobaric process, not an isometric process.
- Based on the analysis, Option C is the correct representation of an isometric process.
The correct P-V diagram that represents an isometric process is Option C.
Topper's Solved these Questions
- THERMODYNAMICSBOOK - NCERT FINGERTPS ENGLISHCHAPTER - THERMODYNAMICSEXERCISE - HOTs
8 Videos
- THERMODYNAMICSBOOK - NCERT FINGERTPS ENGLISHCHAPTER - THERMODYNAMICSEXERCISE - Assertion & Reason
15 Videos
- THERMAL PROPERTIES OF MATTERBOOK - NCERT FINGERTPS ENGLISHCHAPTER - THERMAL PROPERTIES OF MATTEREXERCISE - Assertion And Reason
10 Videos
- UNITS AND MEASUREMENTSBOOK - NCERT FINGERTPS ENGLISHCHAPTER - UNITS AND MEASUREMENTSEXERCISE - Assertion And Reason
15 Videos
Similar Questions
Knowledge Check
Which of the following I-V graph represents ohmic conductors?
A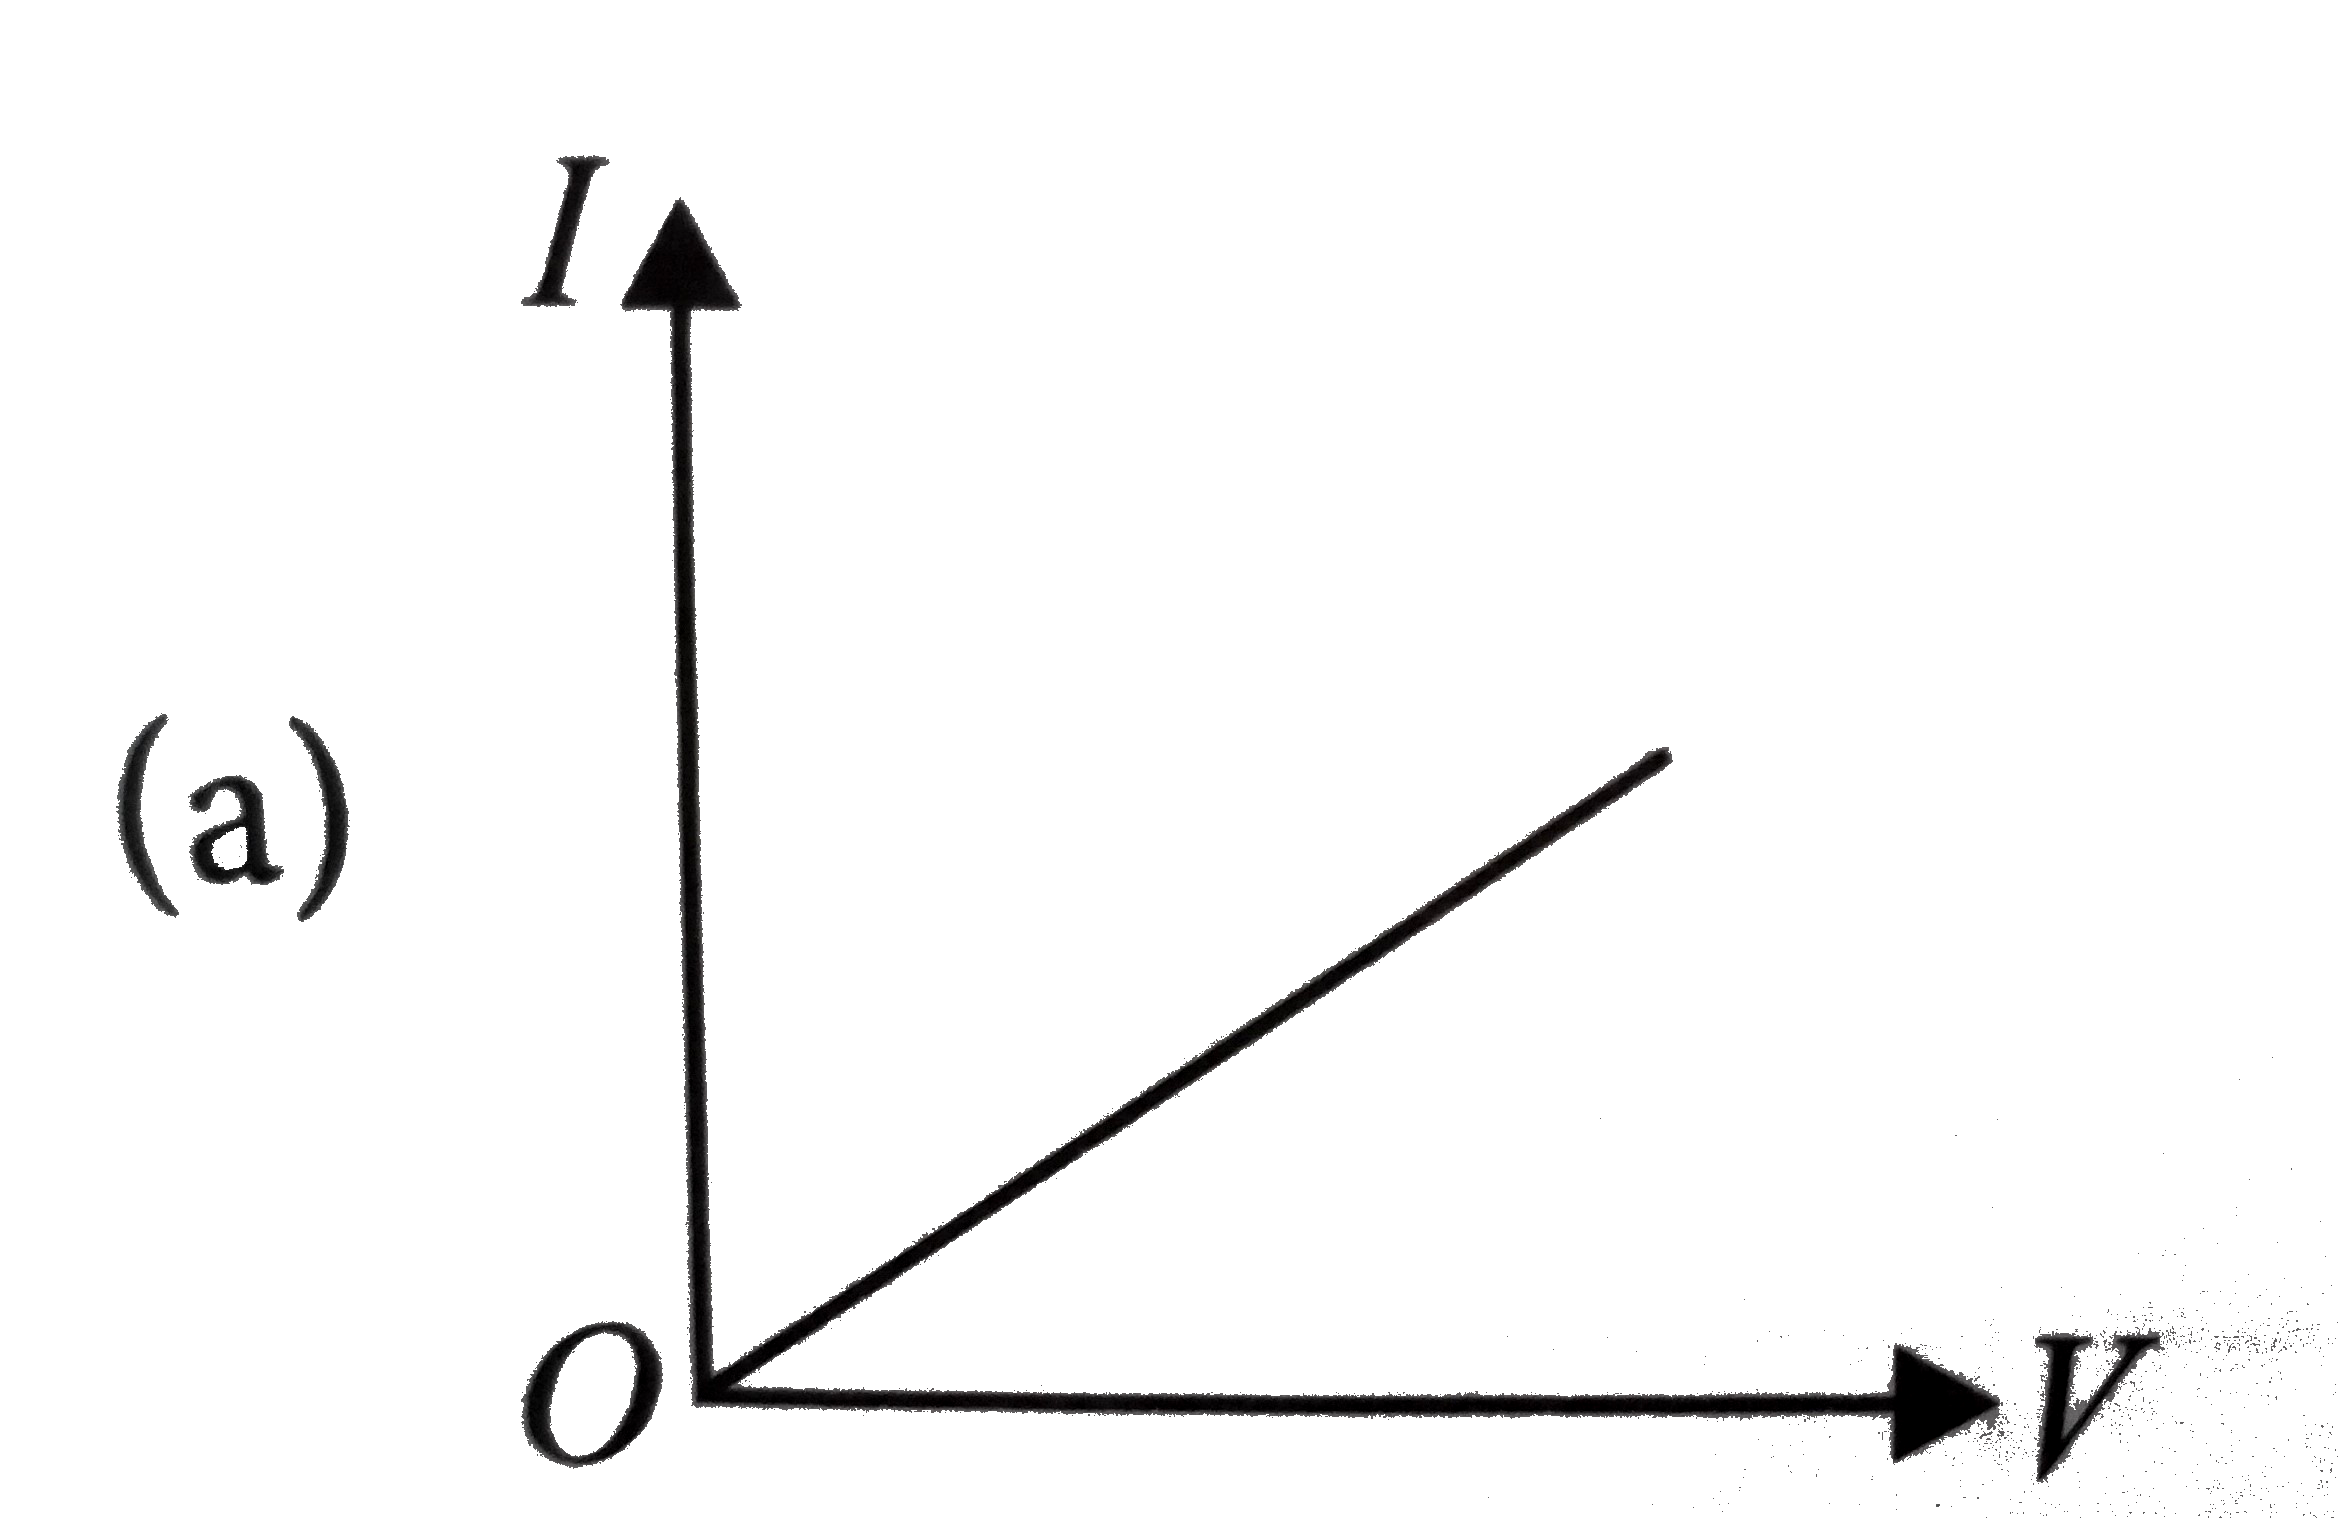 B
B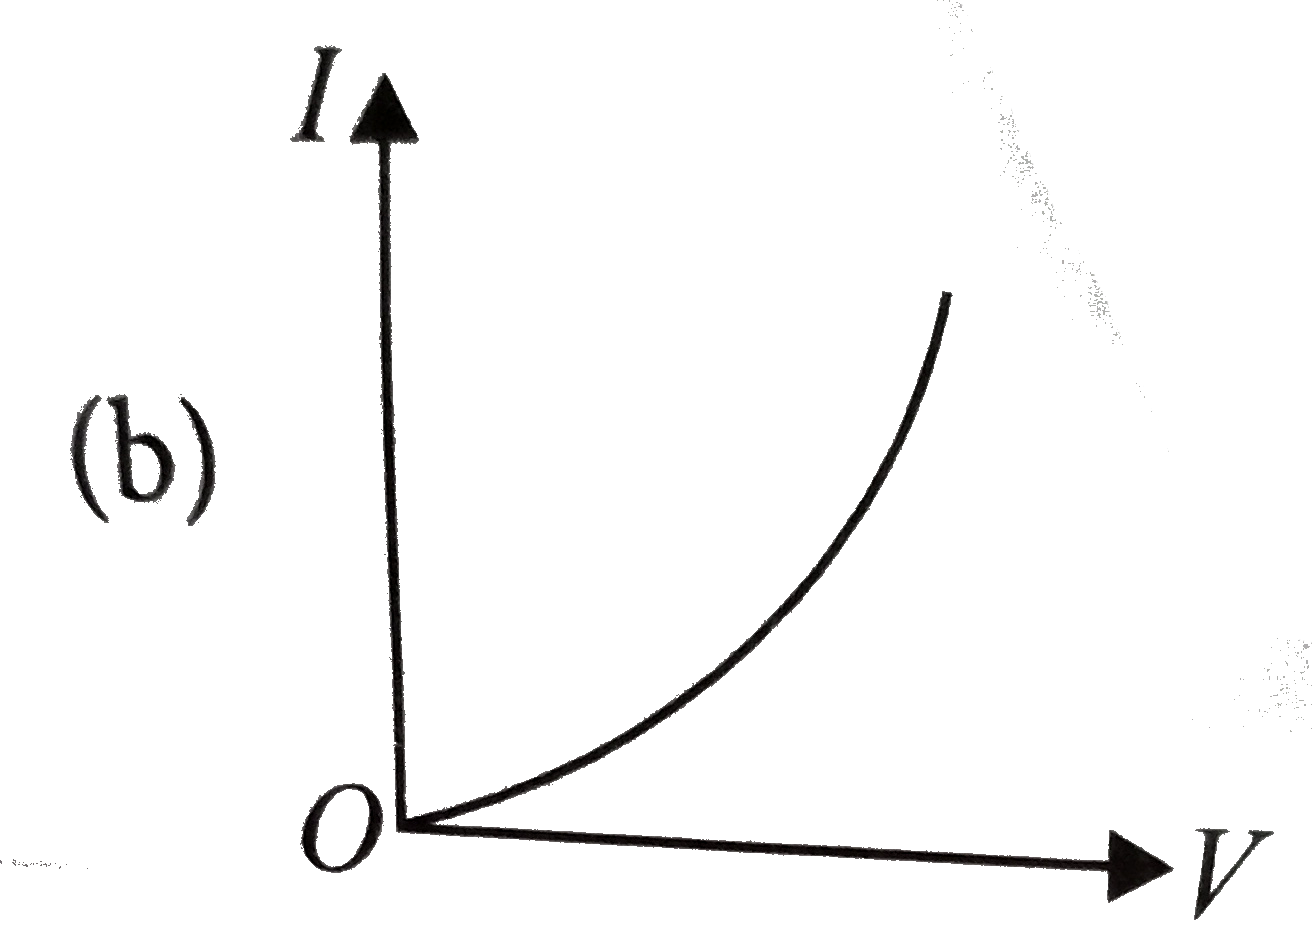 C
C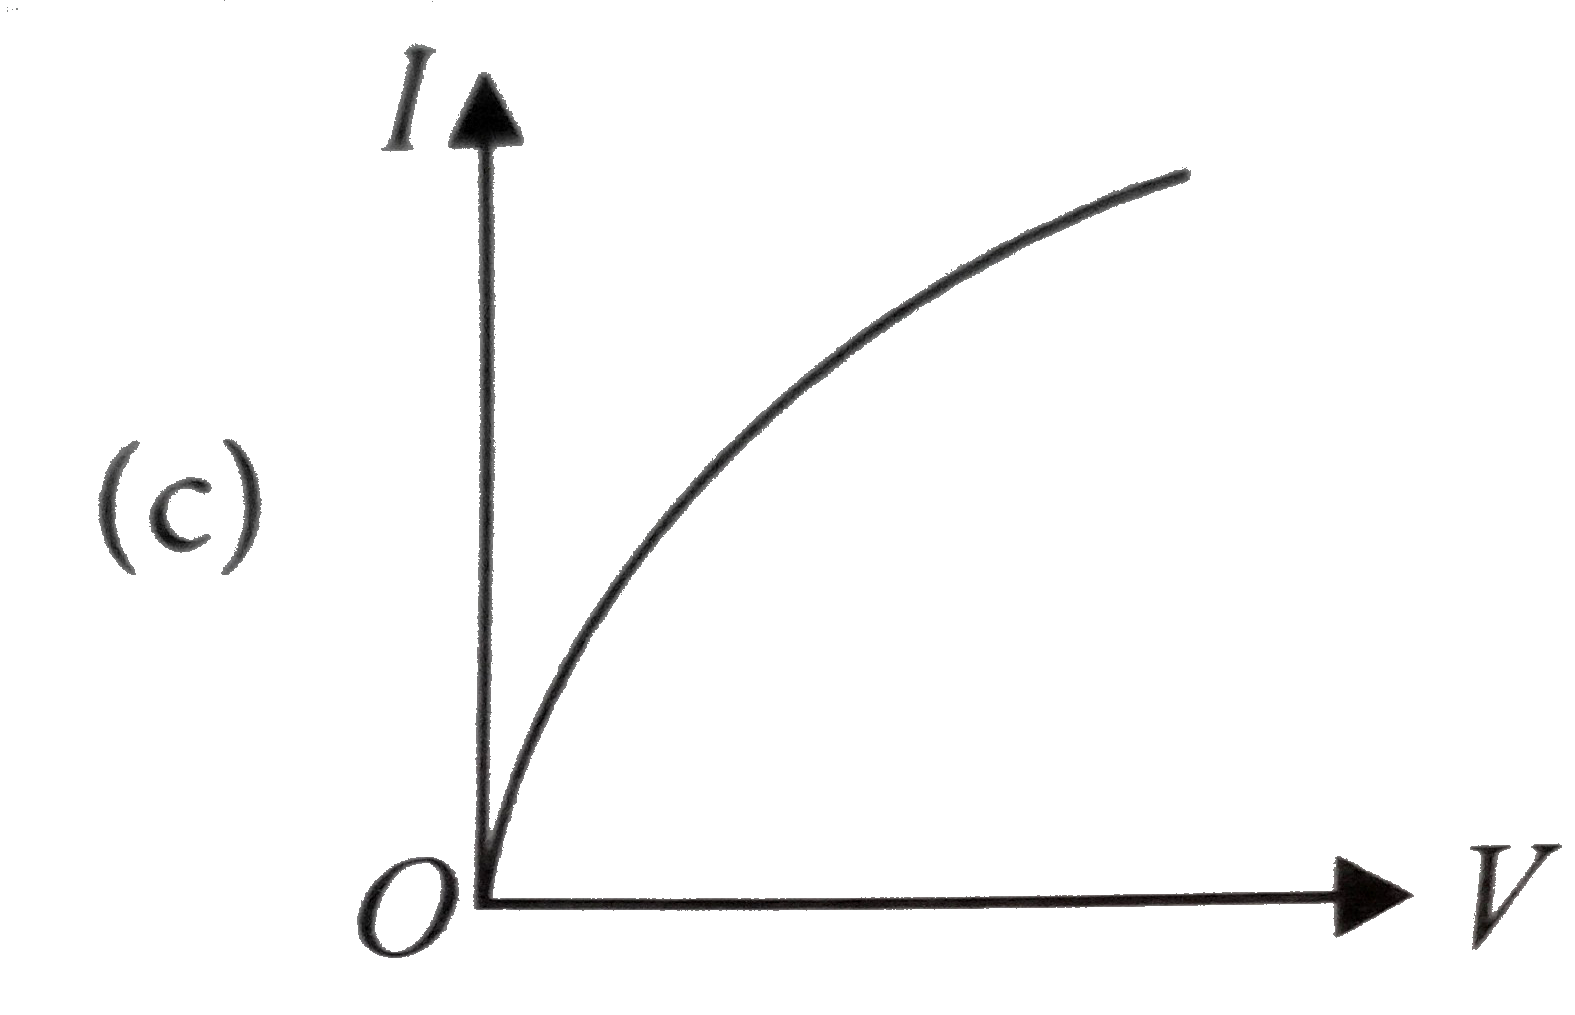 D
D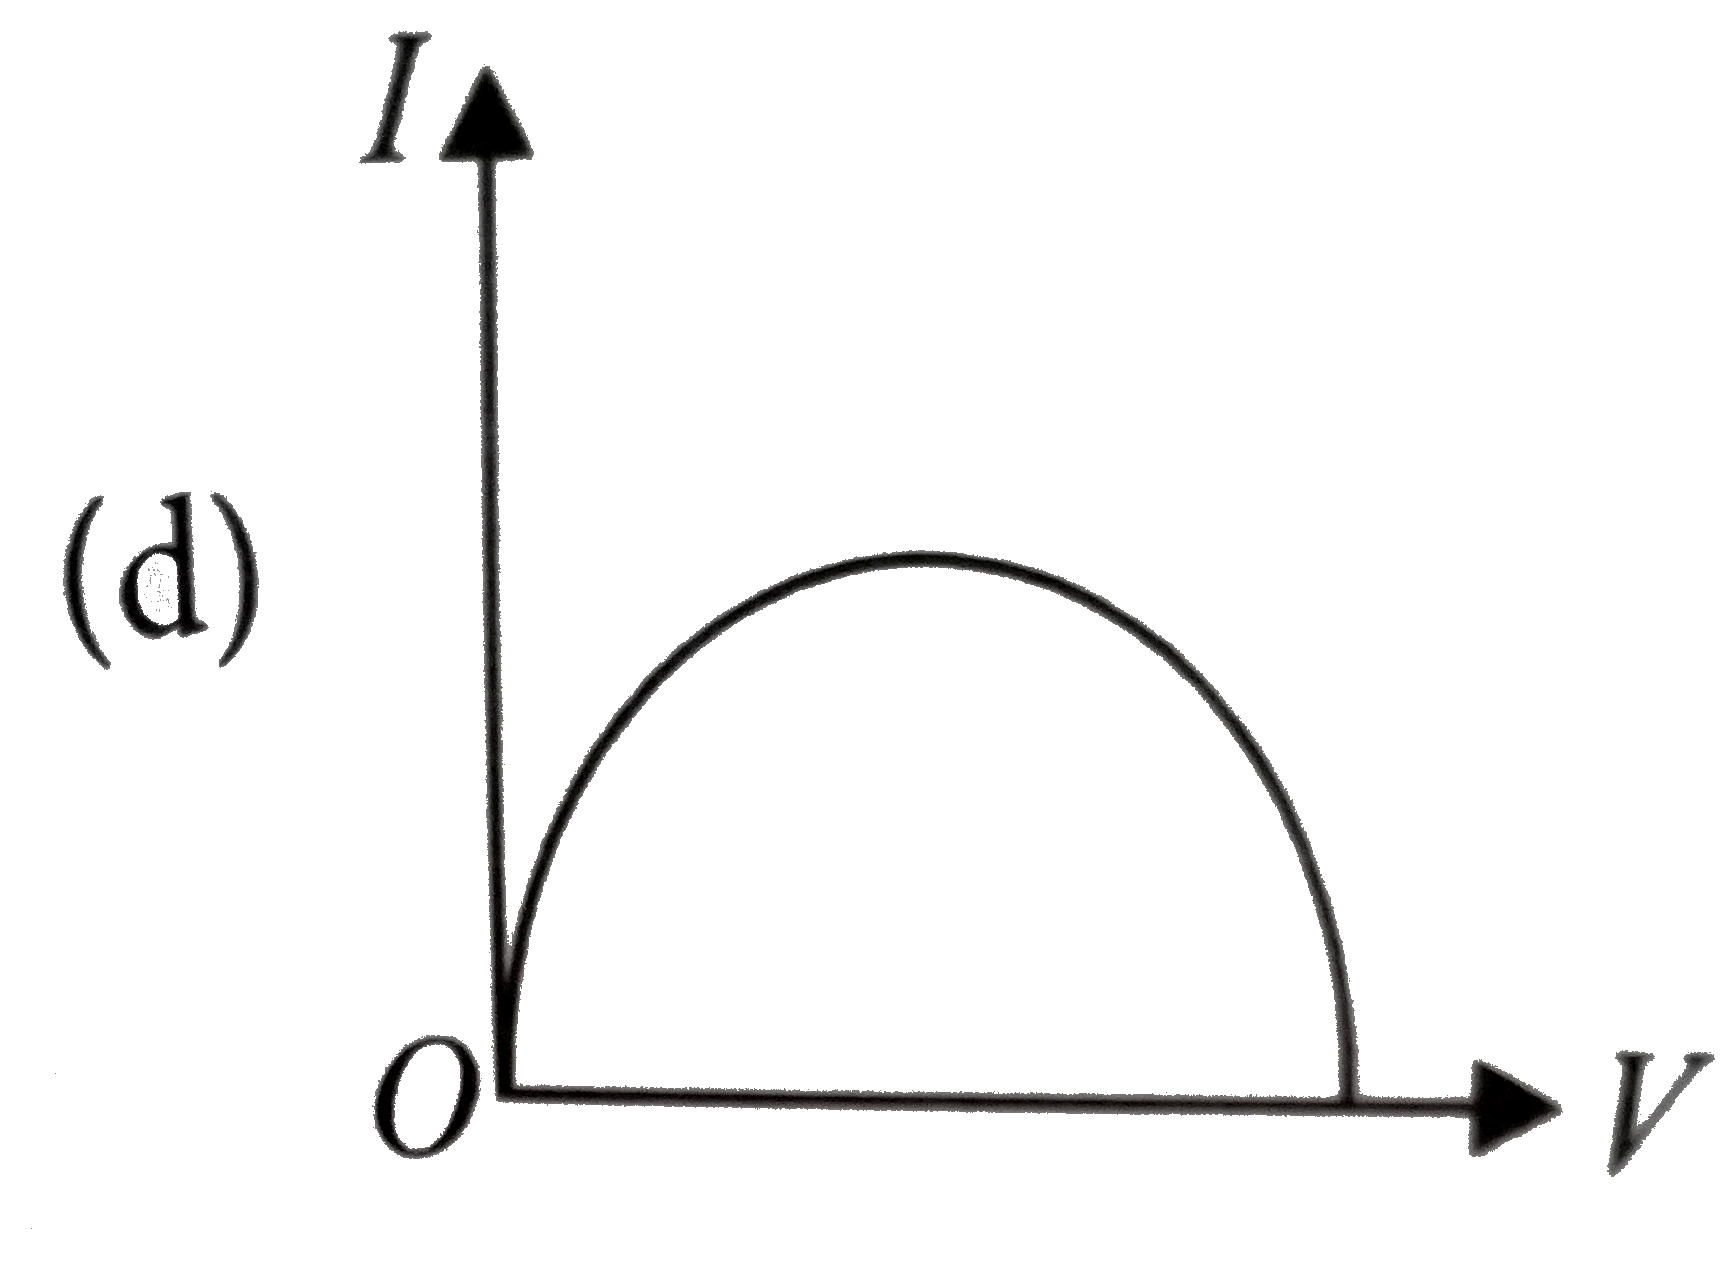
Which of the following diagrams does not represent a streamline flow?
A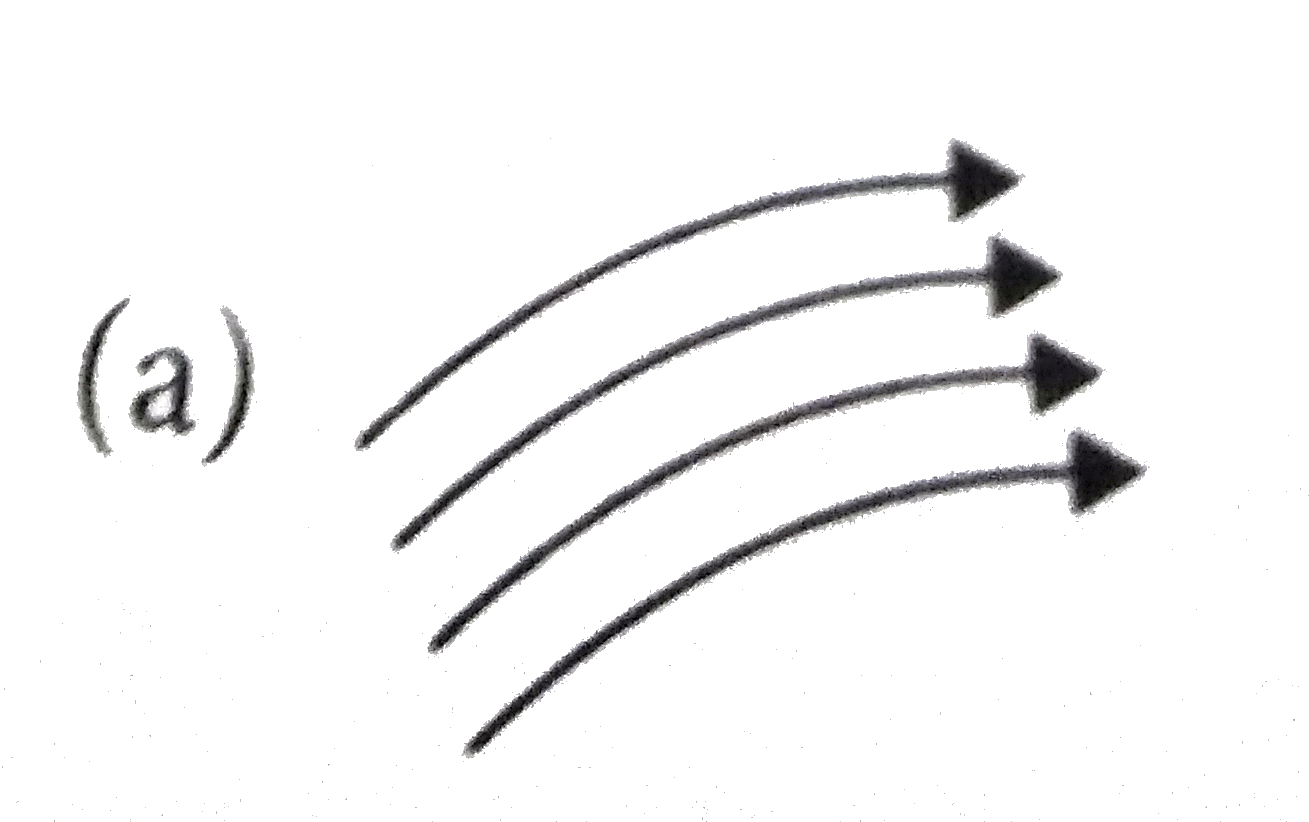 B
B C
C D
D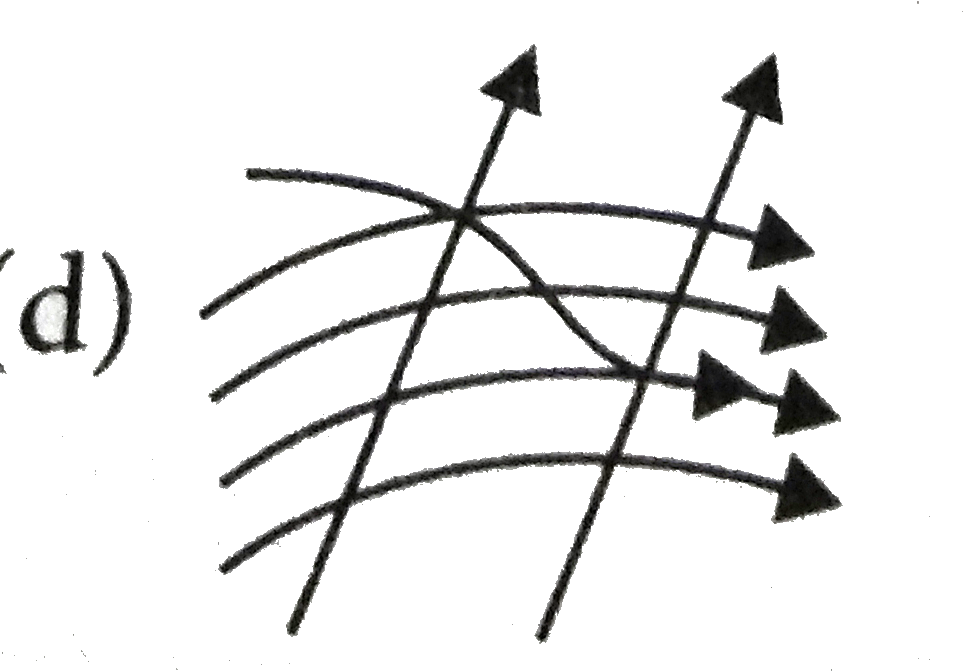
Which of the following graph represents exothermic reaction ?
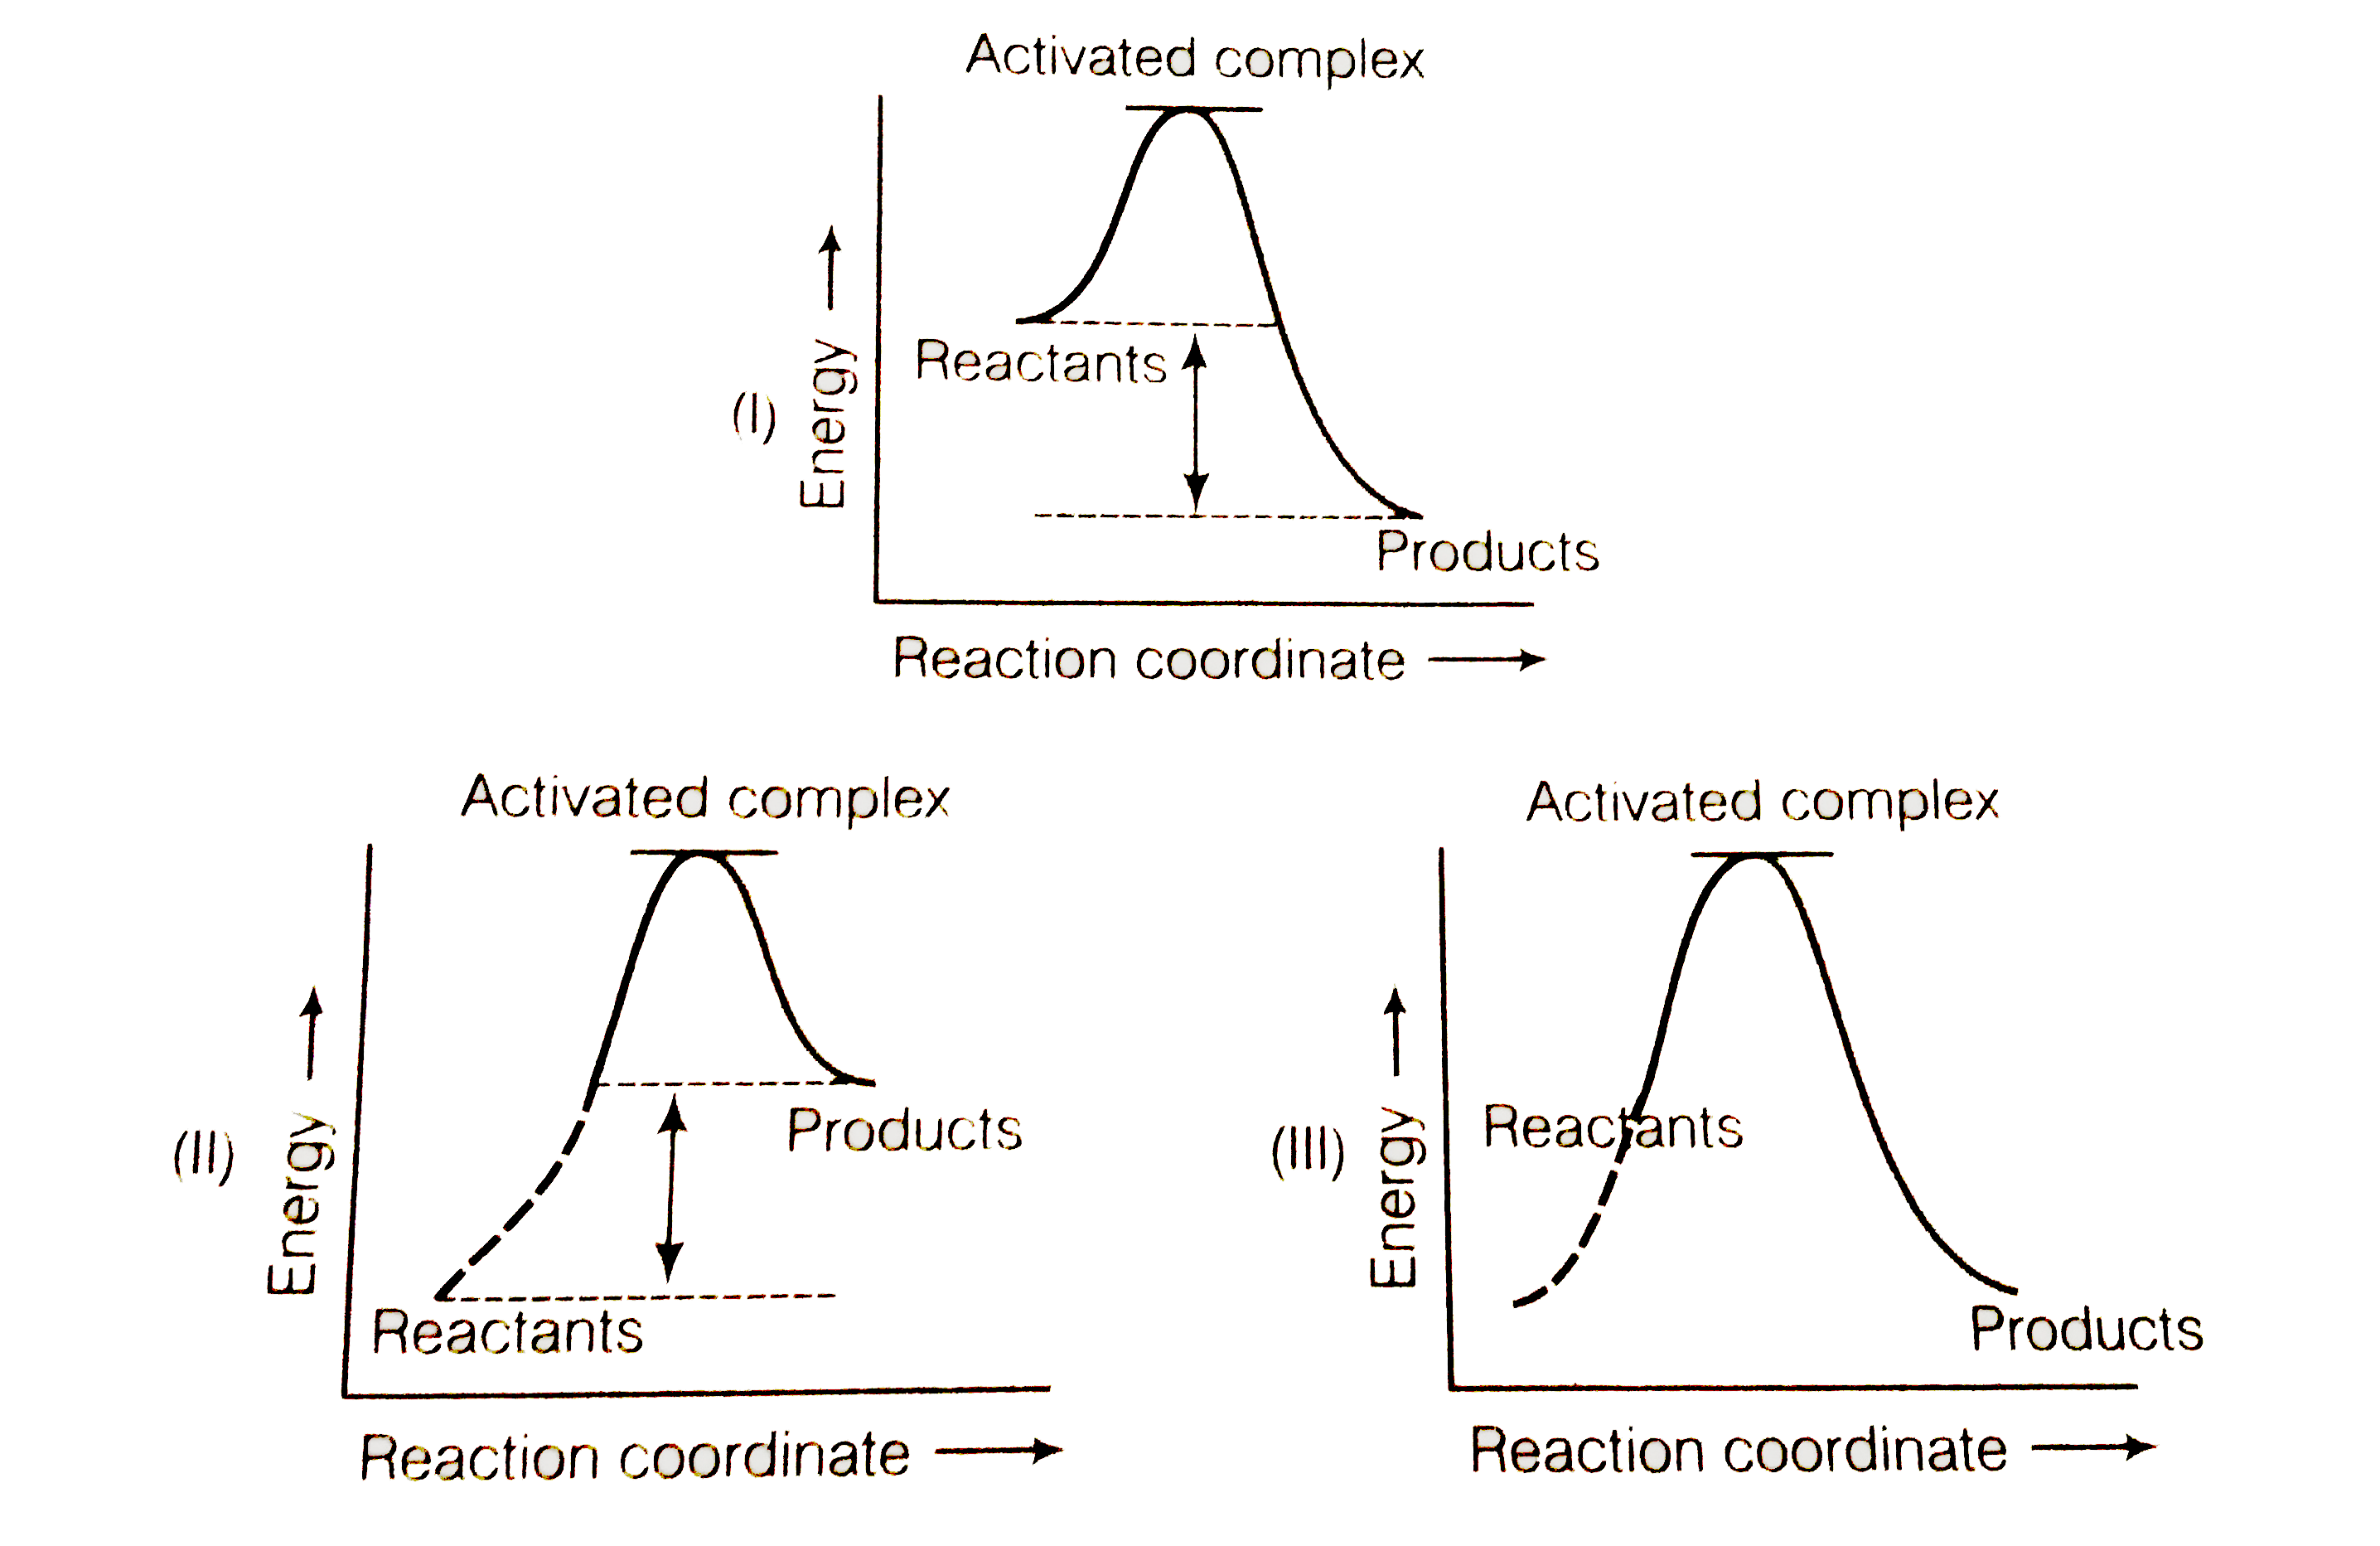
View SolutionWhich of the following diagrams does not represent a streamline flow?
View SolutionWhich of the following P-V curve best represents. As isothermal process?
View SolutionA process is shown in the diagram. Which of the following curves may represent the same process ? BC is rectangular hyperbola.
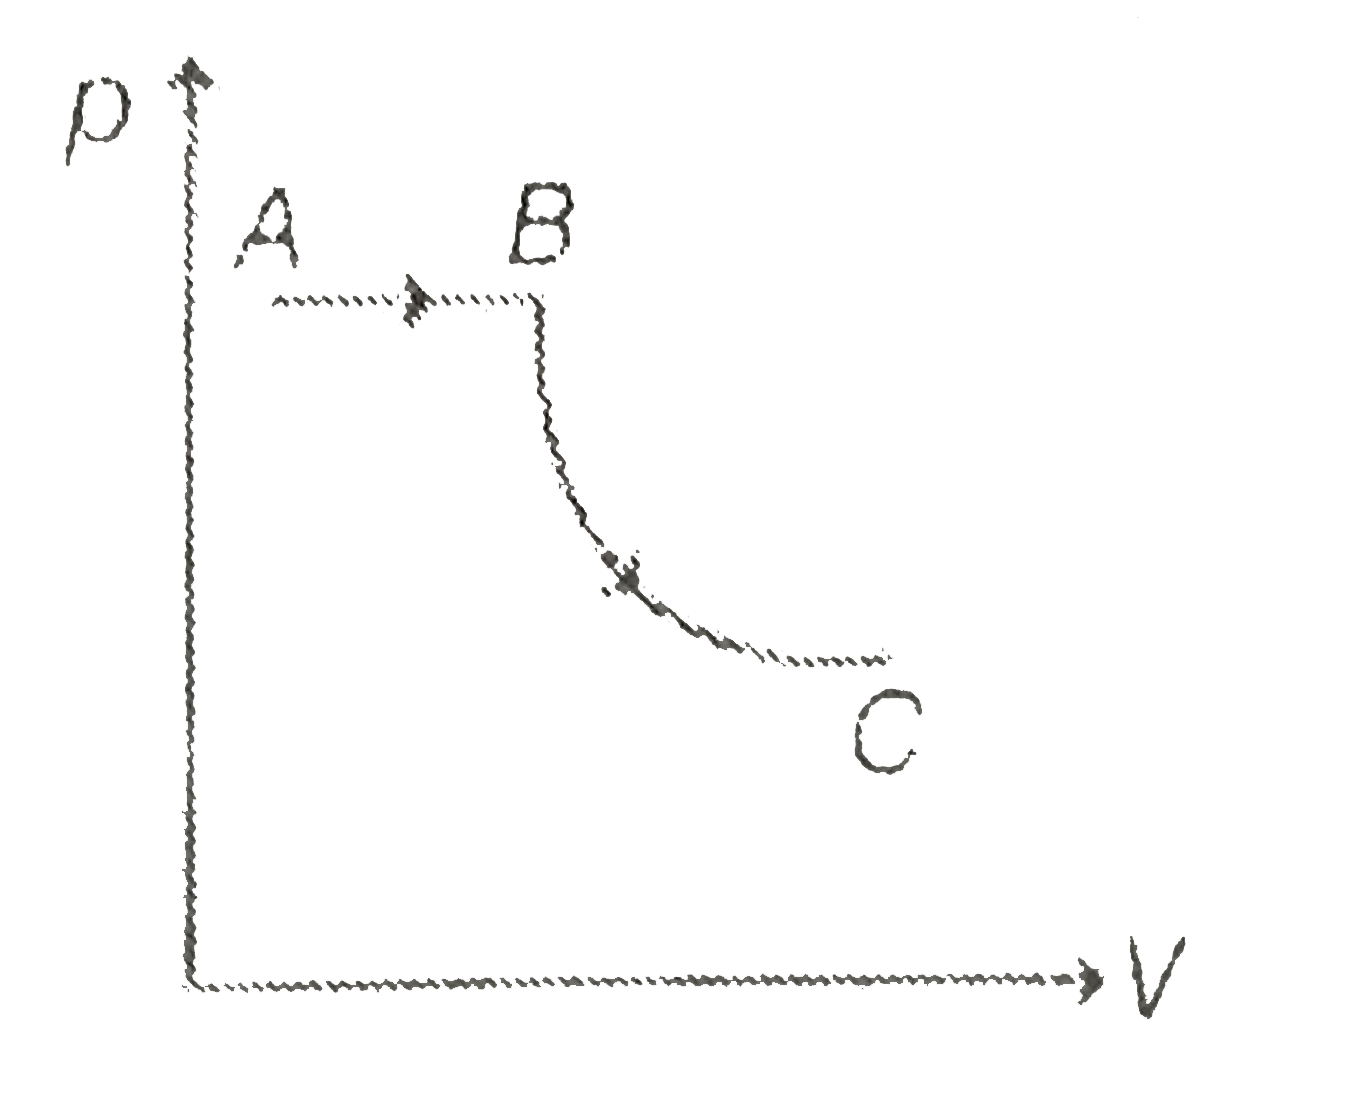
View SolutionWhich of the following graph represents v/f vs u/f graph for a virtual erect image by a diverging lens?
View SolutionWhich of the following graph represents v/f vs u/f graph for a virtual erect image by a diverging lens?
View Solution
