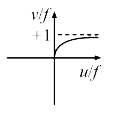
Which of the following graph represents v/f vs u/f graph for a virtual erect image by a diverging lens?
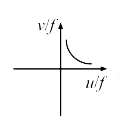
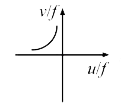
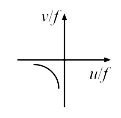
The correct Answer is:D
To solve the problem of identifying the correct graph that represents the relationship between v/f and u/f for a virtual erect image formed by a diverging lens, we can follow these steps:
1. Understand the Lens Formula: For a diverging lens, the lens formula is given by:
1f=1v+1u
Here, f is the focal length, v is the image distance, and u is the object distance. For a diverging lens, both v and u are negative.
2. Express v in terms of u: Rearranging the lens formula gives:
1v=1f−1u
This can be rewritten as:
v=fuu−f
3. Introduce Velocity and Frequency: If we consider the velocities v and u as proportional to the frequencies f and f′ respectively, we can express:
vf=fuf(u−f)
Simplifying this gives:
vf=uu−f
4. Graphical Representation: The relationship vf=uu−f suggests that as u increases, vf approaches 1. This indicates that the graph will start from the origin (0,0) and will approach a horizontal asymptote at y=1 as x approaches infinity.
5. Identify the Correct Graph: From the options provided, we need to identify a graph that starts at the origin and approaches y=1 as x increases. This will typically be a hyperbolic shape that lies in the first quadrant.
Conclusion:
The correct graph that represents the relationship v/f vs u/f for a virtual erect image by a diverging lens will have the characteristics described above.
1f=1v+1u
Here, f is the focal length, v is the image distance, and u is the object distance. For a diverging lens, both v and u are negative.
1v=1f−1u
This can be rewritten as:
v=fuu−f
vf=fuf(u−f)
Simplifying this gives:
vf=uu−f
The correct graph that represents the relationship v/f vs u/f for a virtual erect image by a diverging lens will have the characteristics described above.
Topper's Solved these Questions
- BOOK - VMC MODULES ENGLISHCHAPTER - JEE MAIN REVISION TEST - 26 (2020)EXERCISE - PHYSICS (SECTION 2)5videos
JEE MAIN REVISION TEST - 26 (2020)
- BOOK - VMC MODULES ENGLISHCHAPTER - JEE MAIN REVISION TEST - 25 | JEE - 2020EXERCISE - PHYSICS25videos
JEE MAIN REVISION TEST - 25 | JEE - 2020
- BOOK - VMC MODULES ENGLISHCHAPTER - JEE MAIN REVISION TEST - 27 - JEE -2020EXERCISE - PHYSICS (SECTION 2)5videos
JEE MAIN REVISION TEST - 27 - JEE -2020
Similar Questions
Knowledge Check
- Question 1 - Select One
Which of the following I-V graph represents ohmic conductors?
A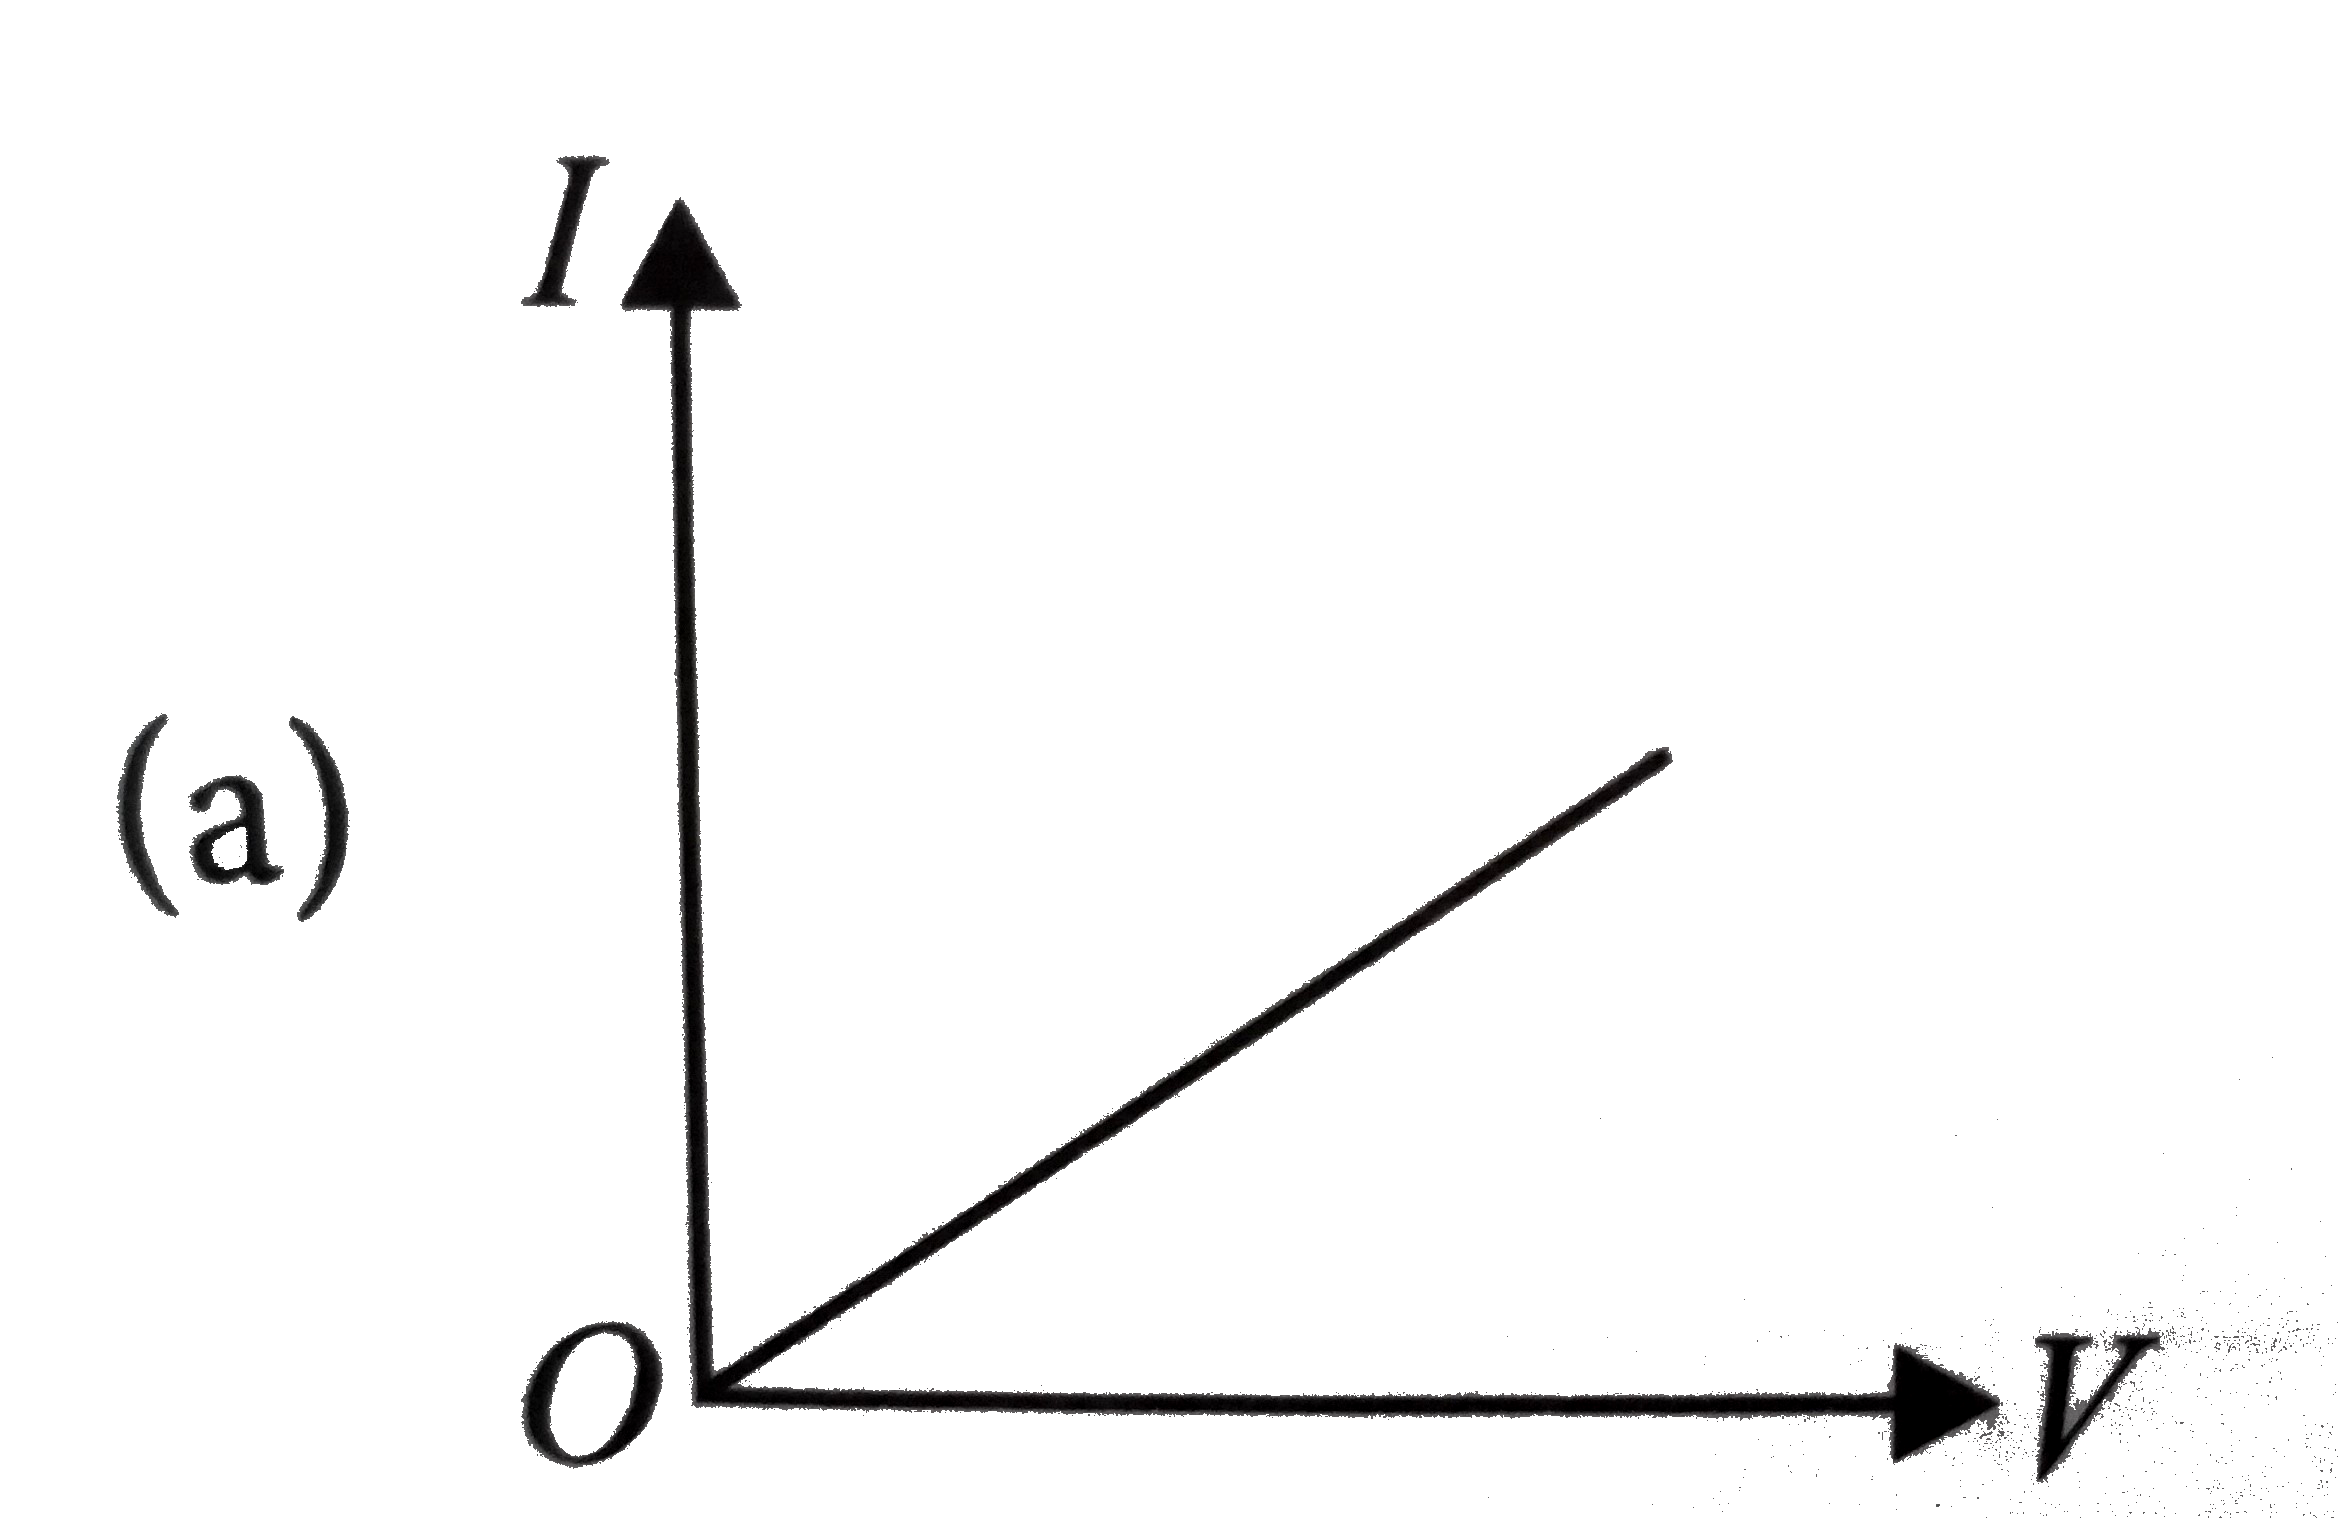 B
B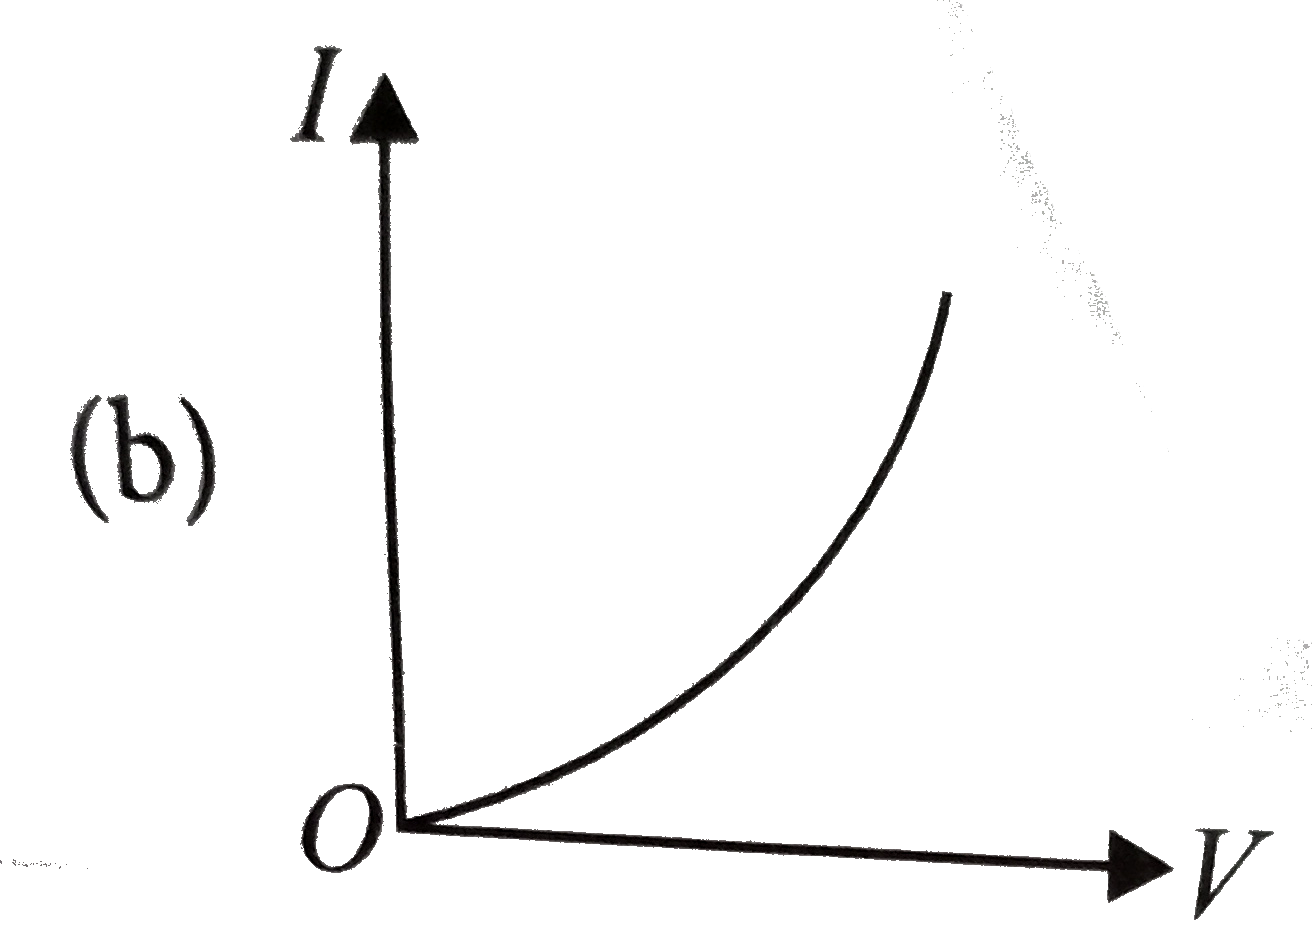 C
C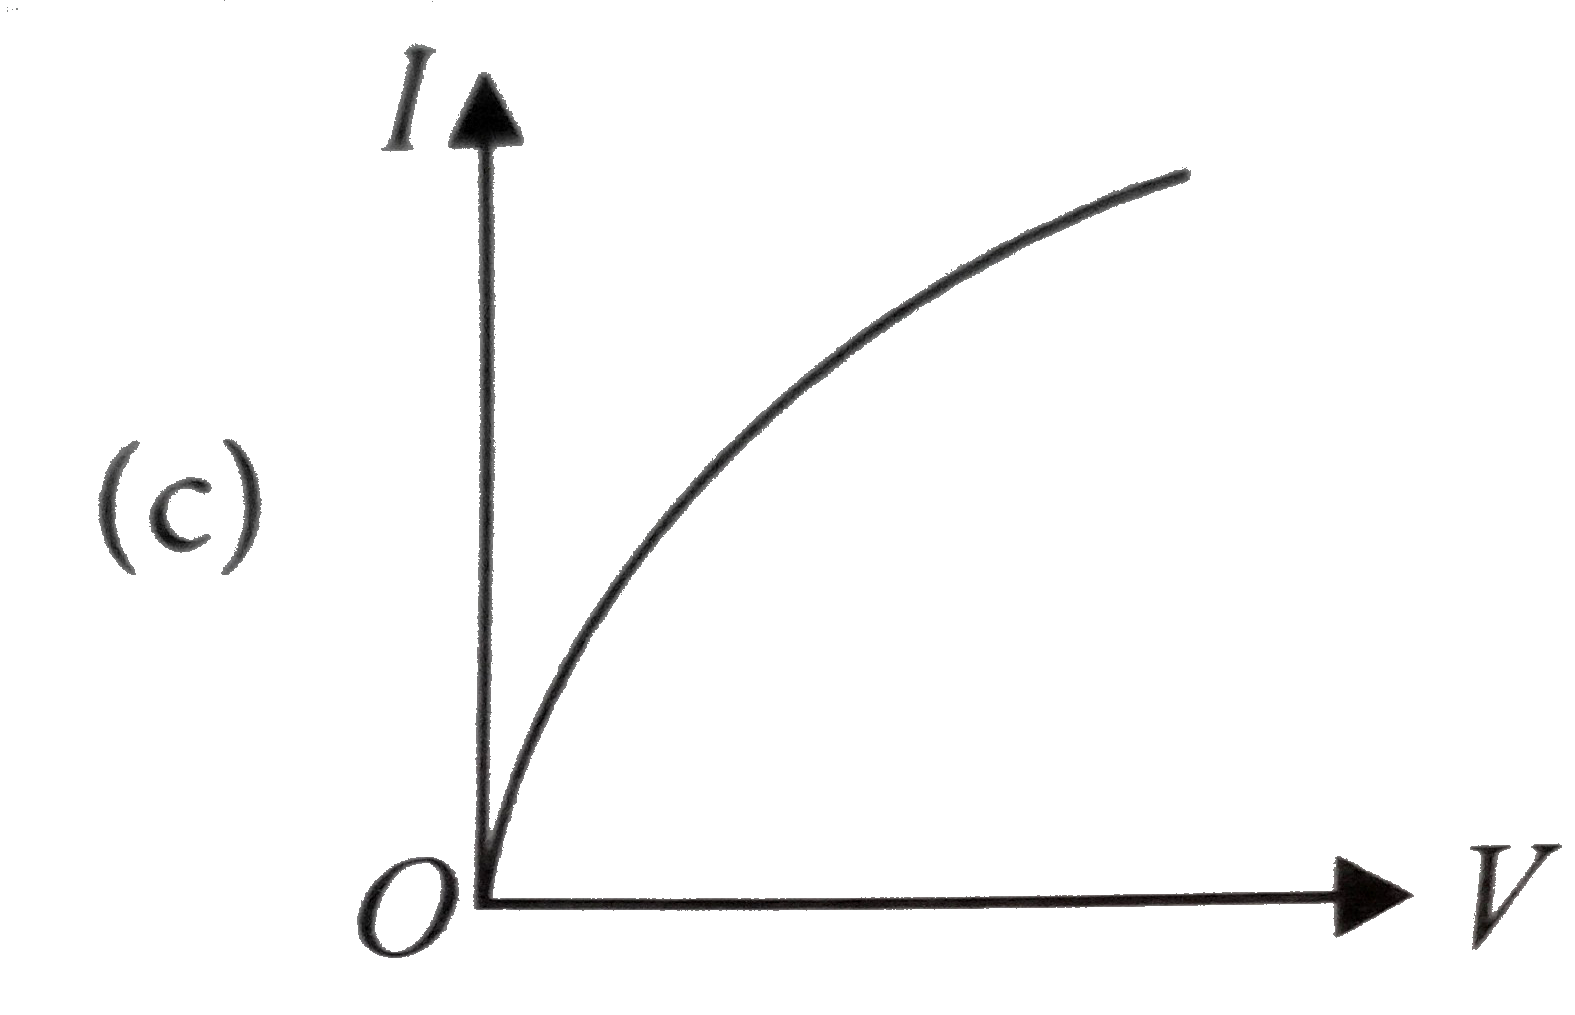 D
D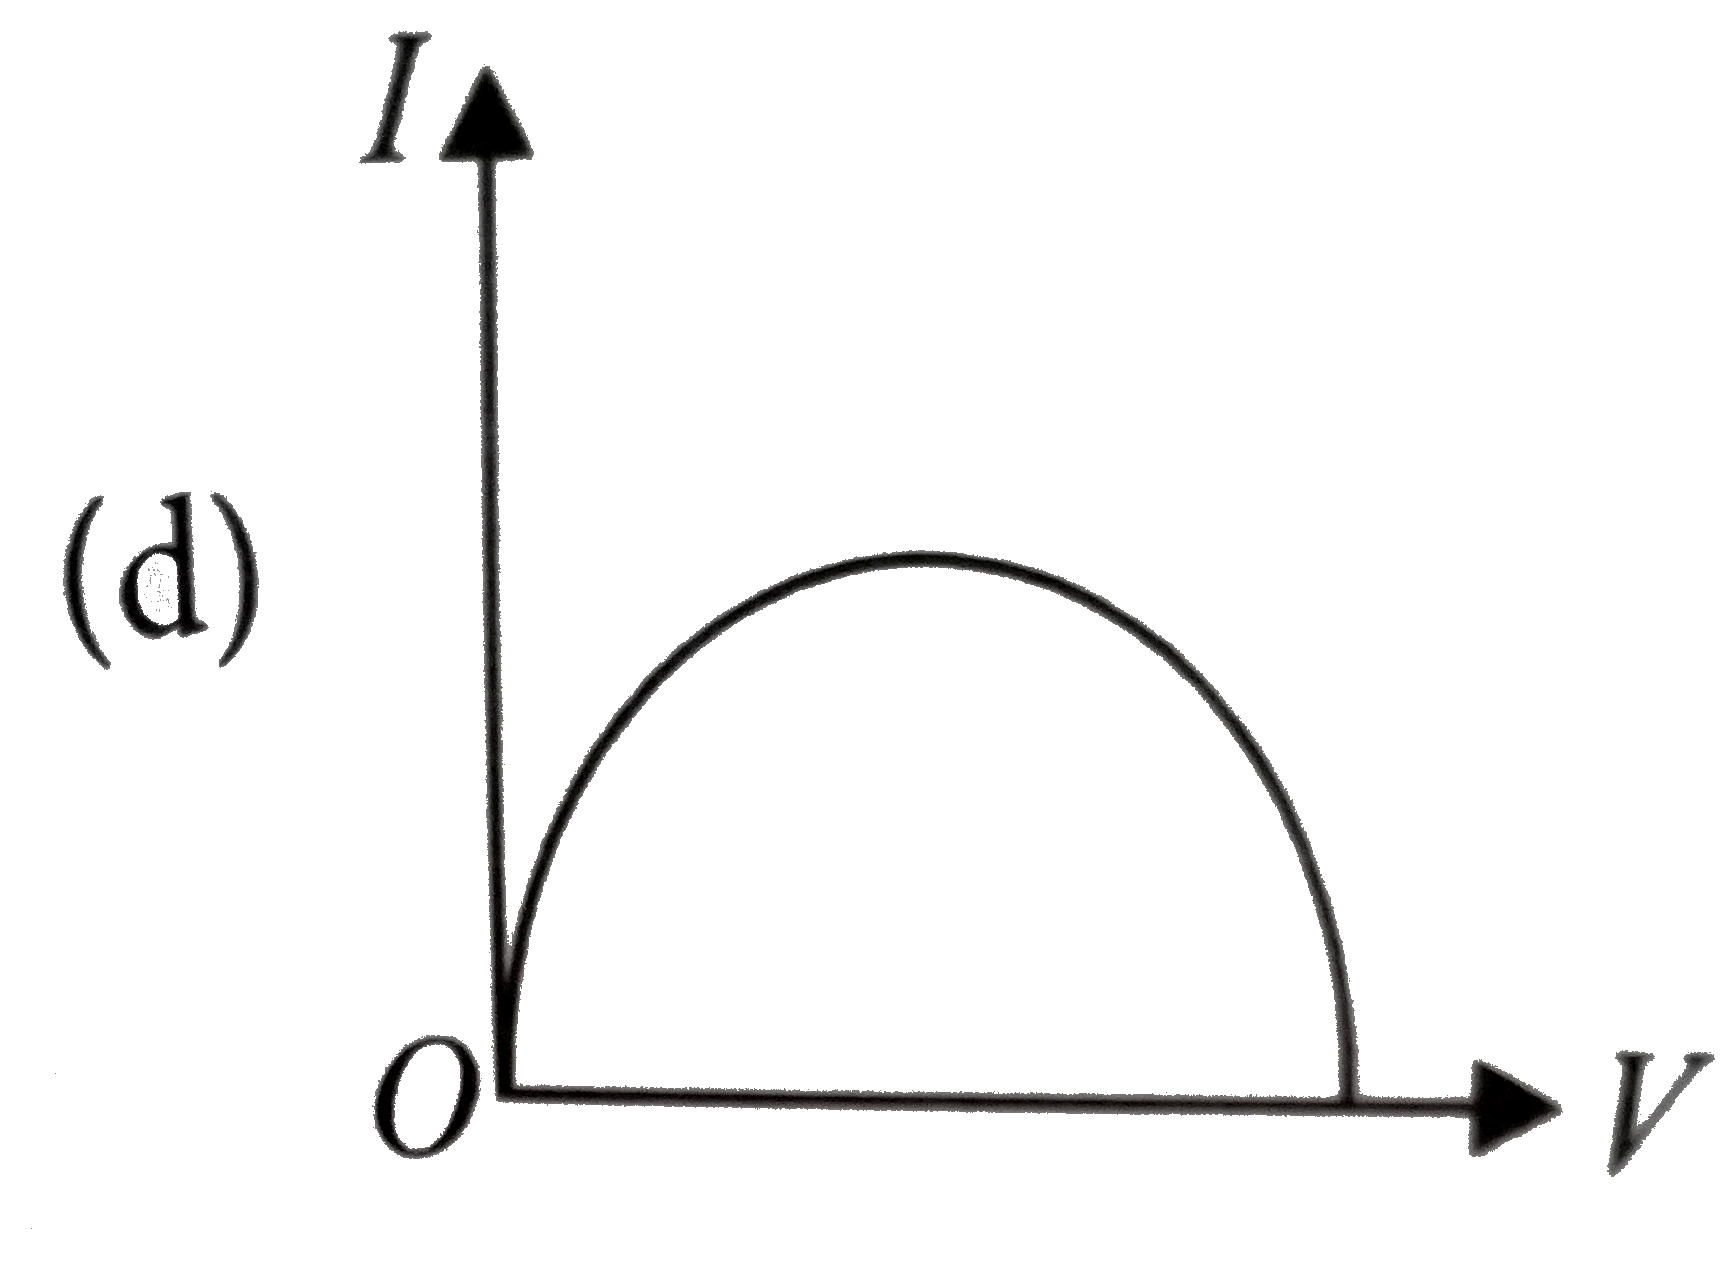
- Question 2 - Select One
Which of the following graph represents correct graph for SN1 reaction :
A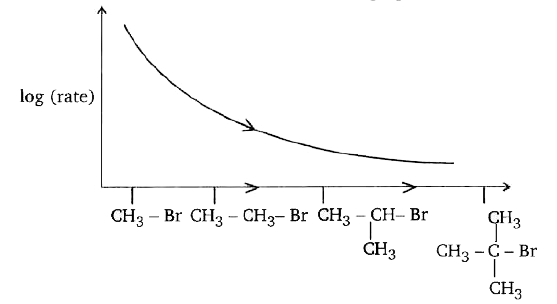 B
B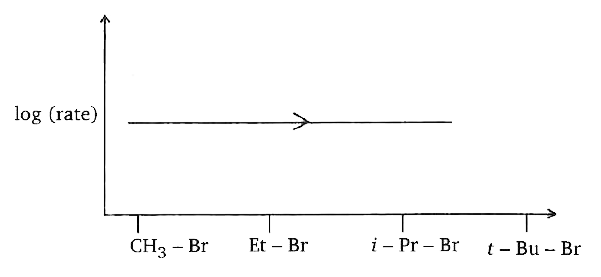 C
C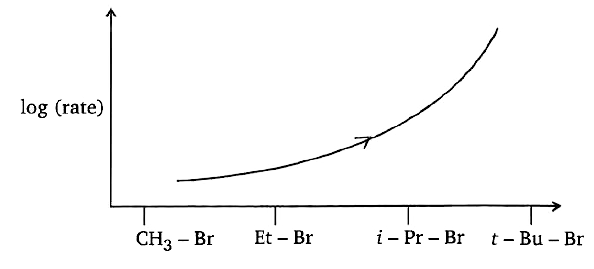 D
D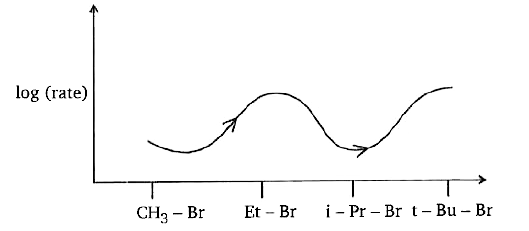
- Question 3 - Select One
Which of the following P-V diagram represent the graph of isometric process?
A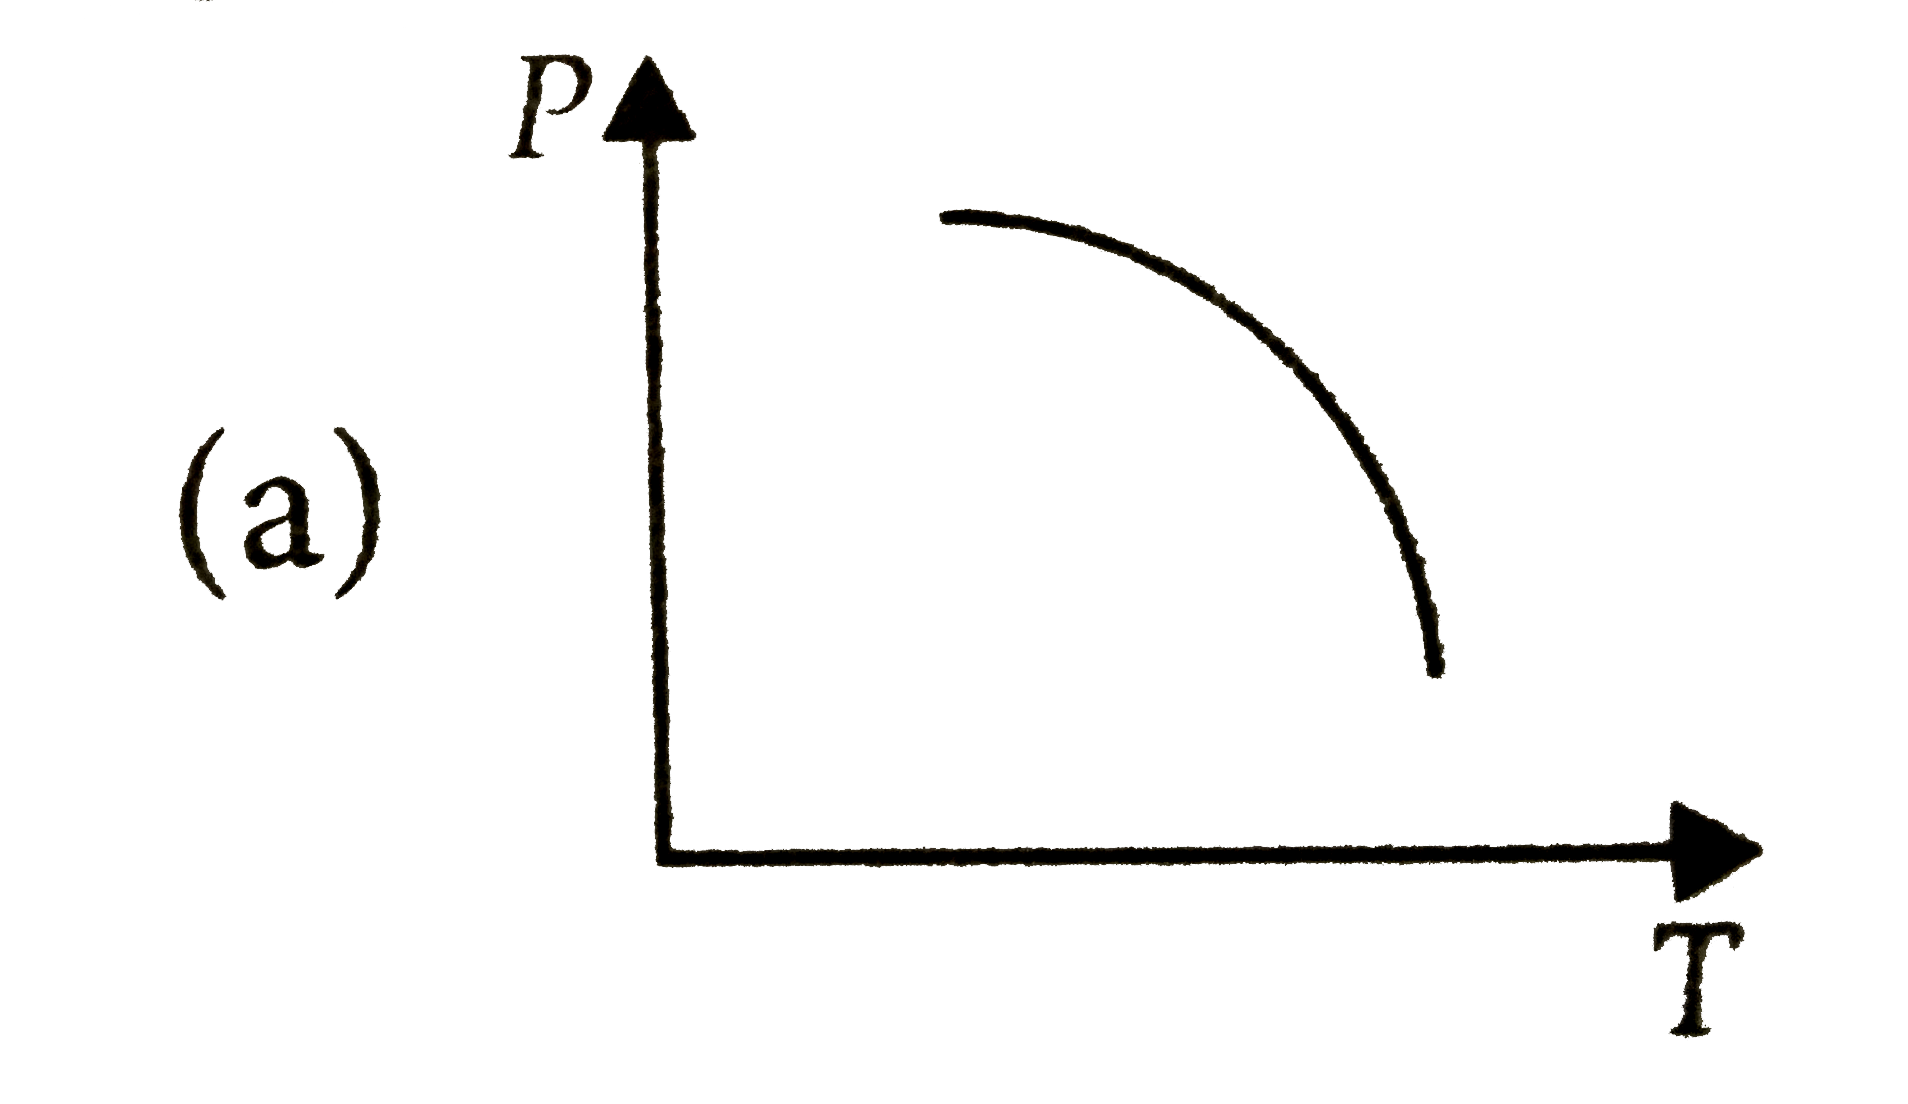 B
B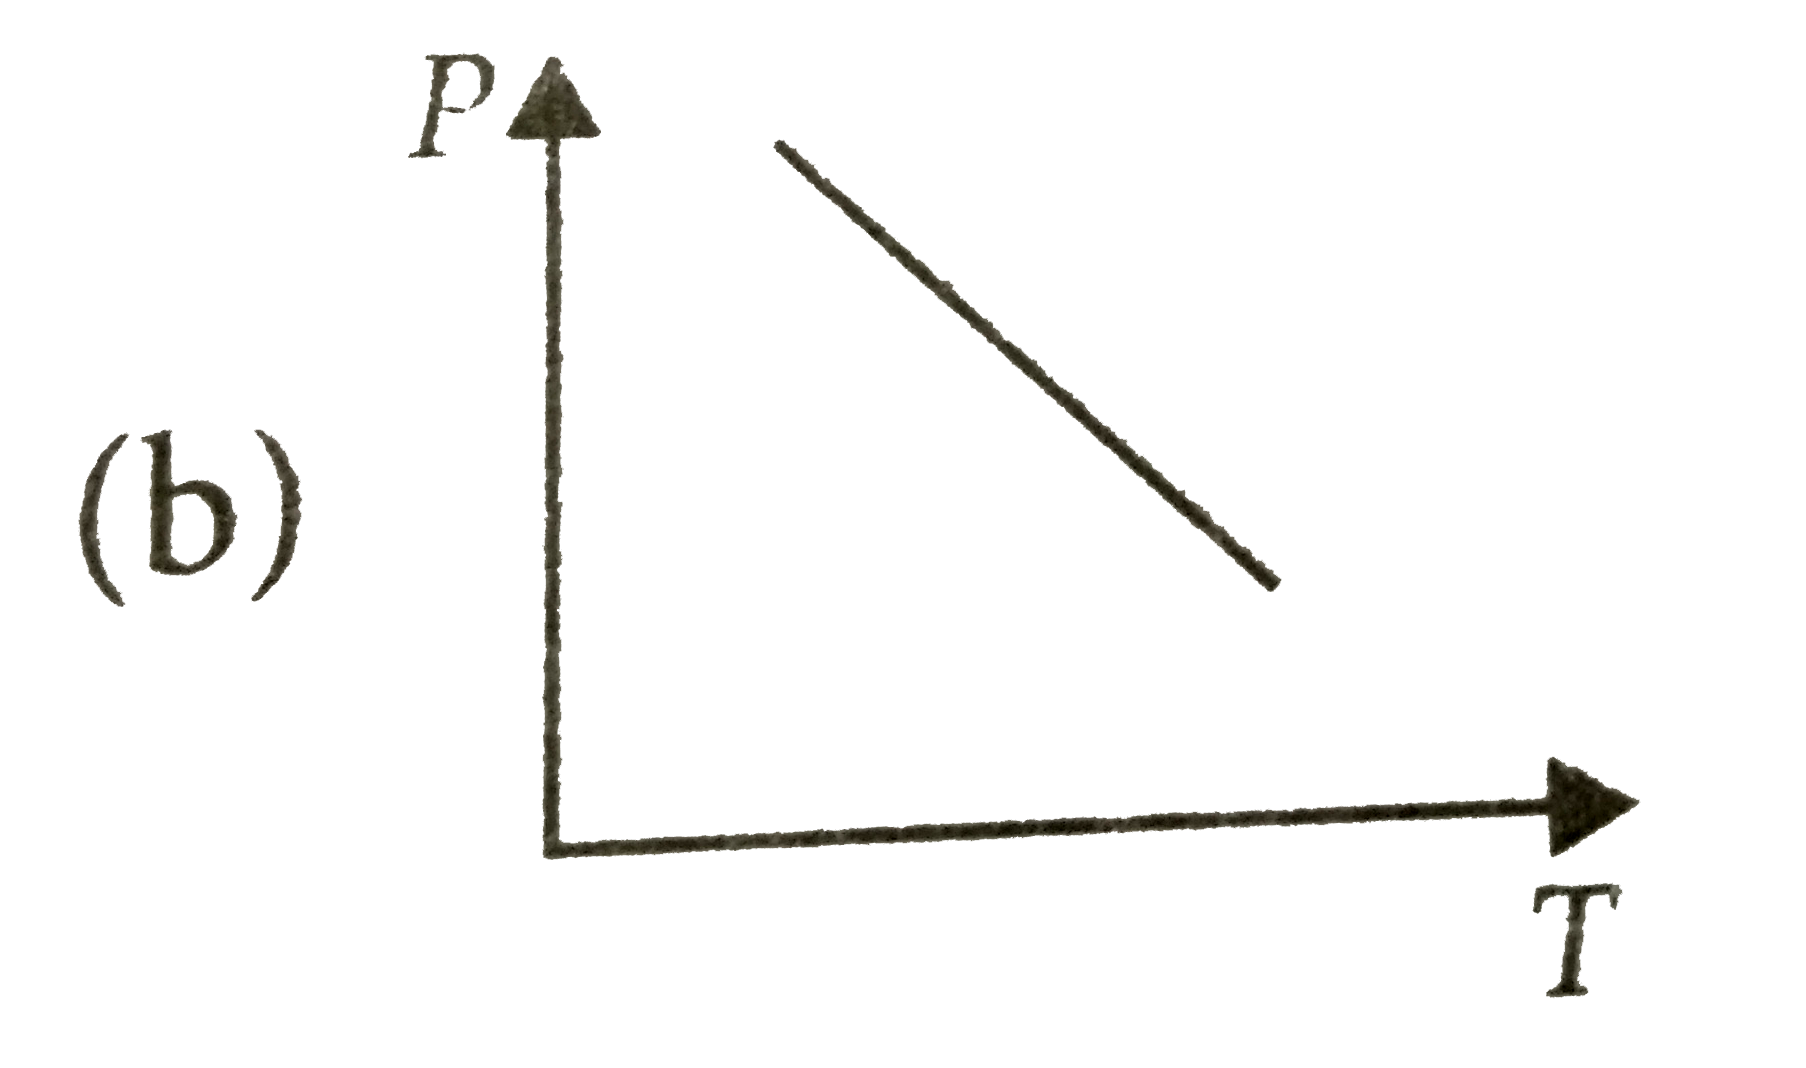 C
C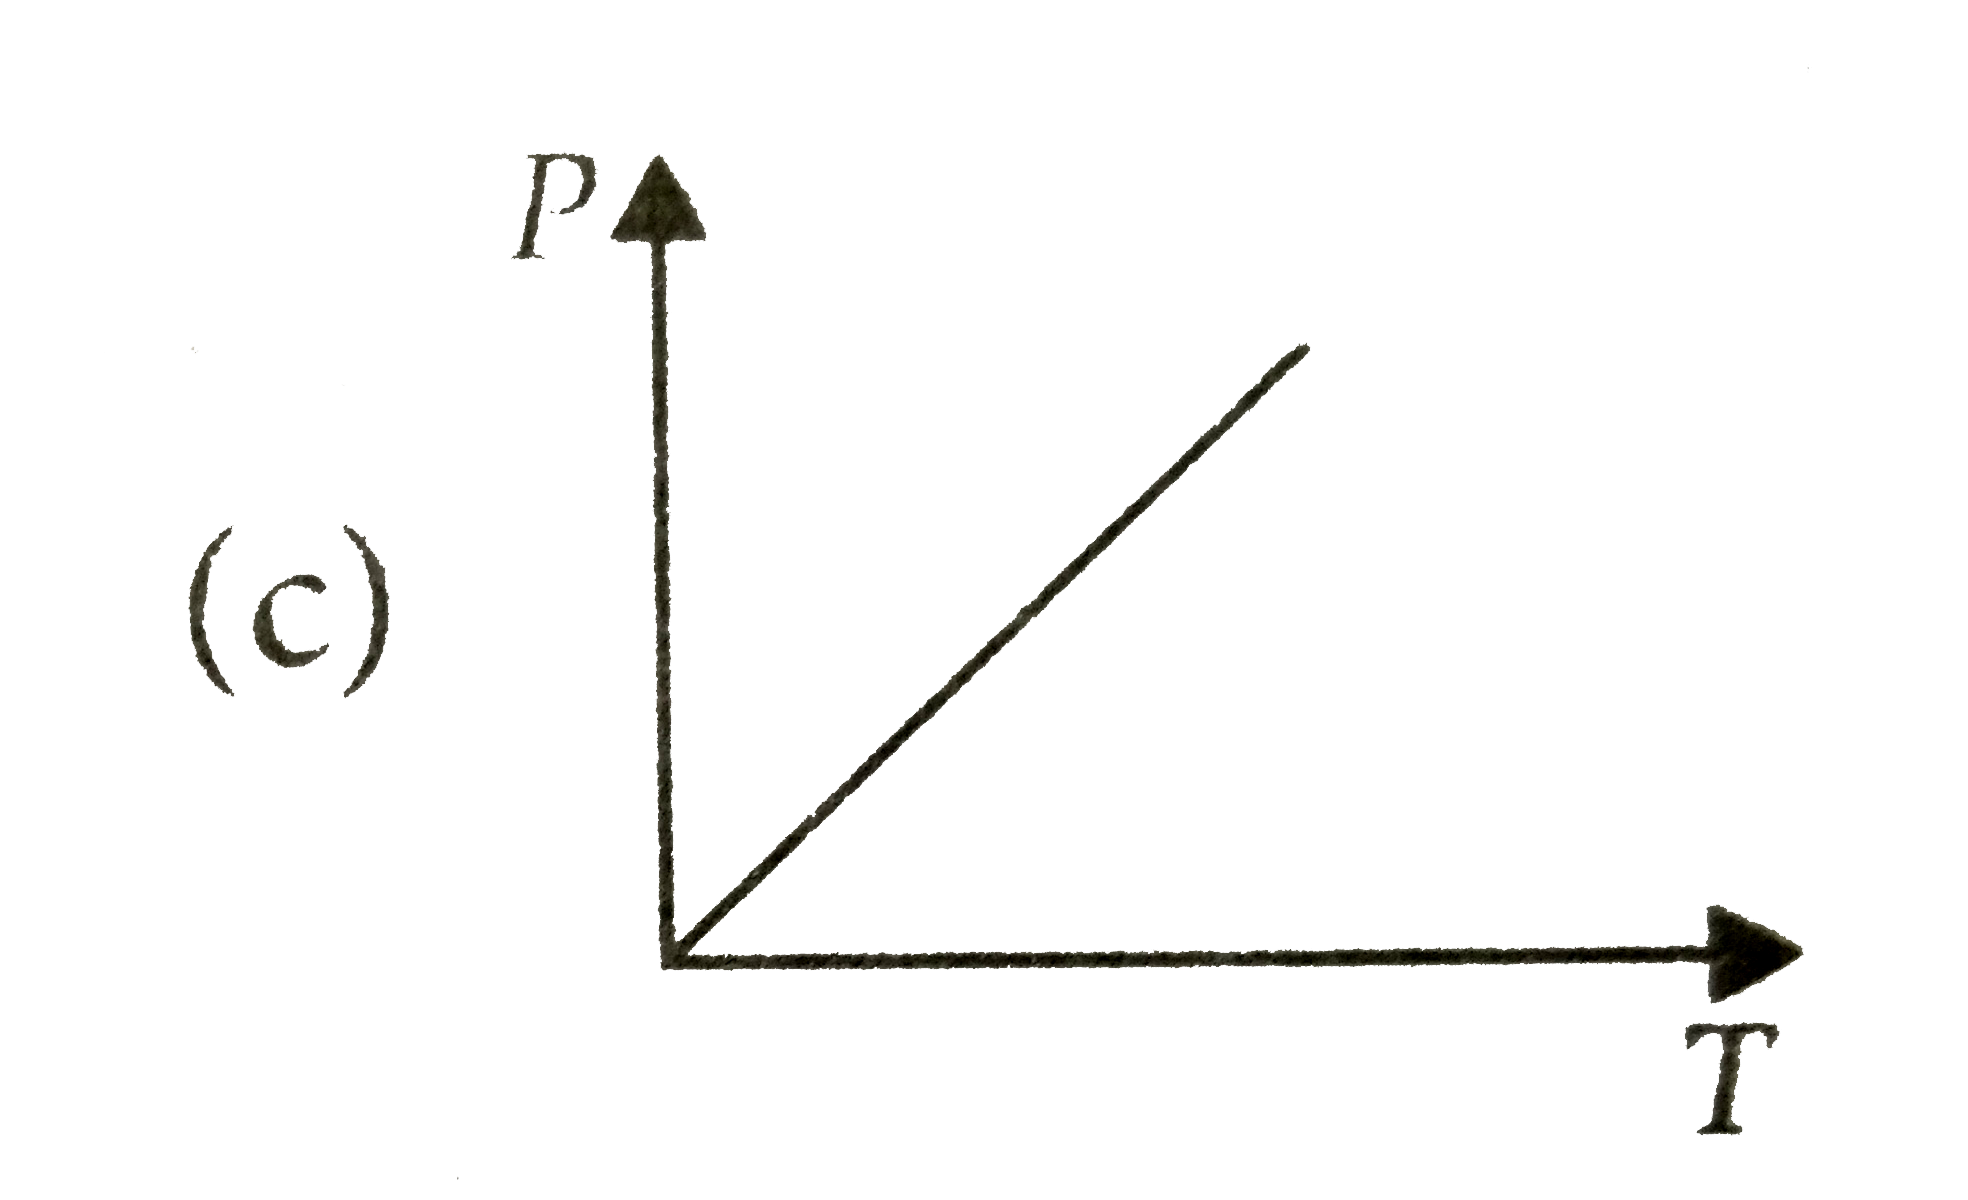 D
D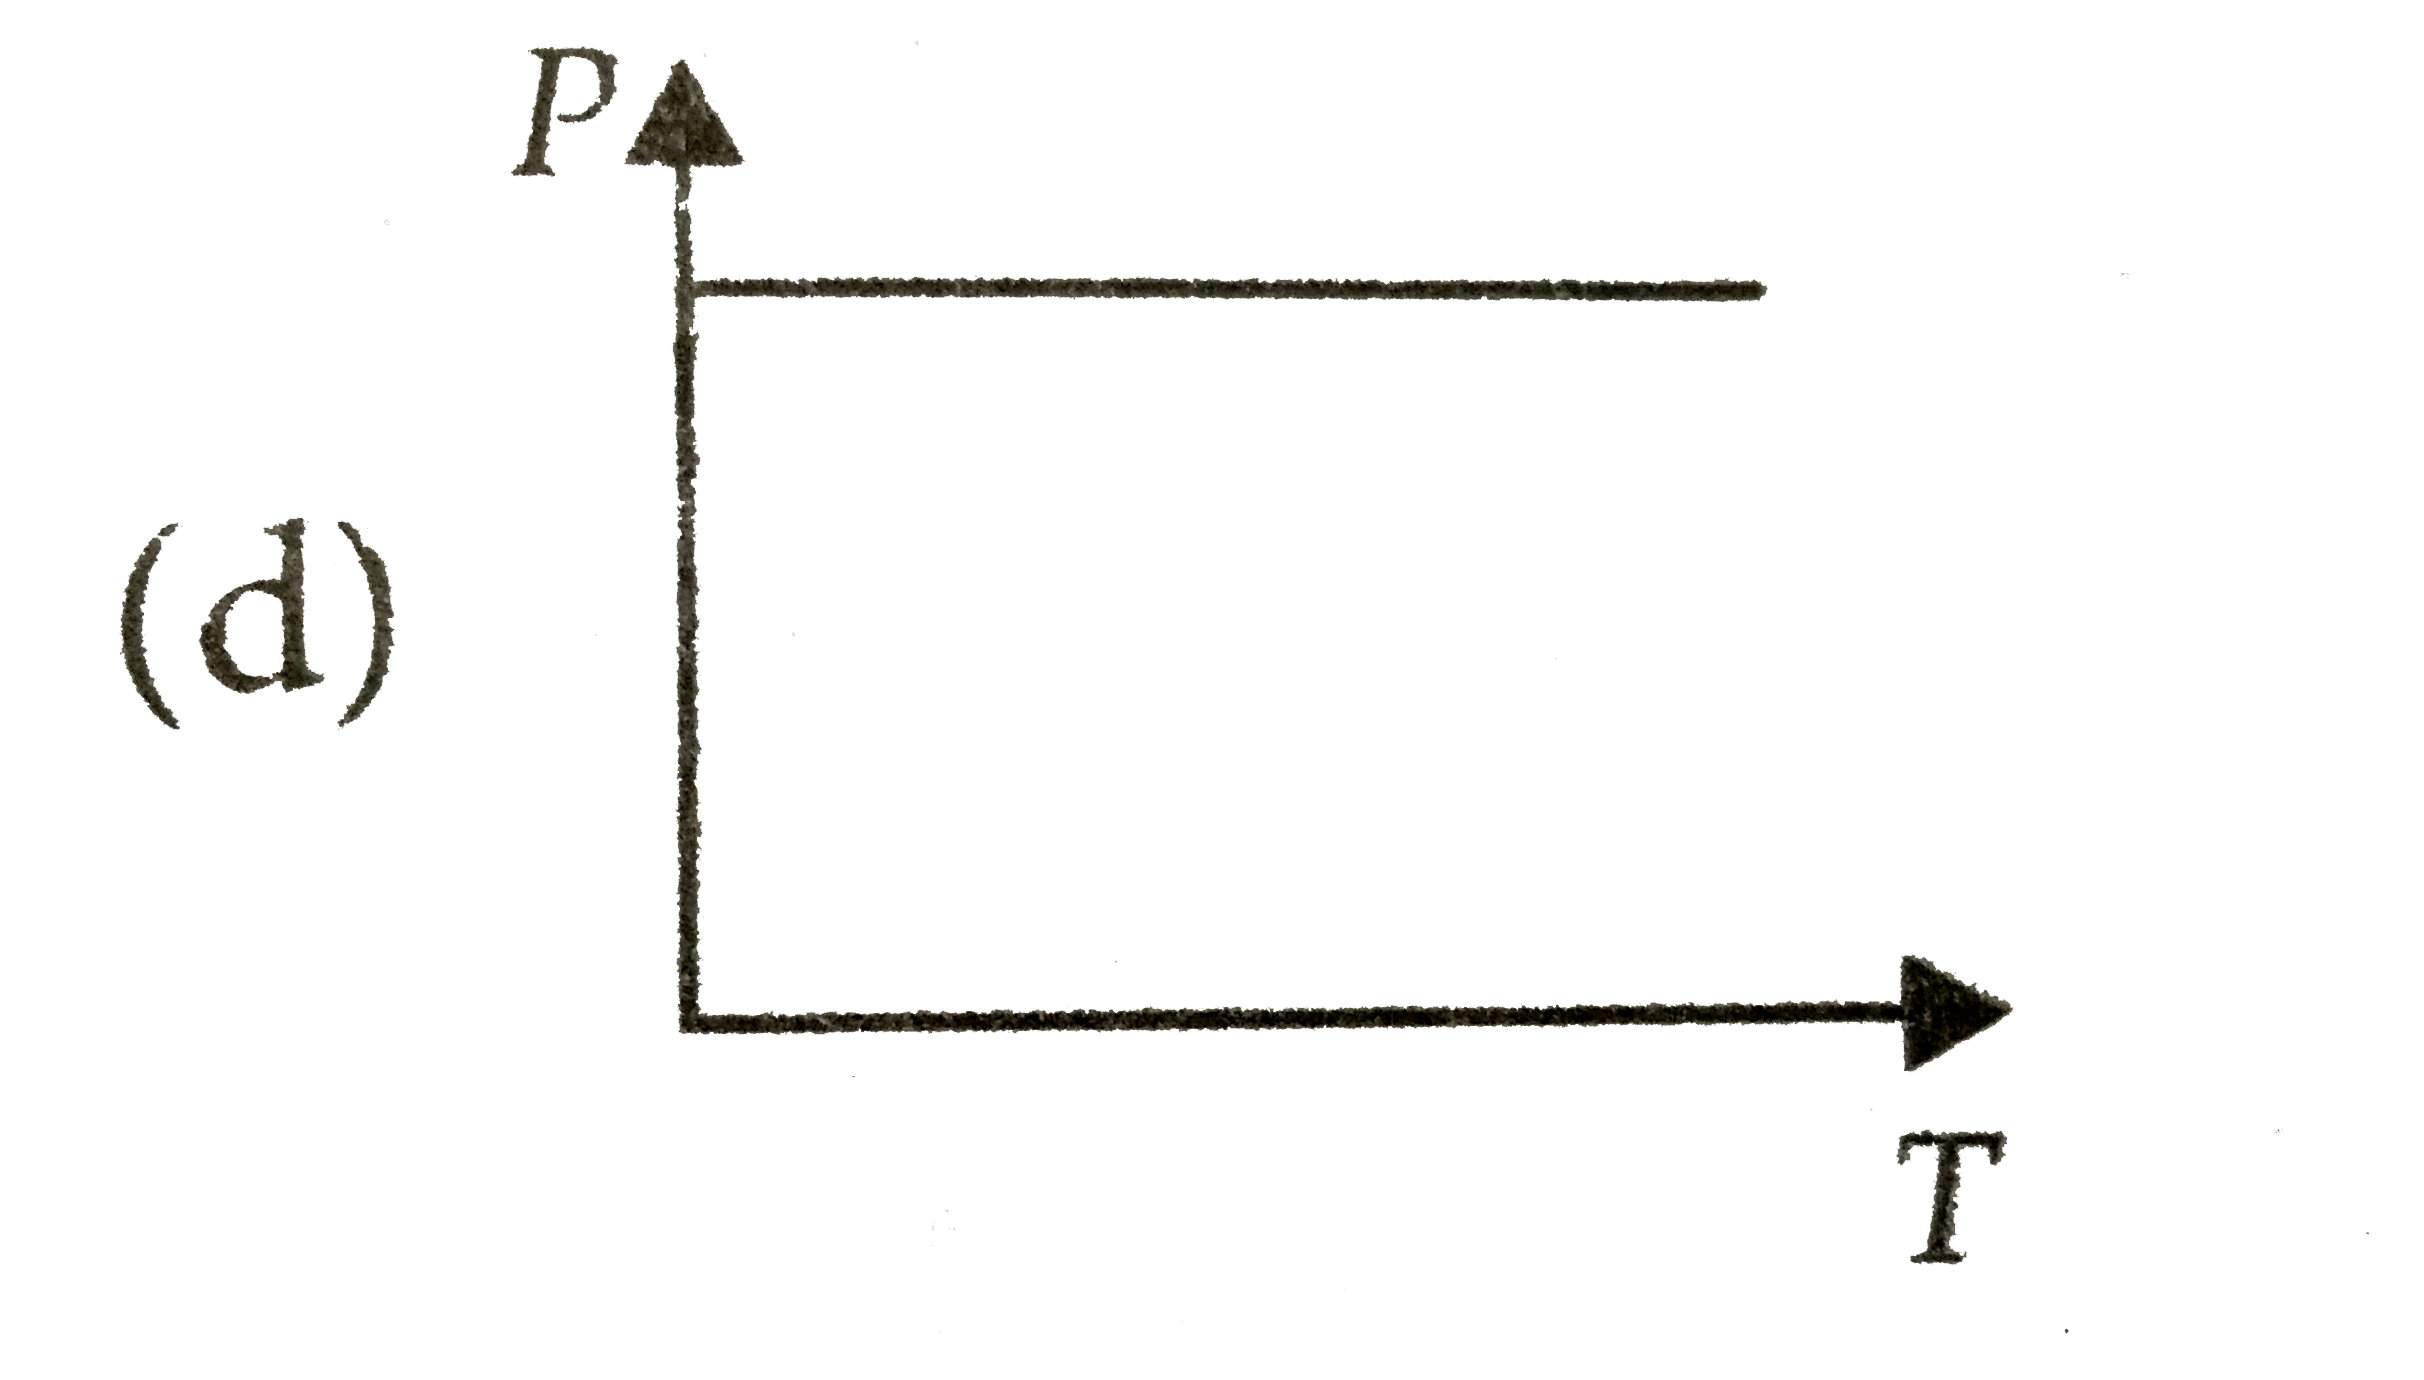
Which of the following graphs represents the relationship between the force F between two point charges and the distance r between them :
View SolutionWhich of the following graph represents relation between the image position (v) and object position (u) from the concave lens.
View SolutionName the lens that always forms a virtual and erect image.
View SolutionWhich of the following graph represent the function f(x)=∫√x0eu2x du, for x>0andf(0)=o
View SolutionWhich of the following form(s) a virtual and erect image for all position of the object?
View Solution


