Which of the following P-V curve best represents. As isothermal process?
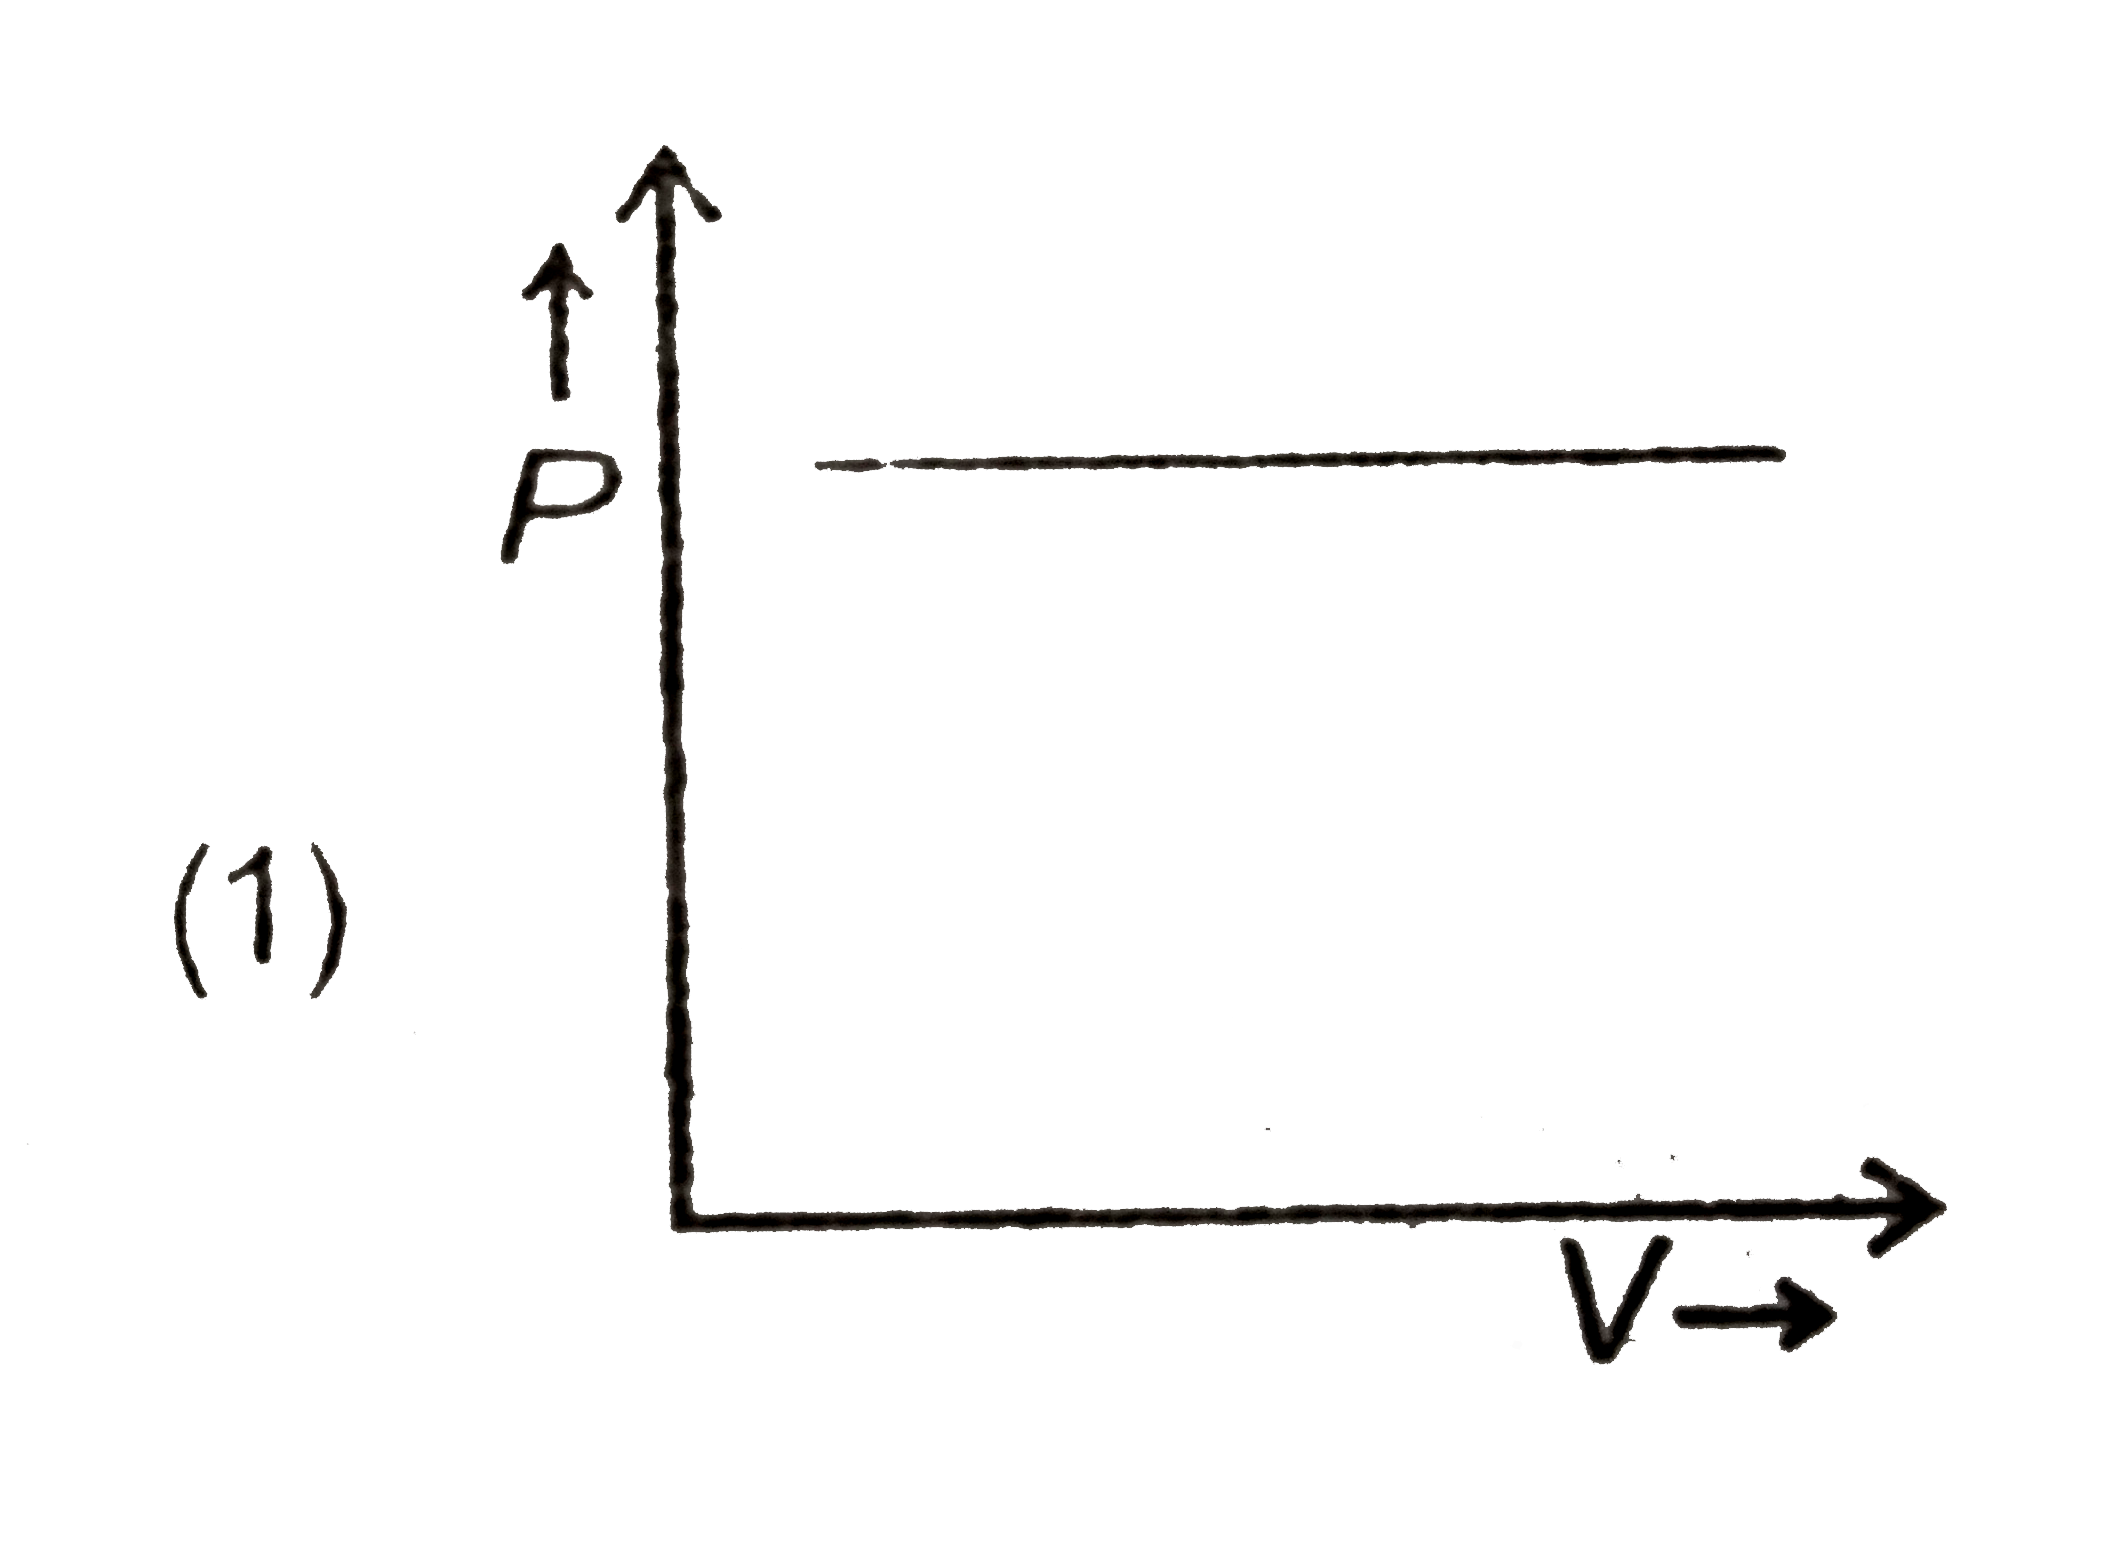
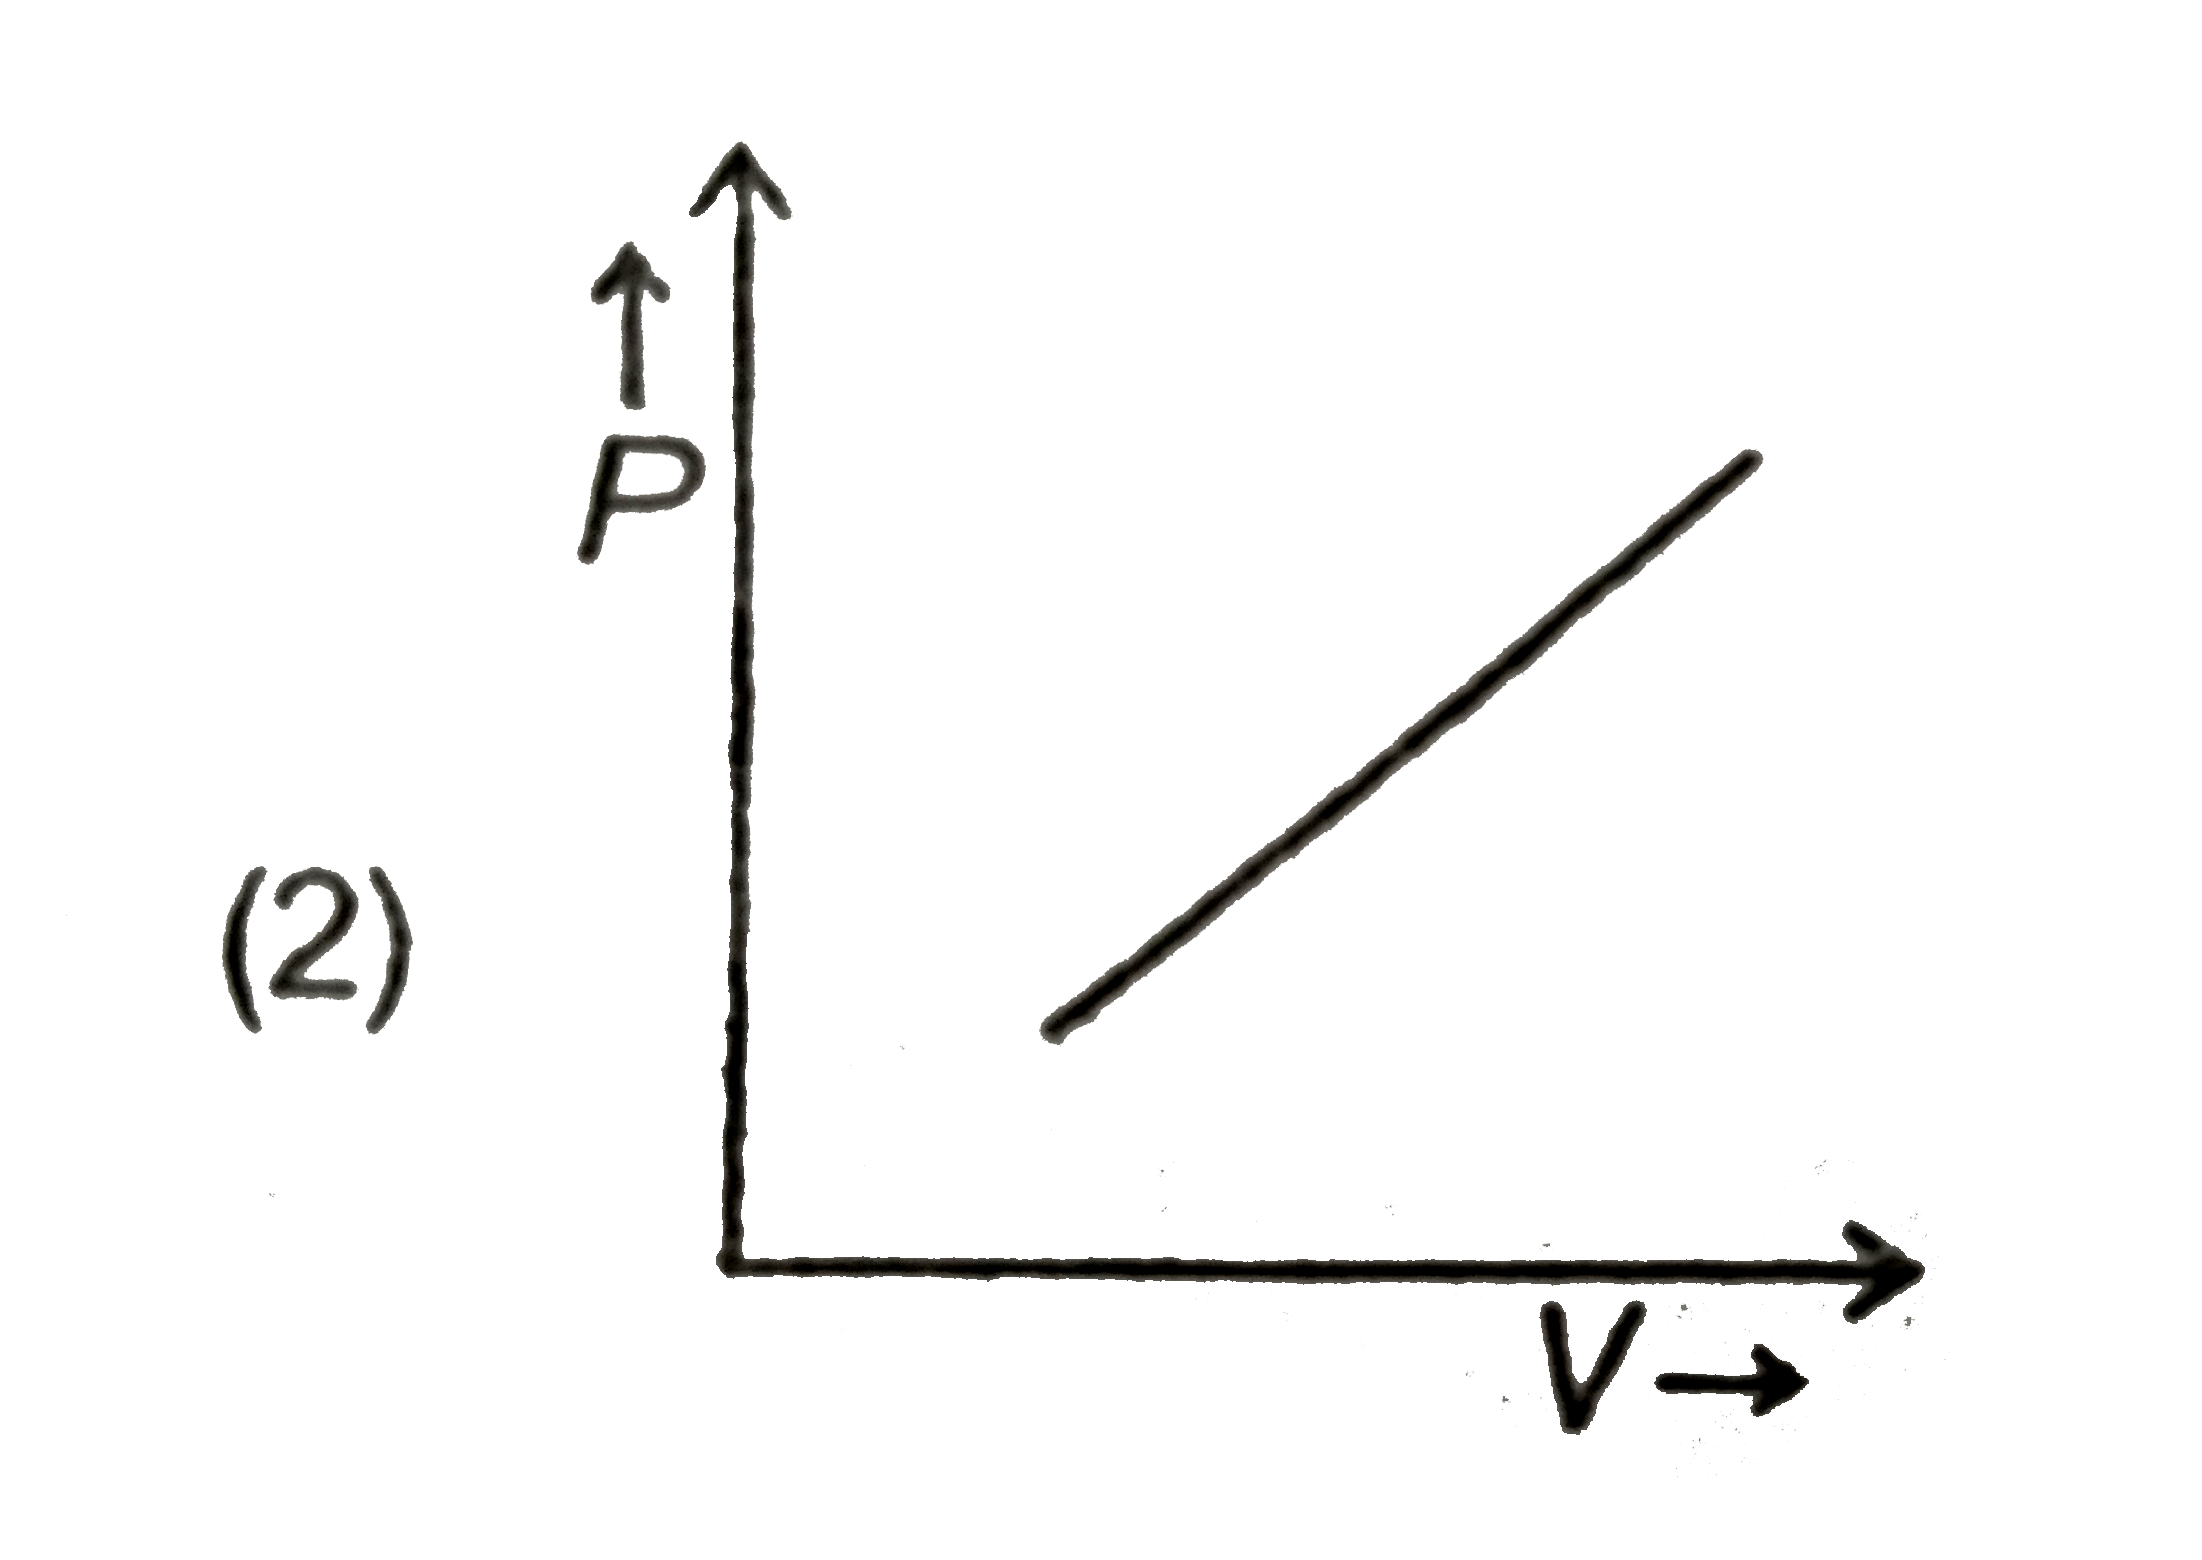
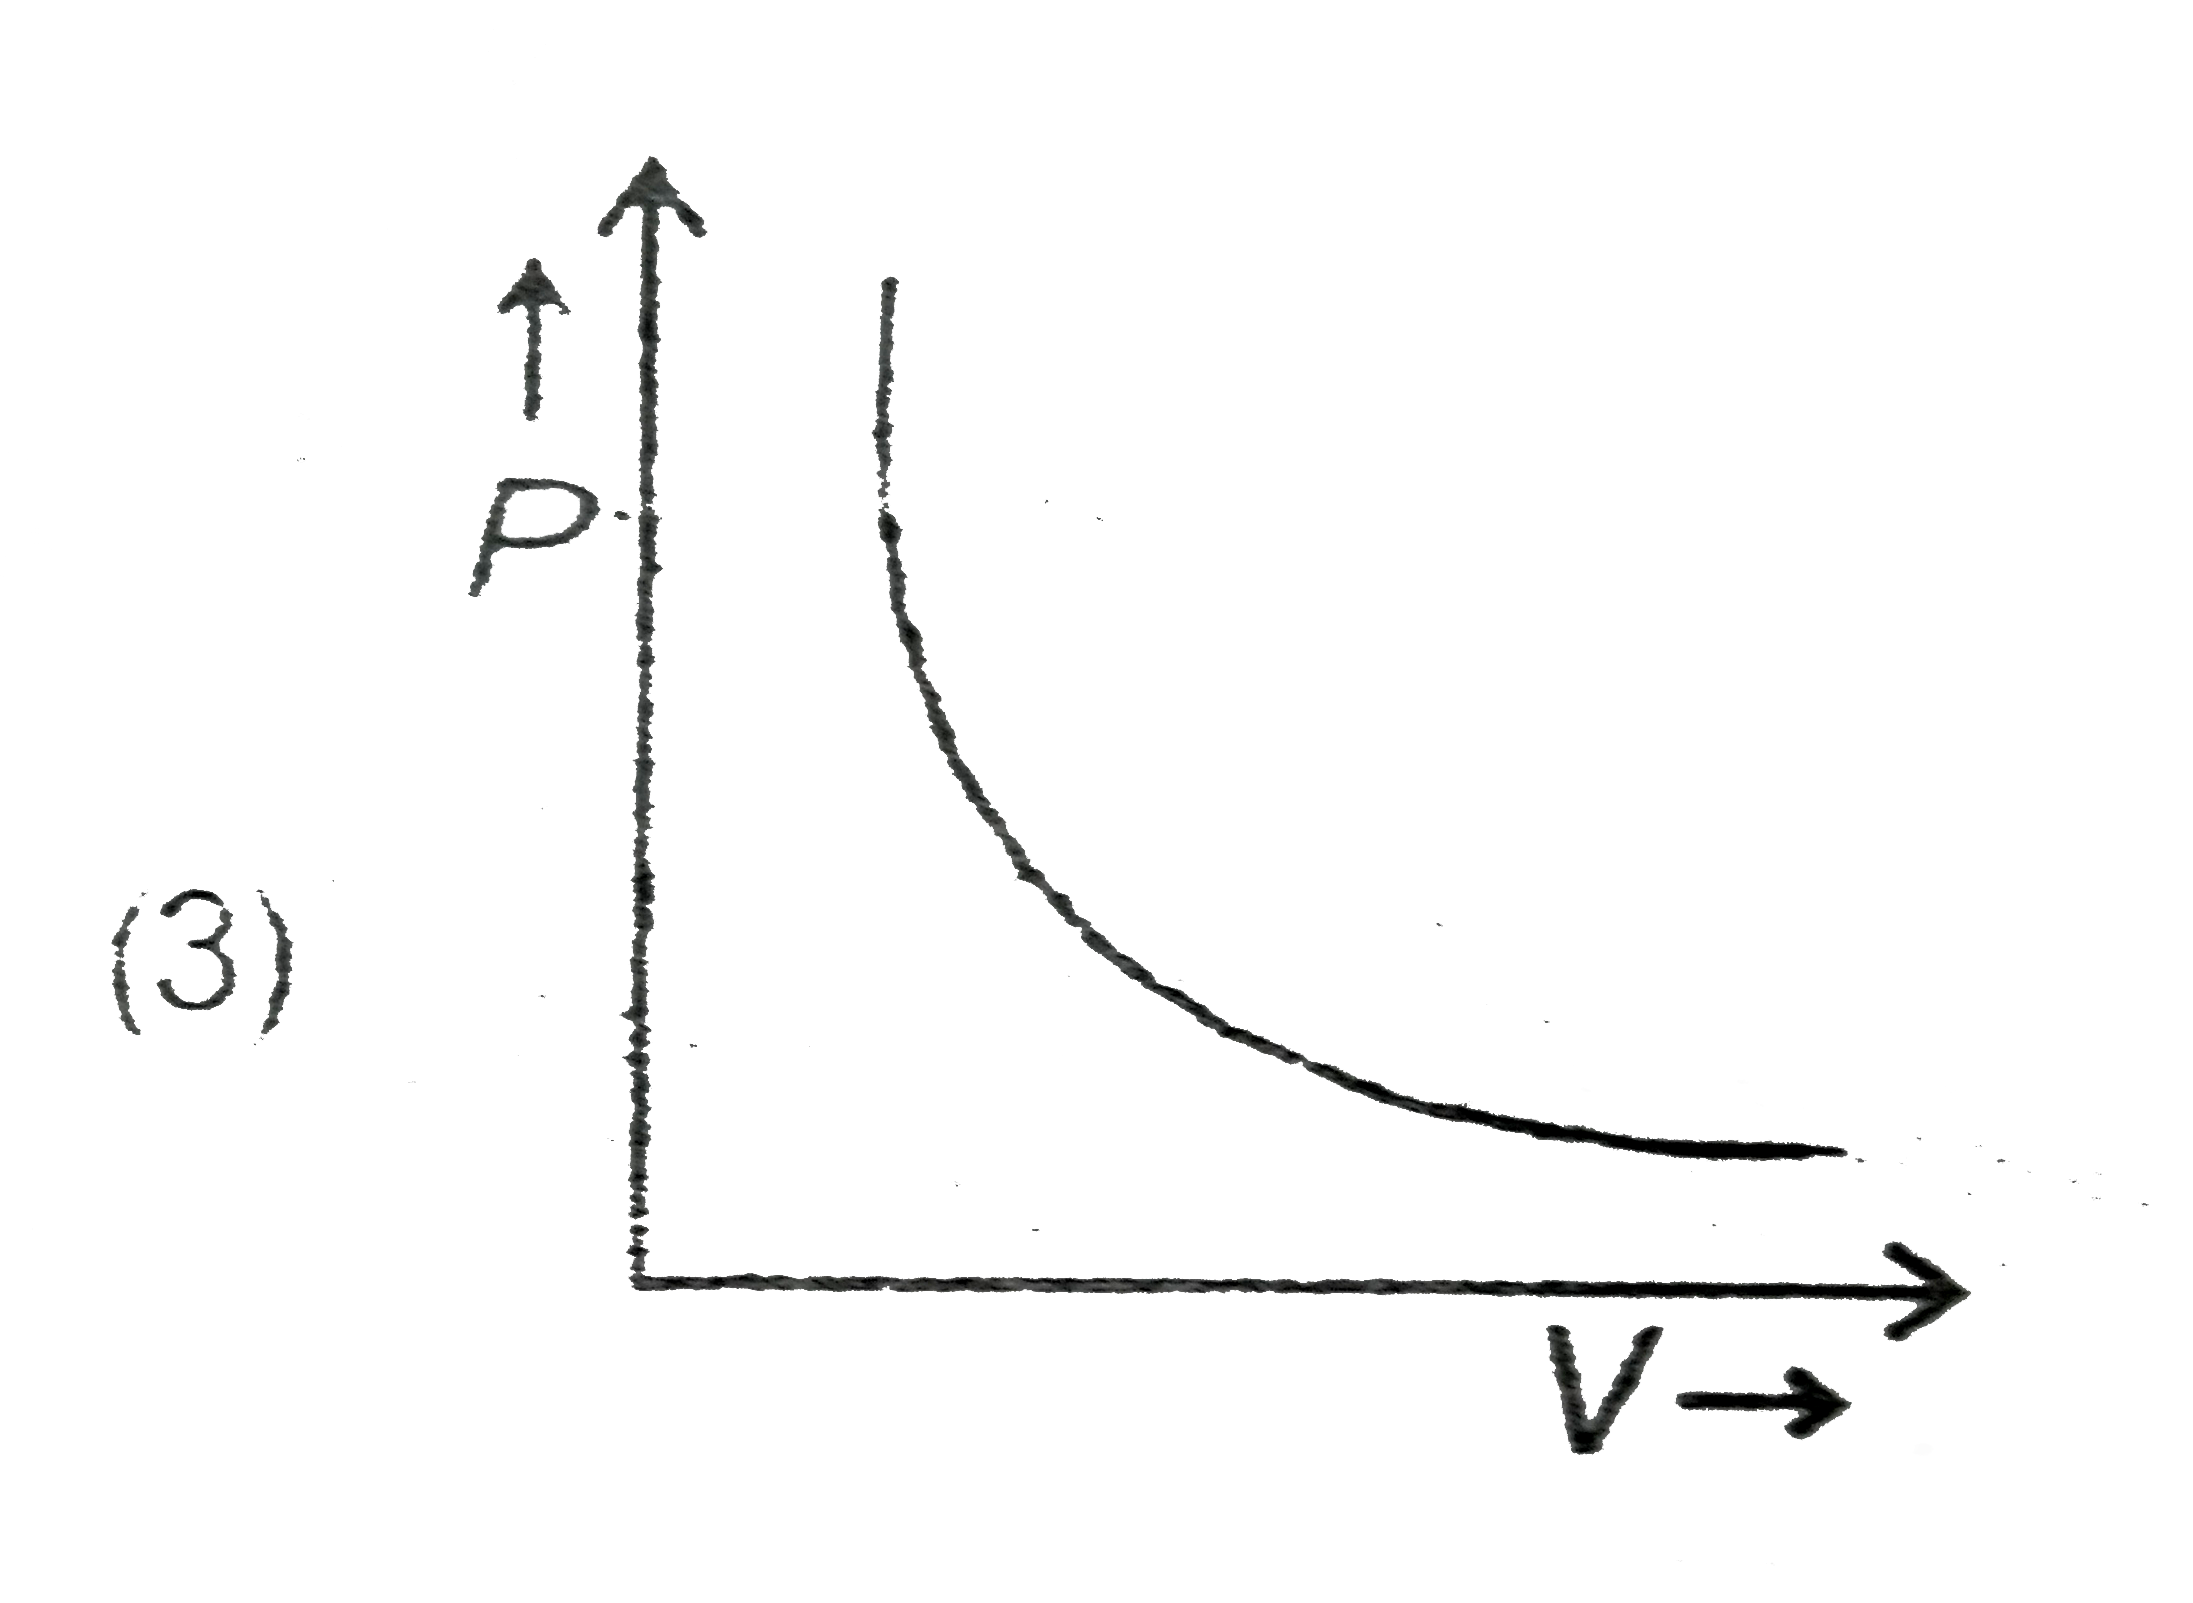
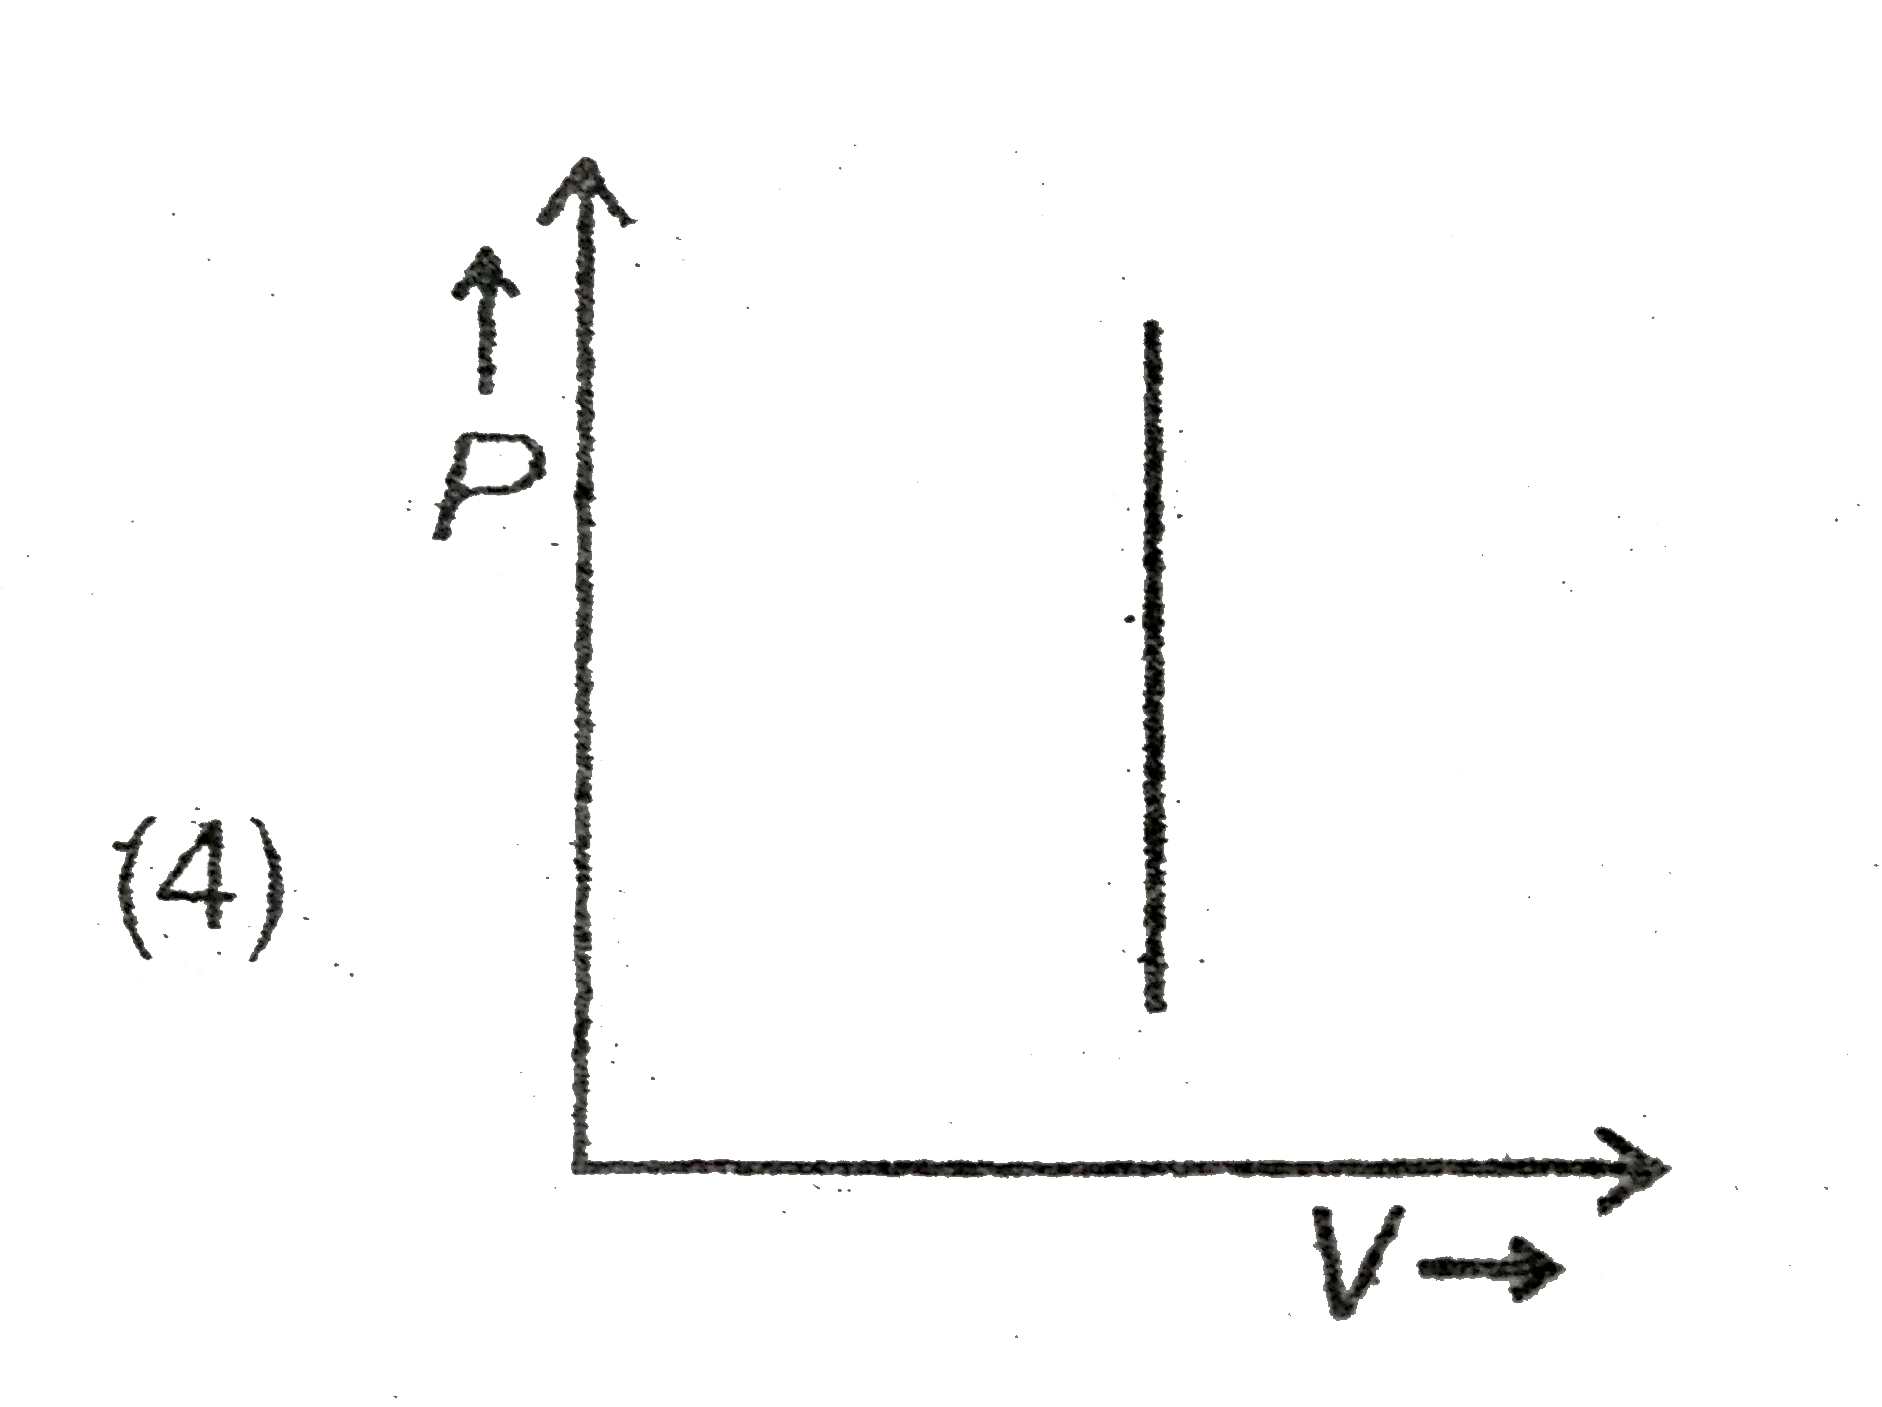
The correct Answer is:C
Step by step video & image solution for Which of the following P-V curve best represents. As isothermal process? by Physics experts to help you in doubts & scoring excellent marks in Class 12 exams.
Updated on:21/07/2023Topper's Solved these Questions
- THERMODYNAMICSBOOK - AAKASH INSTITUTE ENGLISHCHAPTER - THERMODYNAMICSEXERCISE - Assignment (Section-B) Objective Type Questions (one option is correct)
15 Videos
- THERMODYNAMICSBOOK - AAKASH INSTITUTE ENGLISHCHAPTER - THERMODYNAMICSEXERCISE - Assignment (Section-C) Objective Type Questions (More than one option are correct)
11 Videos
- THERMODYNAMICSBOOK - AAKASH INSTITUTE ENGLISHCHAPTER - THERMODYNAMICSEXERCISE - Try Youself
13 Videos
- THERMAL PROPERTIES OF MATTERBOOK - AAKASH INSTITUTE ENGLISHCHAPTER - THERMAL PROPERTIES OF MATTEREXERCISE - Assignment (Section-J) Akash Challengers Questions
7 Videos
- UNITS AND MEASUREMENTSBOOK - AAKASH INSTITUTE ENGLISHCHAPTER - UNITS AND MEASUREMENTSEXERCISE - ASSIGNMENT (SECTION - D)
15 Videos
Similar Questions
In an isothermal process
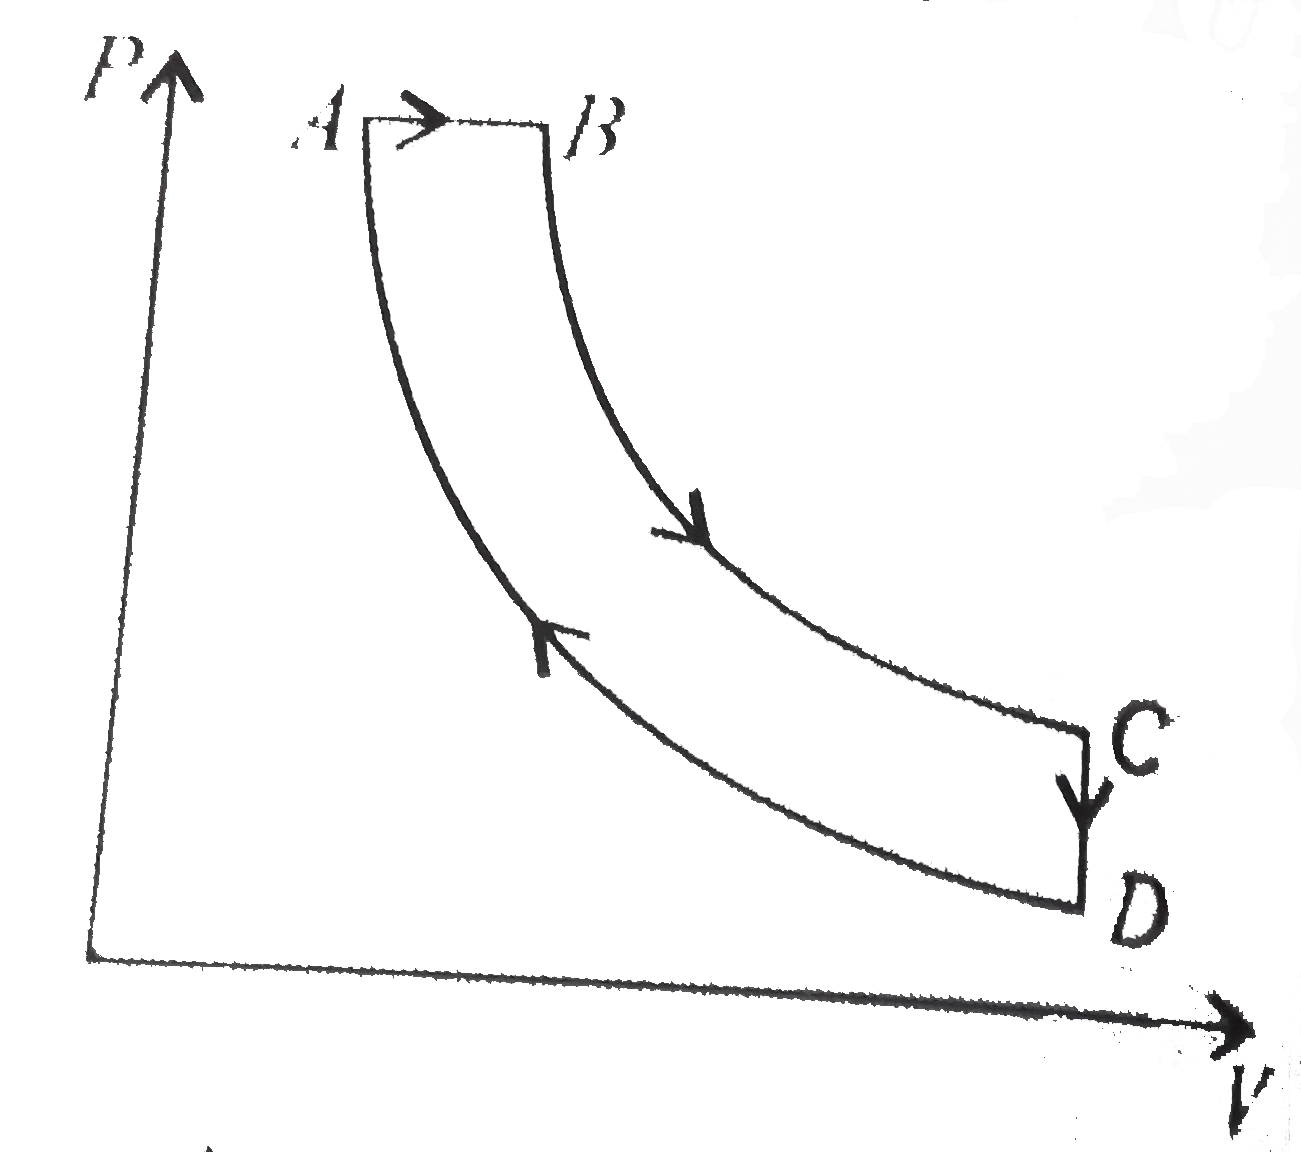
View SolutionA cyclic process ABCD is shown in the P−V diagram. Which of the following curves represents the same process?
View SolutionA cyclic process ABCD is shown in the P−V diagram. Which of the following curves represents the same process?

View Solution
A cyclic process ABCD is shown in the p-V diagram. Which of the following curves represent the same process?
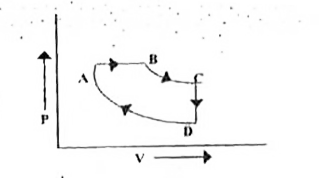
View SolutionA cyclic process ABCD is shown in the figure P-V diagram. Which of the following curves represent the same process?
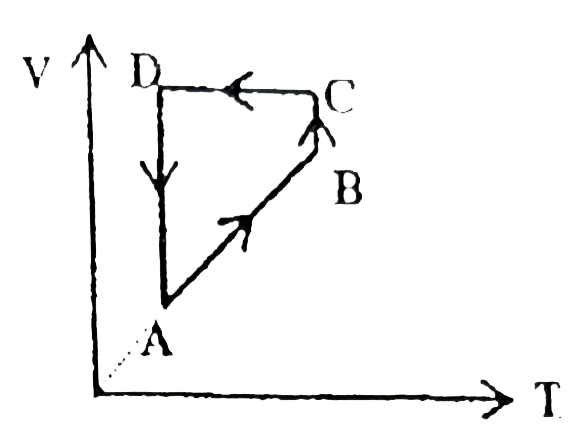
View SolutionA cyclic process ABCD is shown in the V−T diagram. Which of the following curves represent the same process ?
View SolutionFor an isothermal process
View SolutionThe given curve represents the variation of temperature as a function of volume for one mole of an ideal gas. Which of the following curves best represents the variation of pressure as a function of volume?
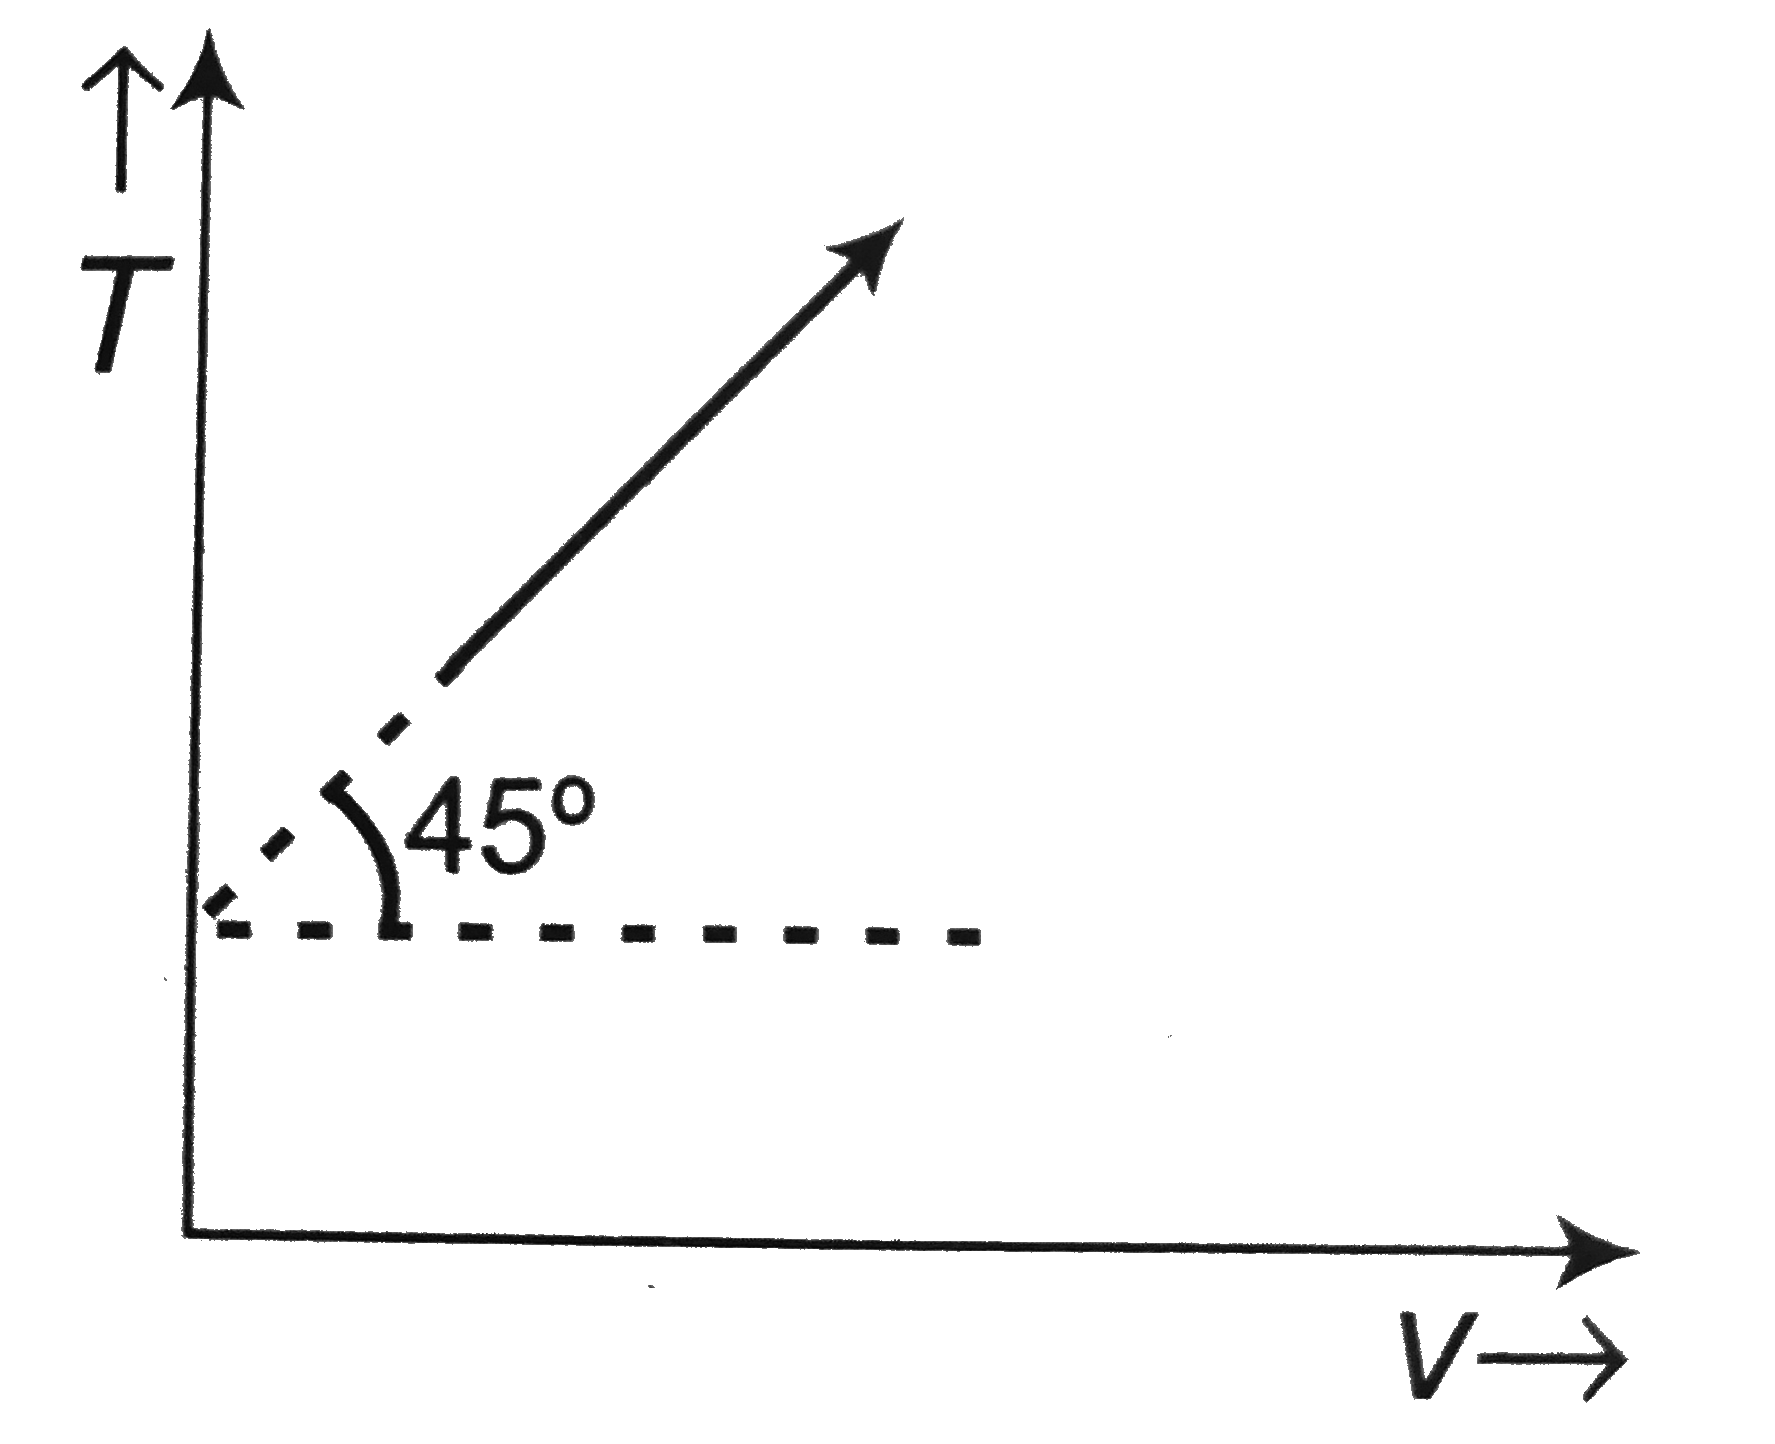
View SolutionThe given curve represents the variation of temperatue as a function of volume for one mole of an ideal gas. Which of the following curves best represents the variation of pressure as a function of volume ?
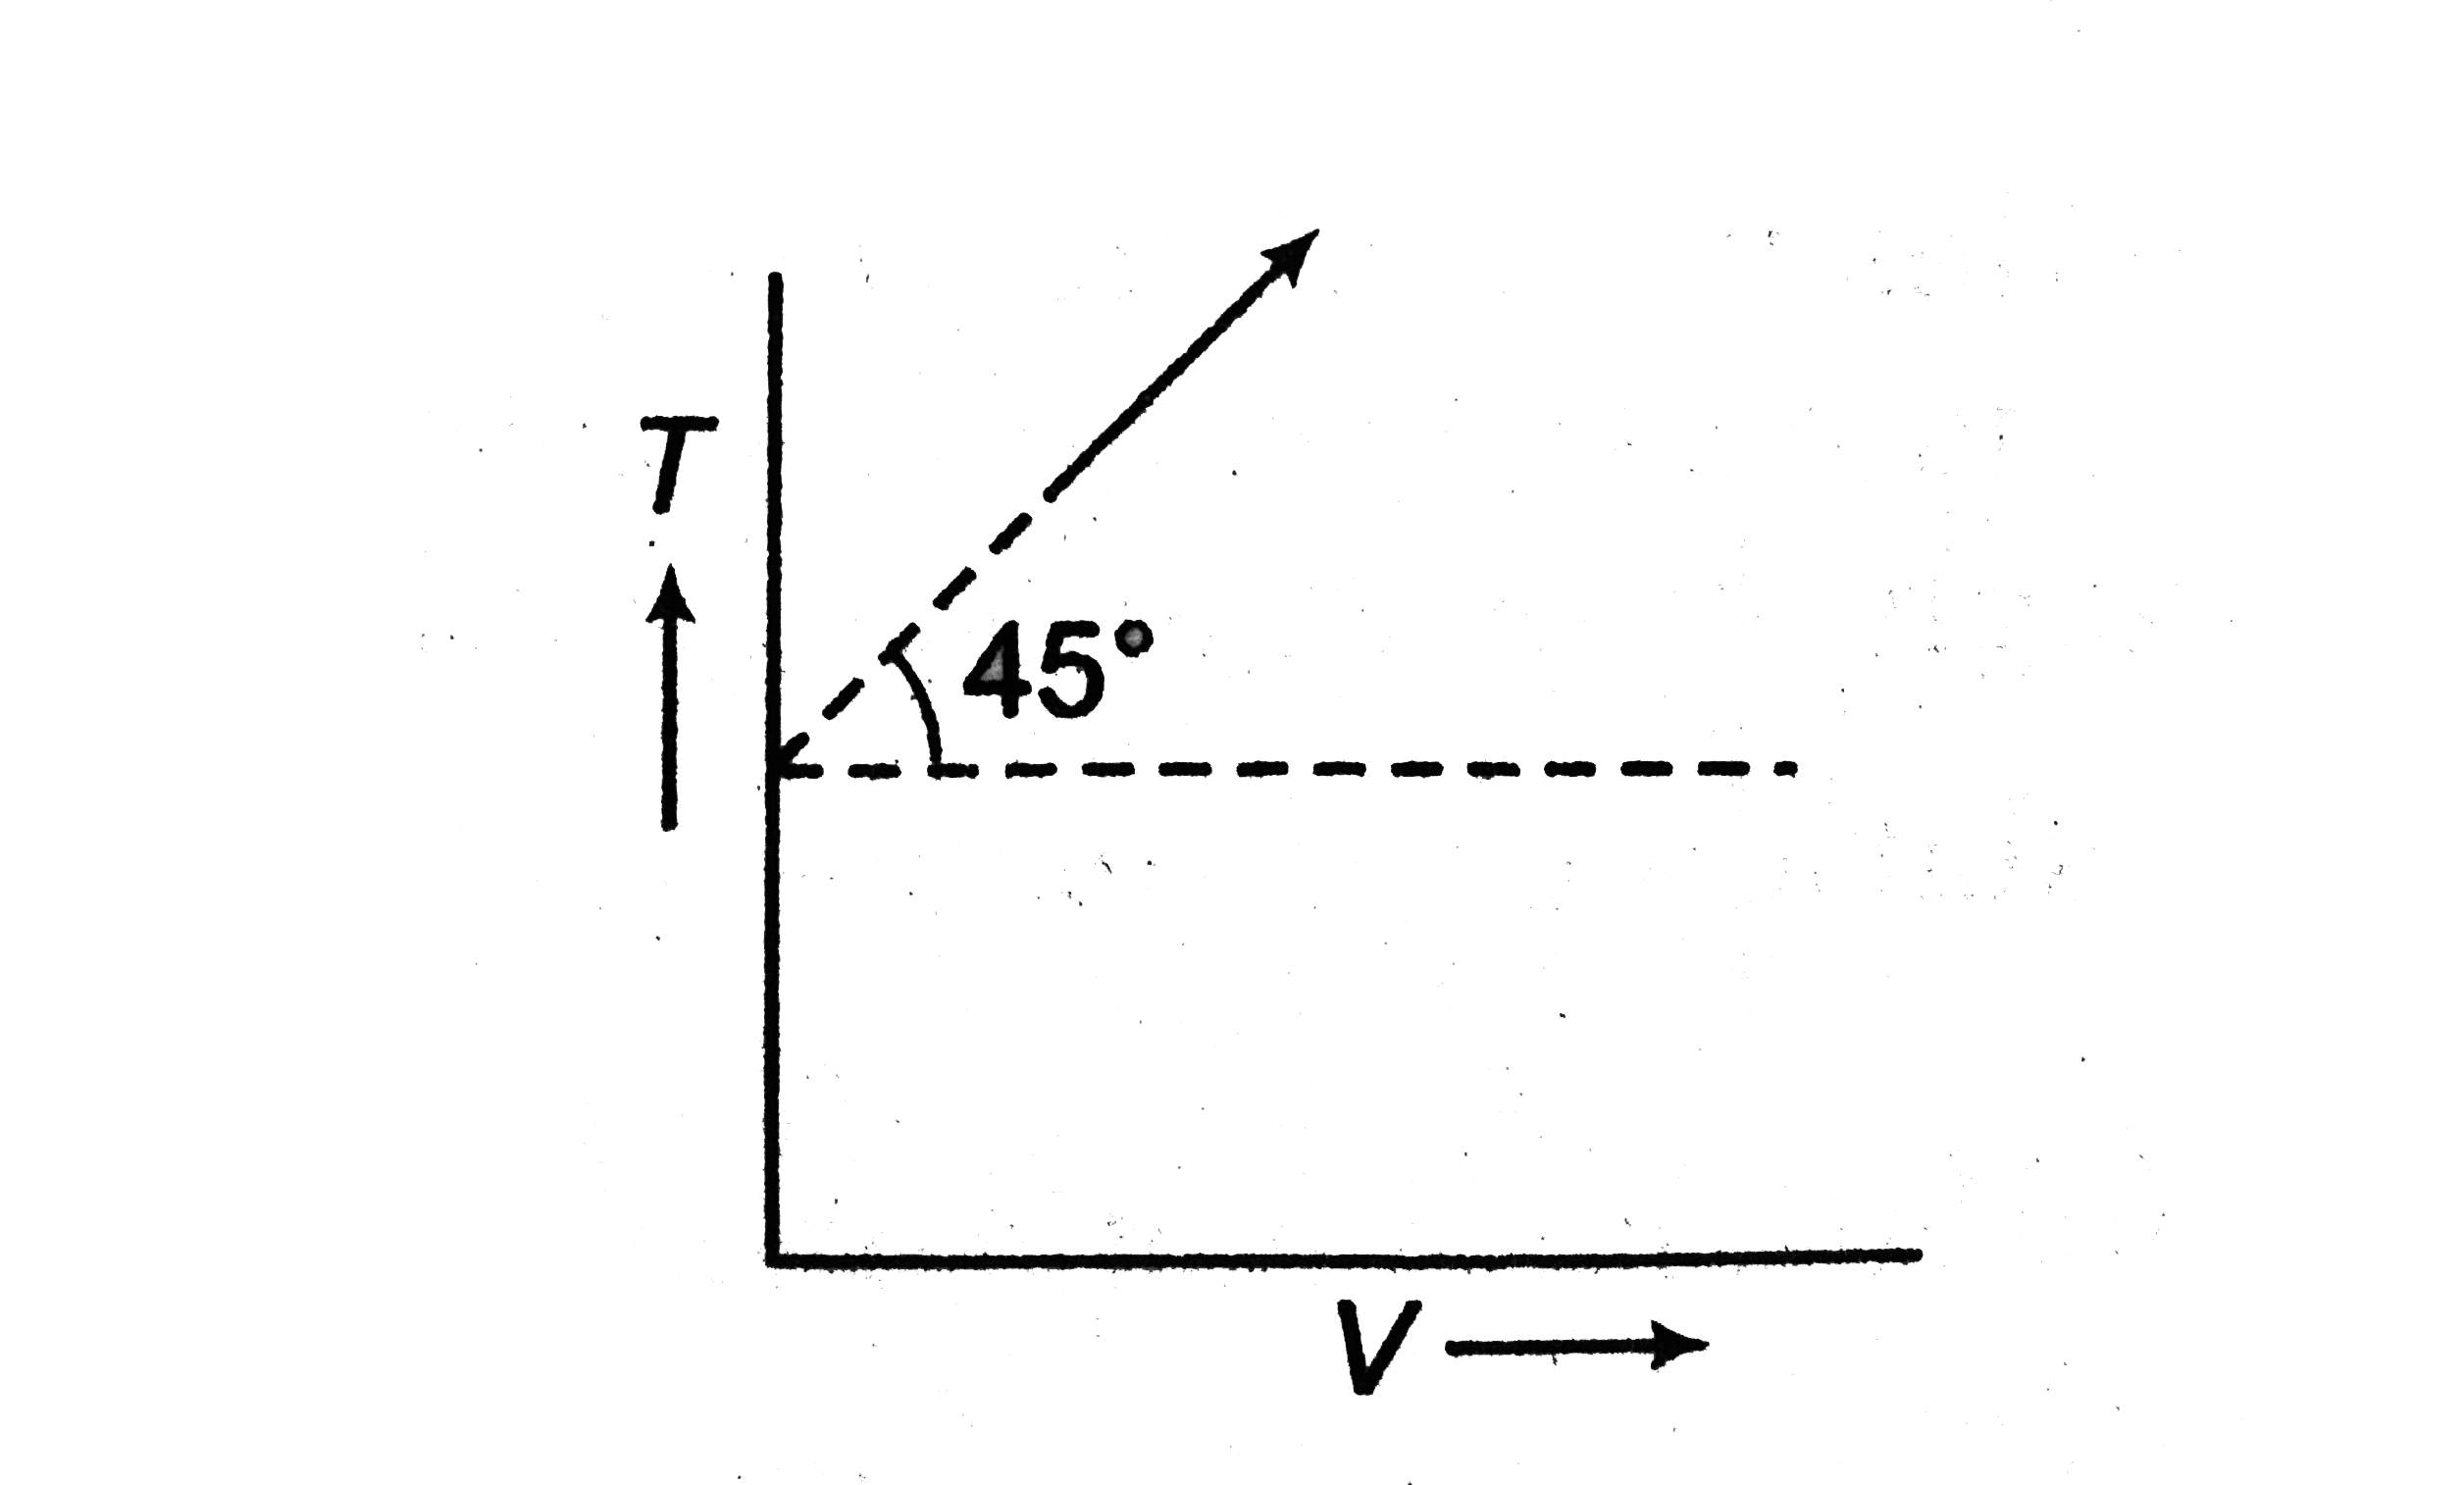 .
.
View SolutionThe given curve represents the variation of temperatue as a function of volume for one mole of an ideal gas. Which of the following curves best represents the variation of pressure as a function of volume ?
 .
.
View Solution
