Which of the graph shows that the particle is at rest .


The correct Answer is:D
As time changes, position remains the same.
Topper's Solved these Questions
- DESCRIPTION OF MOTIONBOOK - CENGAGE PHYSICSCHAPTER - DESCRIPTION OF MOTIONEXERCISE - CONSOLIDATED EXERCISE (MULTIPLE-CHOICE QUESTIONS WITH ONE OR MORE THAN ONE CORRECT ANSWER)
6 Videos
- DESCRIPTION OF MOTIONBOOK - CENGAGE PHYSICSCHAPTER - DESCRIPTION OF MOTIONEXERCISE - CHALLENGING EXERCISE
6 Videos
- DESCRIPTION OF MOTIONBOOK - CENGAGE PHYSICSCHAPTER - DESCRIPTION OF MOTIONEXERCISE - CONSOLIDATED EXERCISE (MATCH THE COLUMNS)
3 Videos
- ELASTICITYBOOK - CENGAGE PHYSICSCHAPTER - ELASTICITYEXERCISE - OLYMPIAD AND NTSE LEVEL EXERCISES
10 Videos
Similar Questions
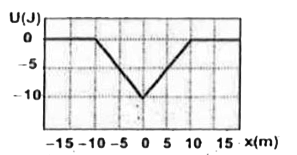
Figure shows a graph of potential energy.
Consider the following graphs of position and time.
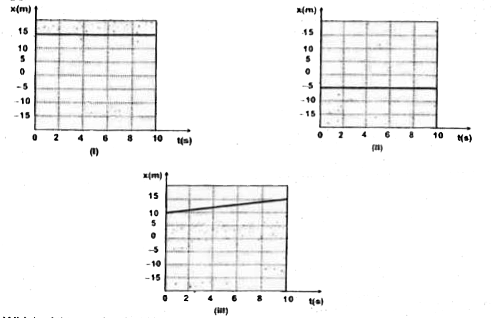
Which of the graphs could be the motion of a particle in the given potential?
View SolutionFigure below shows the velocity-time graph of a one dimensional motion. Which of the following characteristic of the particle is represented by the shaded area?

View Solution
Knowledge Check
Which of the graph shows a particle with retardation?
A B
B C
C D
D
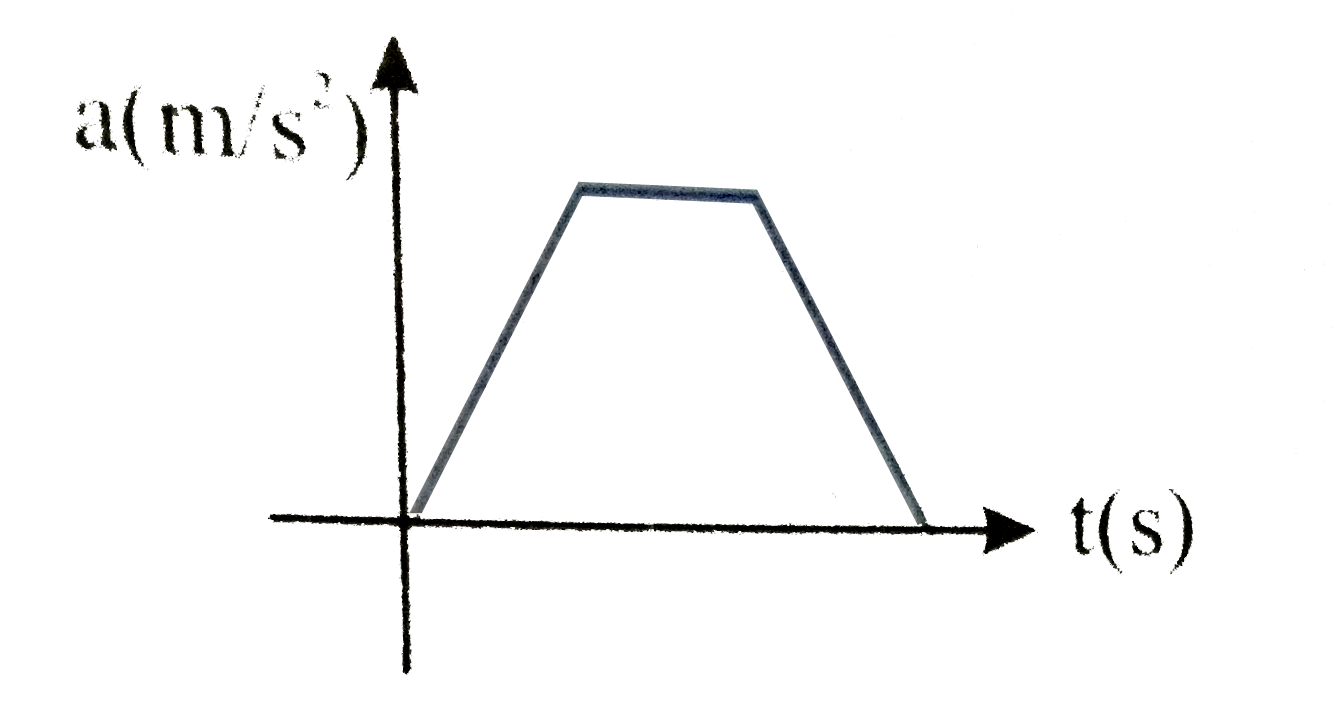
For a particle moving on a straight lint the variation of acceleration with time is given by the graph as shown. Initially the particle was at rest. Then the corresponding kinetic energy of the particle versus time graph will be
 .A
.A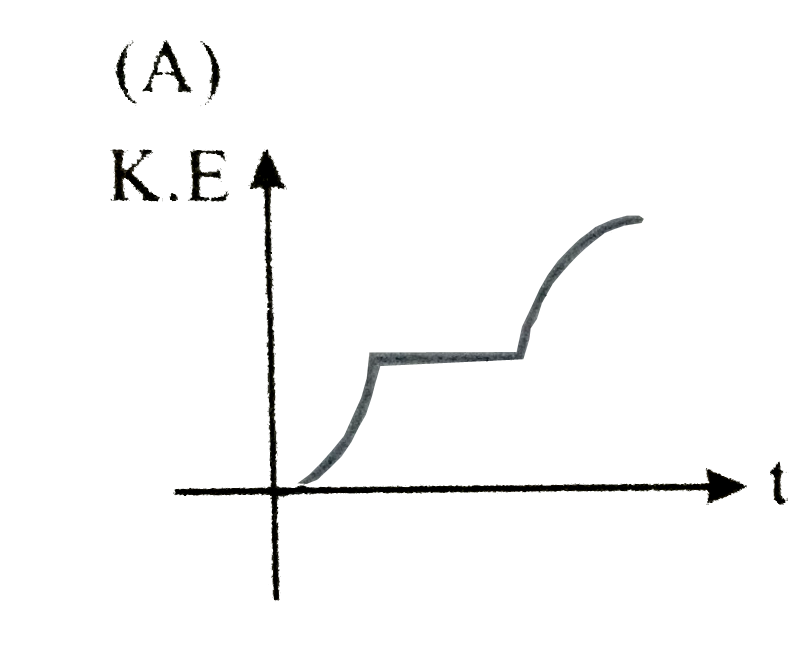 B
B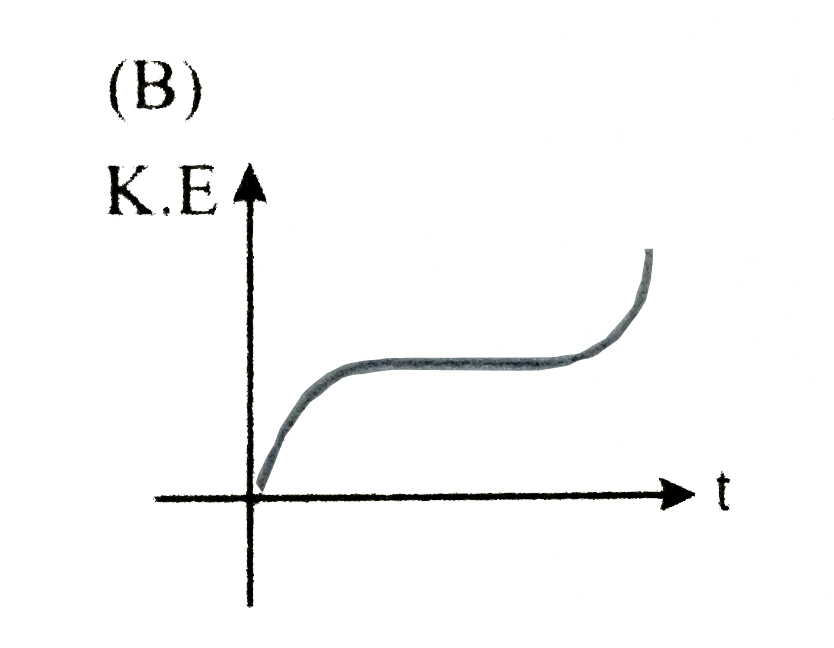 C
C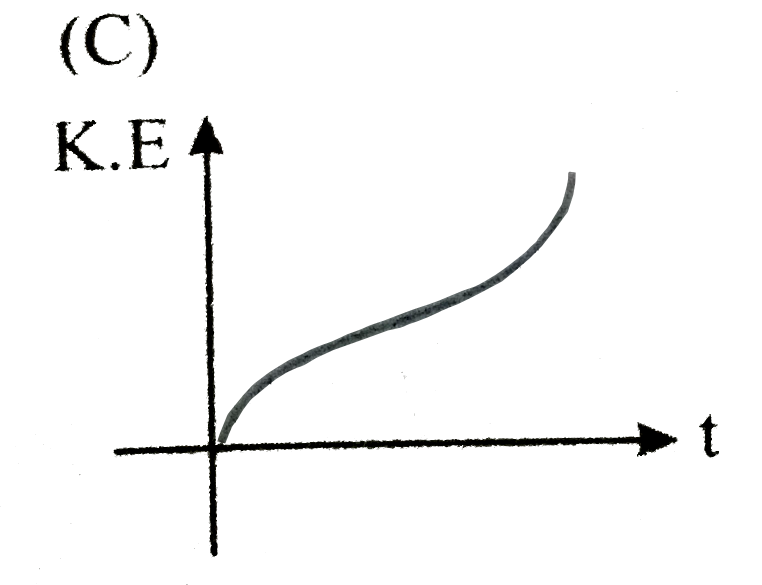 D
D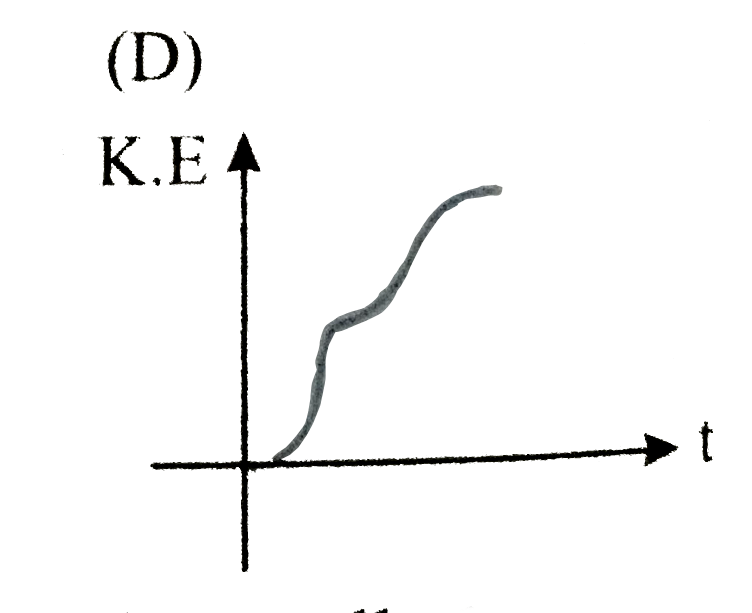
Figure shows a graph of potential energy.

Consider the following graphs of position and time.

Which of the graphs could be the motion of a particle in the given potential?AIBIICI and IIDI and III
Figure shows acceleration versus time graph of a particle starting from rest and moving along a straight line. Which of the following staement (s) is/are correct ?
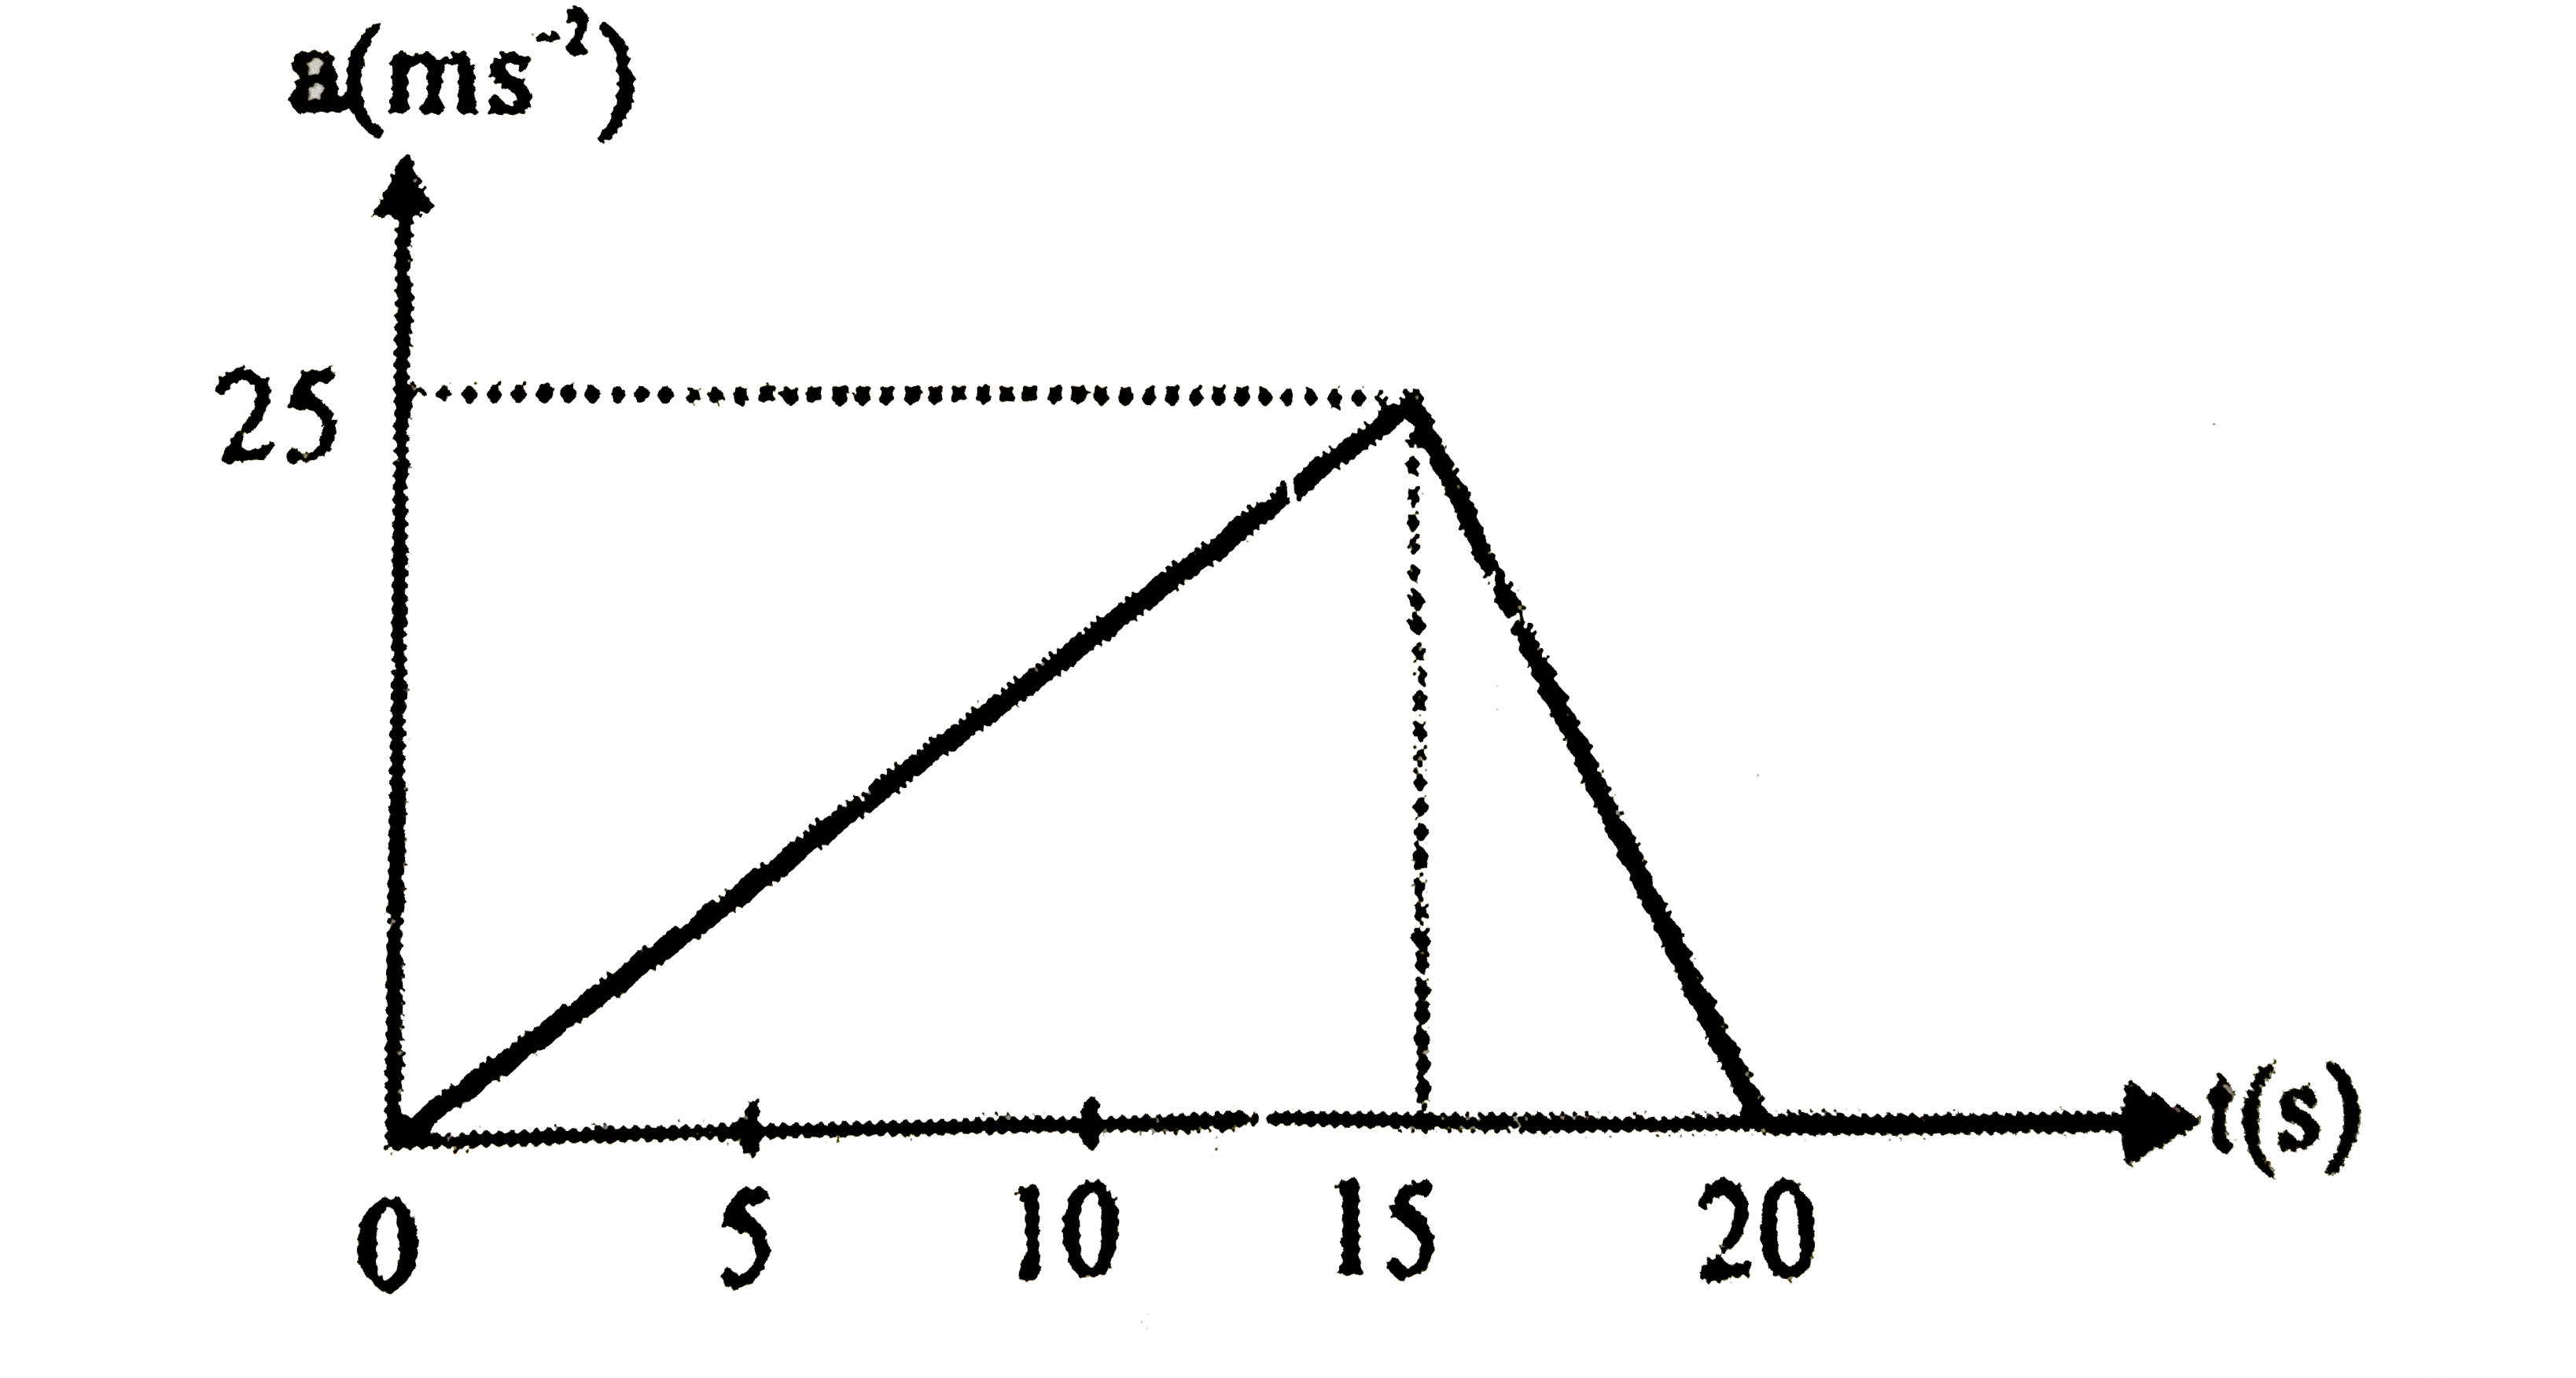
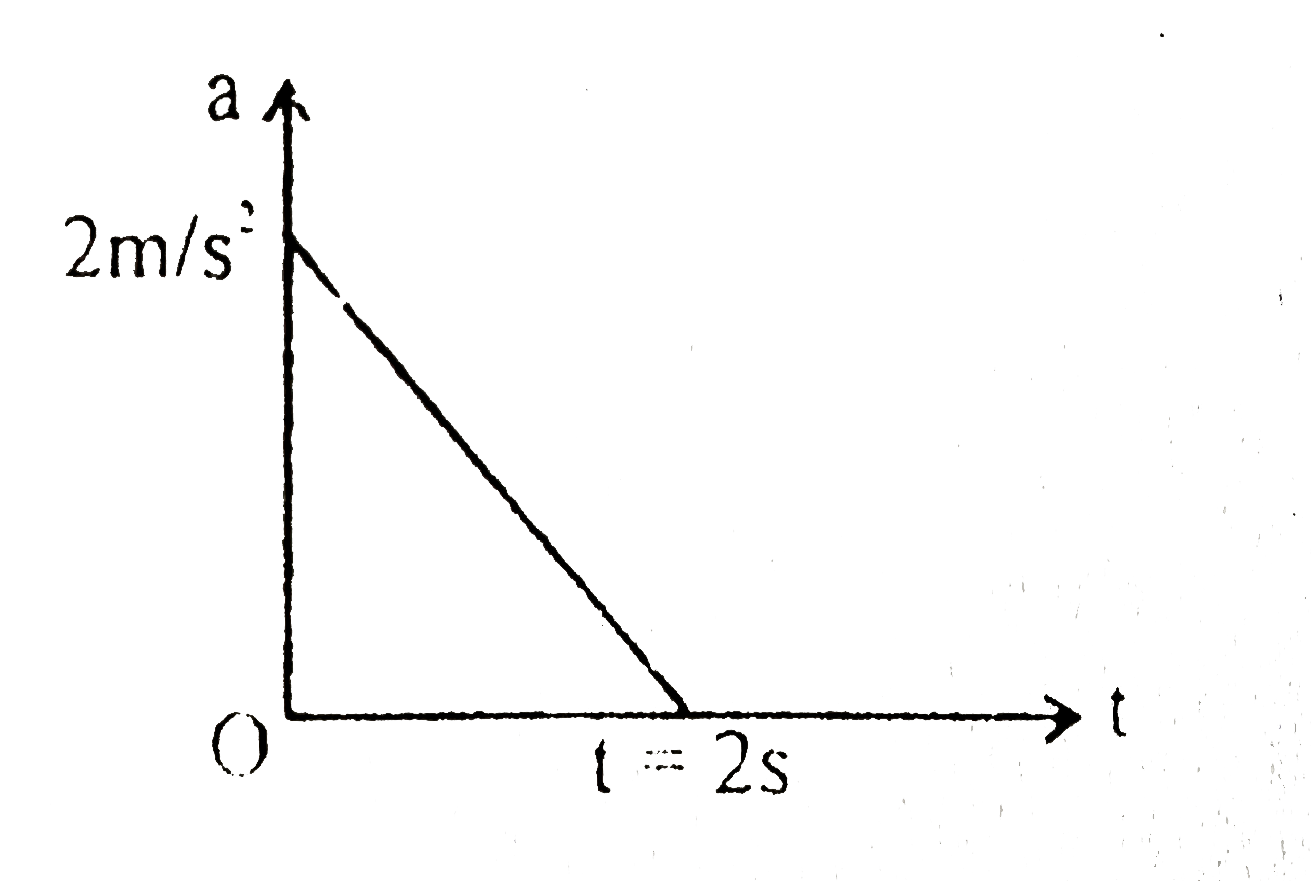
View SolutionAccleration vs time graph of a particle starting from rest is given. Find the displacement of particle in first 2 seconds.
View SolutionFigure below shows the velocity-time graph of a one dimensional motion. Which of the following characteristic of the particle is represented by the shaded area?

View SolutionWhich of the following graphs represent abody at rest ?
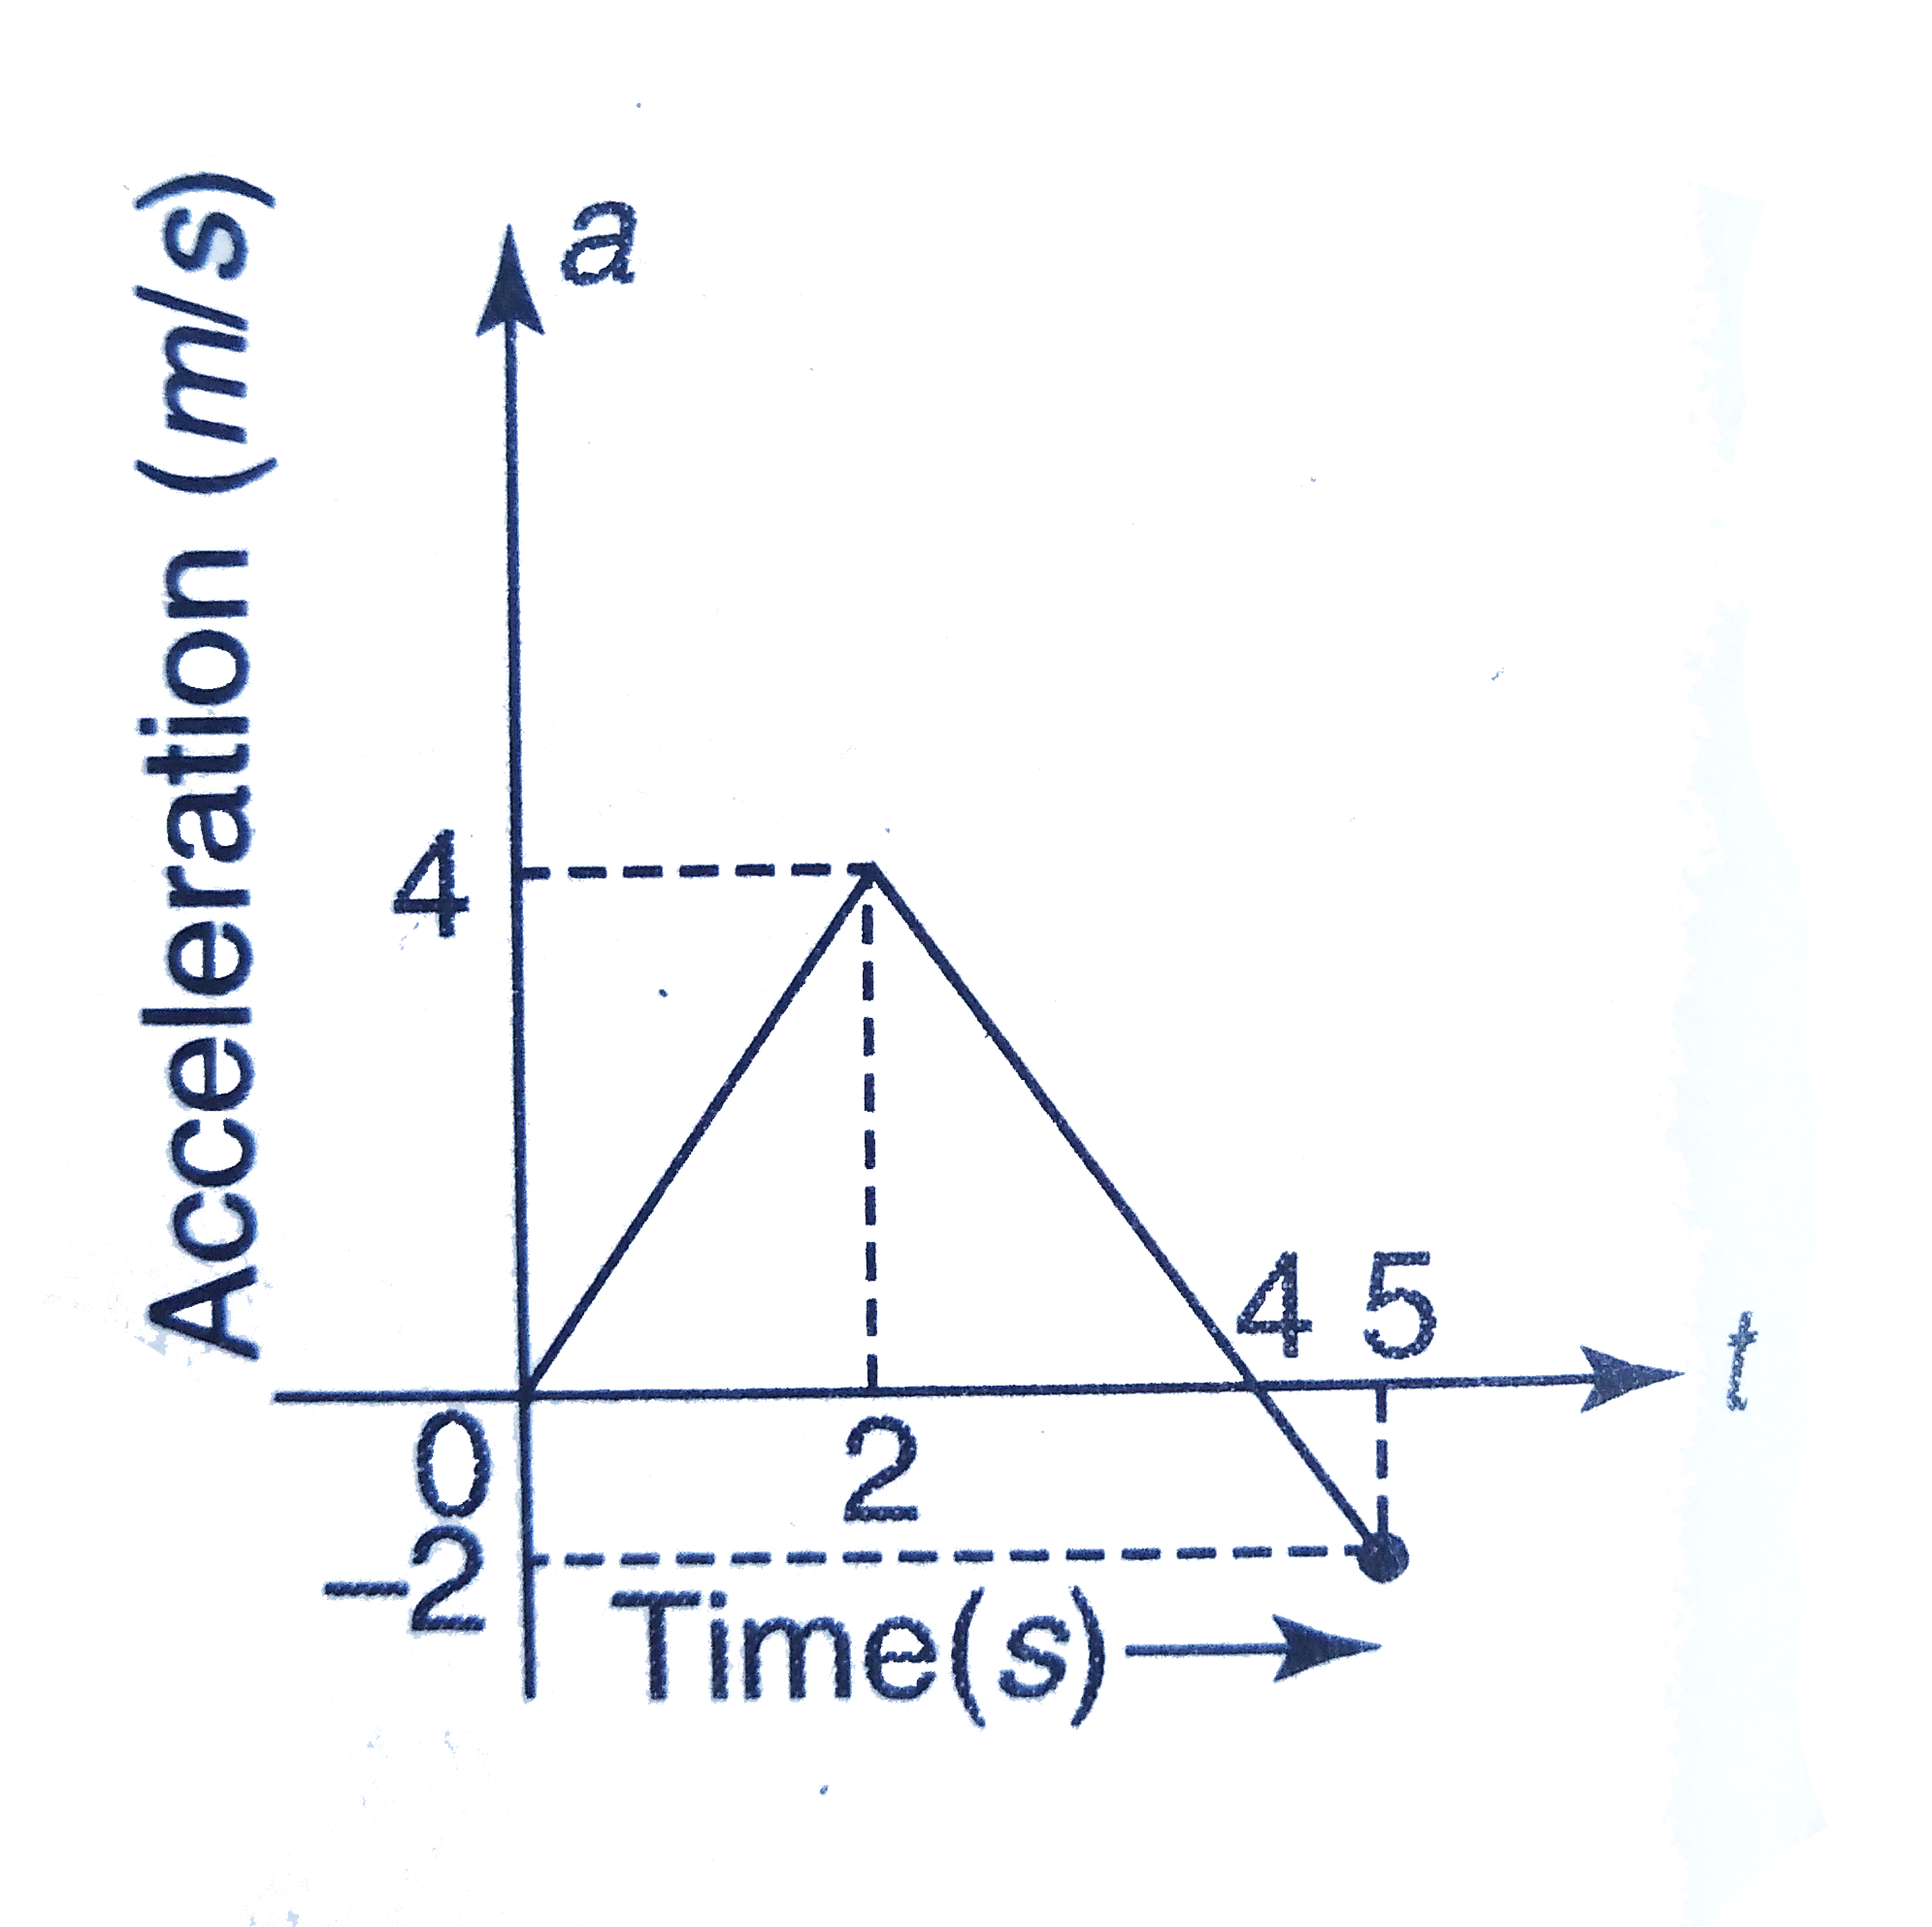
View SolutionFigure shows the graph of acceleration of particle as a function of time. The maximum speed of the particle is (particle starts from rest).
View Solution
