Which of the graph shows a particle with retardation?


The correct Answer is:C
In option (c), displacement increases with time but the rate at which displacement increases, decreases with time, so velocity decreases.
Topper's Solved these Questions
- DESCRIPTION OF MOTIONBOOK - CENGAGE PHYSICSCHAPTER - DESCRIPTION OF MOTIONEXERCISE - CONSOLIDATED EXERCISE (MULTIPLE-CHOICE QUESTIONS WITH ONE OR MORE THAN ONE CORRECT ANSWER)
6 Videos
- DESCRIPTION OF MOTIONBOOK - CENGAGE PHYSICSCHAPTER - DESCRIPTION OF MOTIONEXERCISE - CHALLENGING EXERCISE
6 Videos
- DESCRIPTION OF MOTIONBOOK - CENGAGE PHYSICSCHAPTER - DESCRIPTION OF MOTIONEXERCISE - CONSOLIDATED EXERCISE (MATCH THE COLUMNS)
3 Videos
- ELASTICITYBOOK - CENGAGE PHYSICSCHAPTER - ELASTICITYEXERCISE - OLYMPIAD AND NTSE LEVEL EXERCISES
10 Videos
Similar Questions
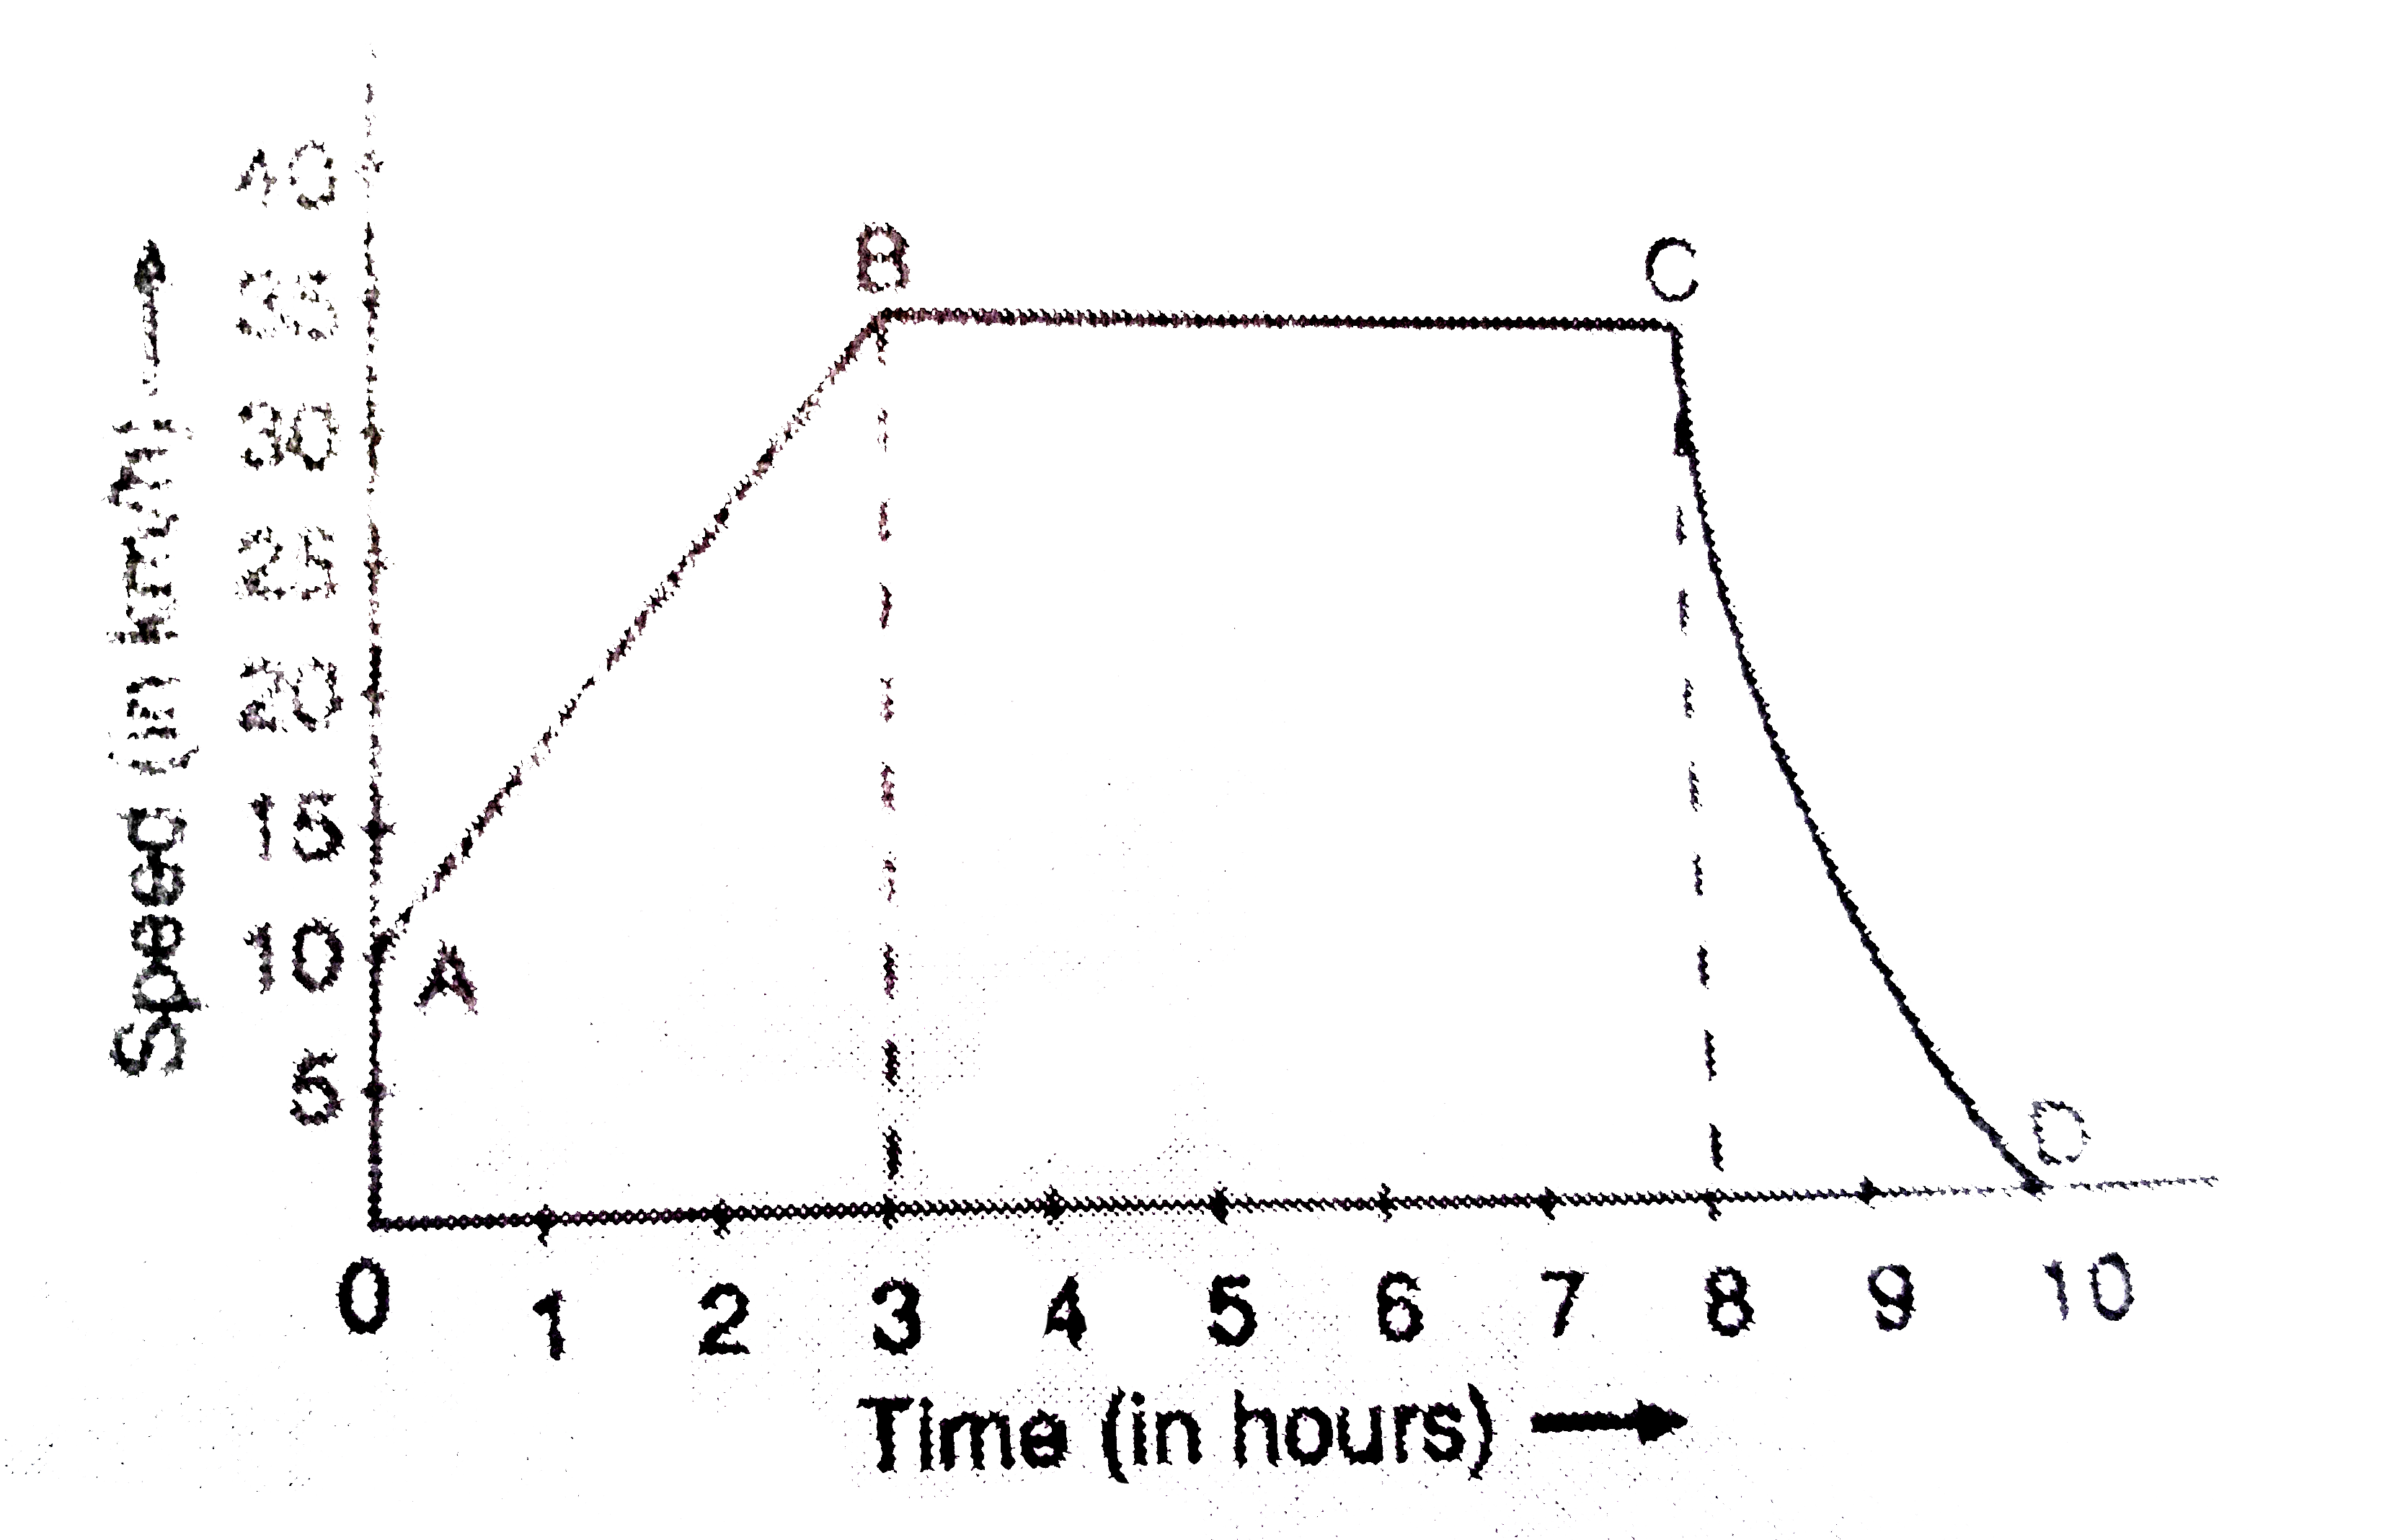
The graph given alongside shows how the speed of a car changes with time :
(i) What is the initial speed of the car ? ltBrgt (ii) What is the maximum speed attained by the car ? ltBrgt (iii) Which part of the graph shows zero acceleration ? ltBrgt (iv) Which part of the graph shows varying retardation ?
(v) Find the distance travelled in first 8 hours.
View SolutionThe following figure represents the velocity-time graph of a moving car on a road:
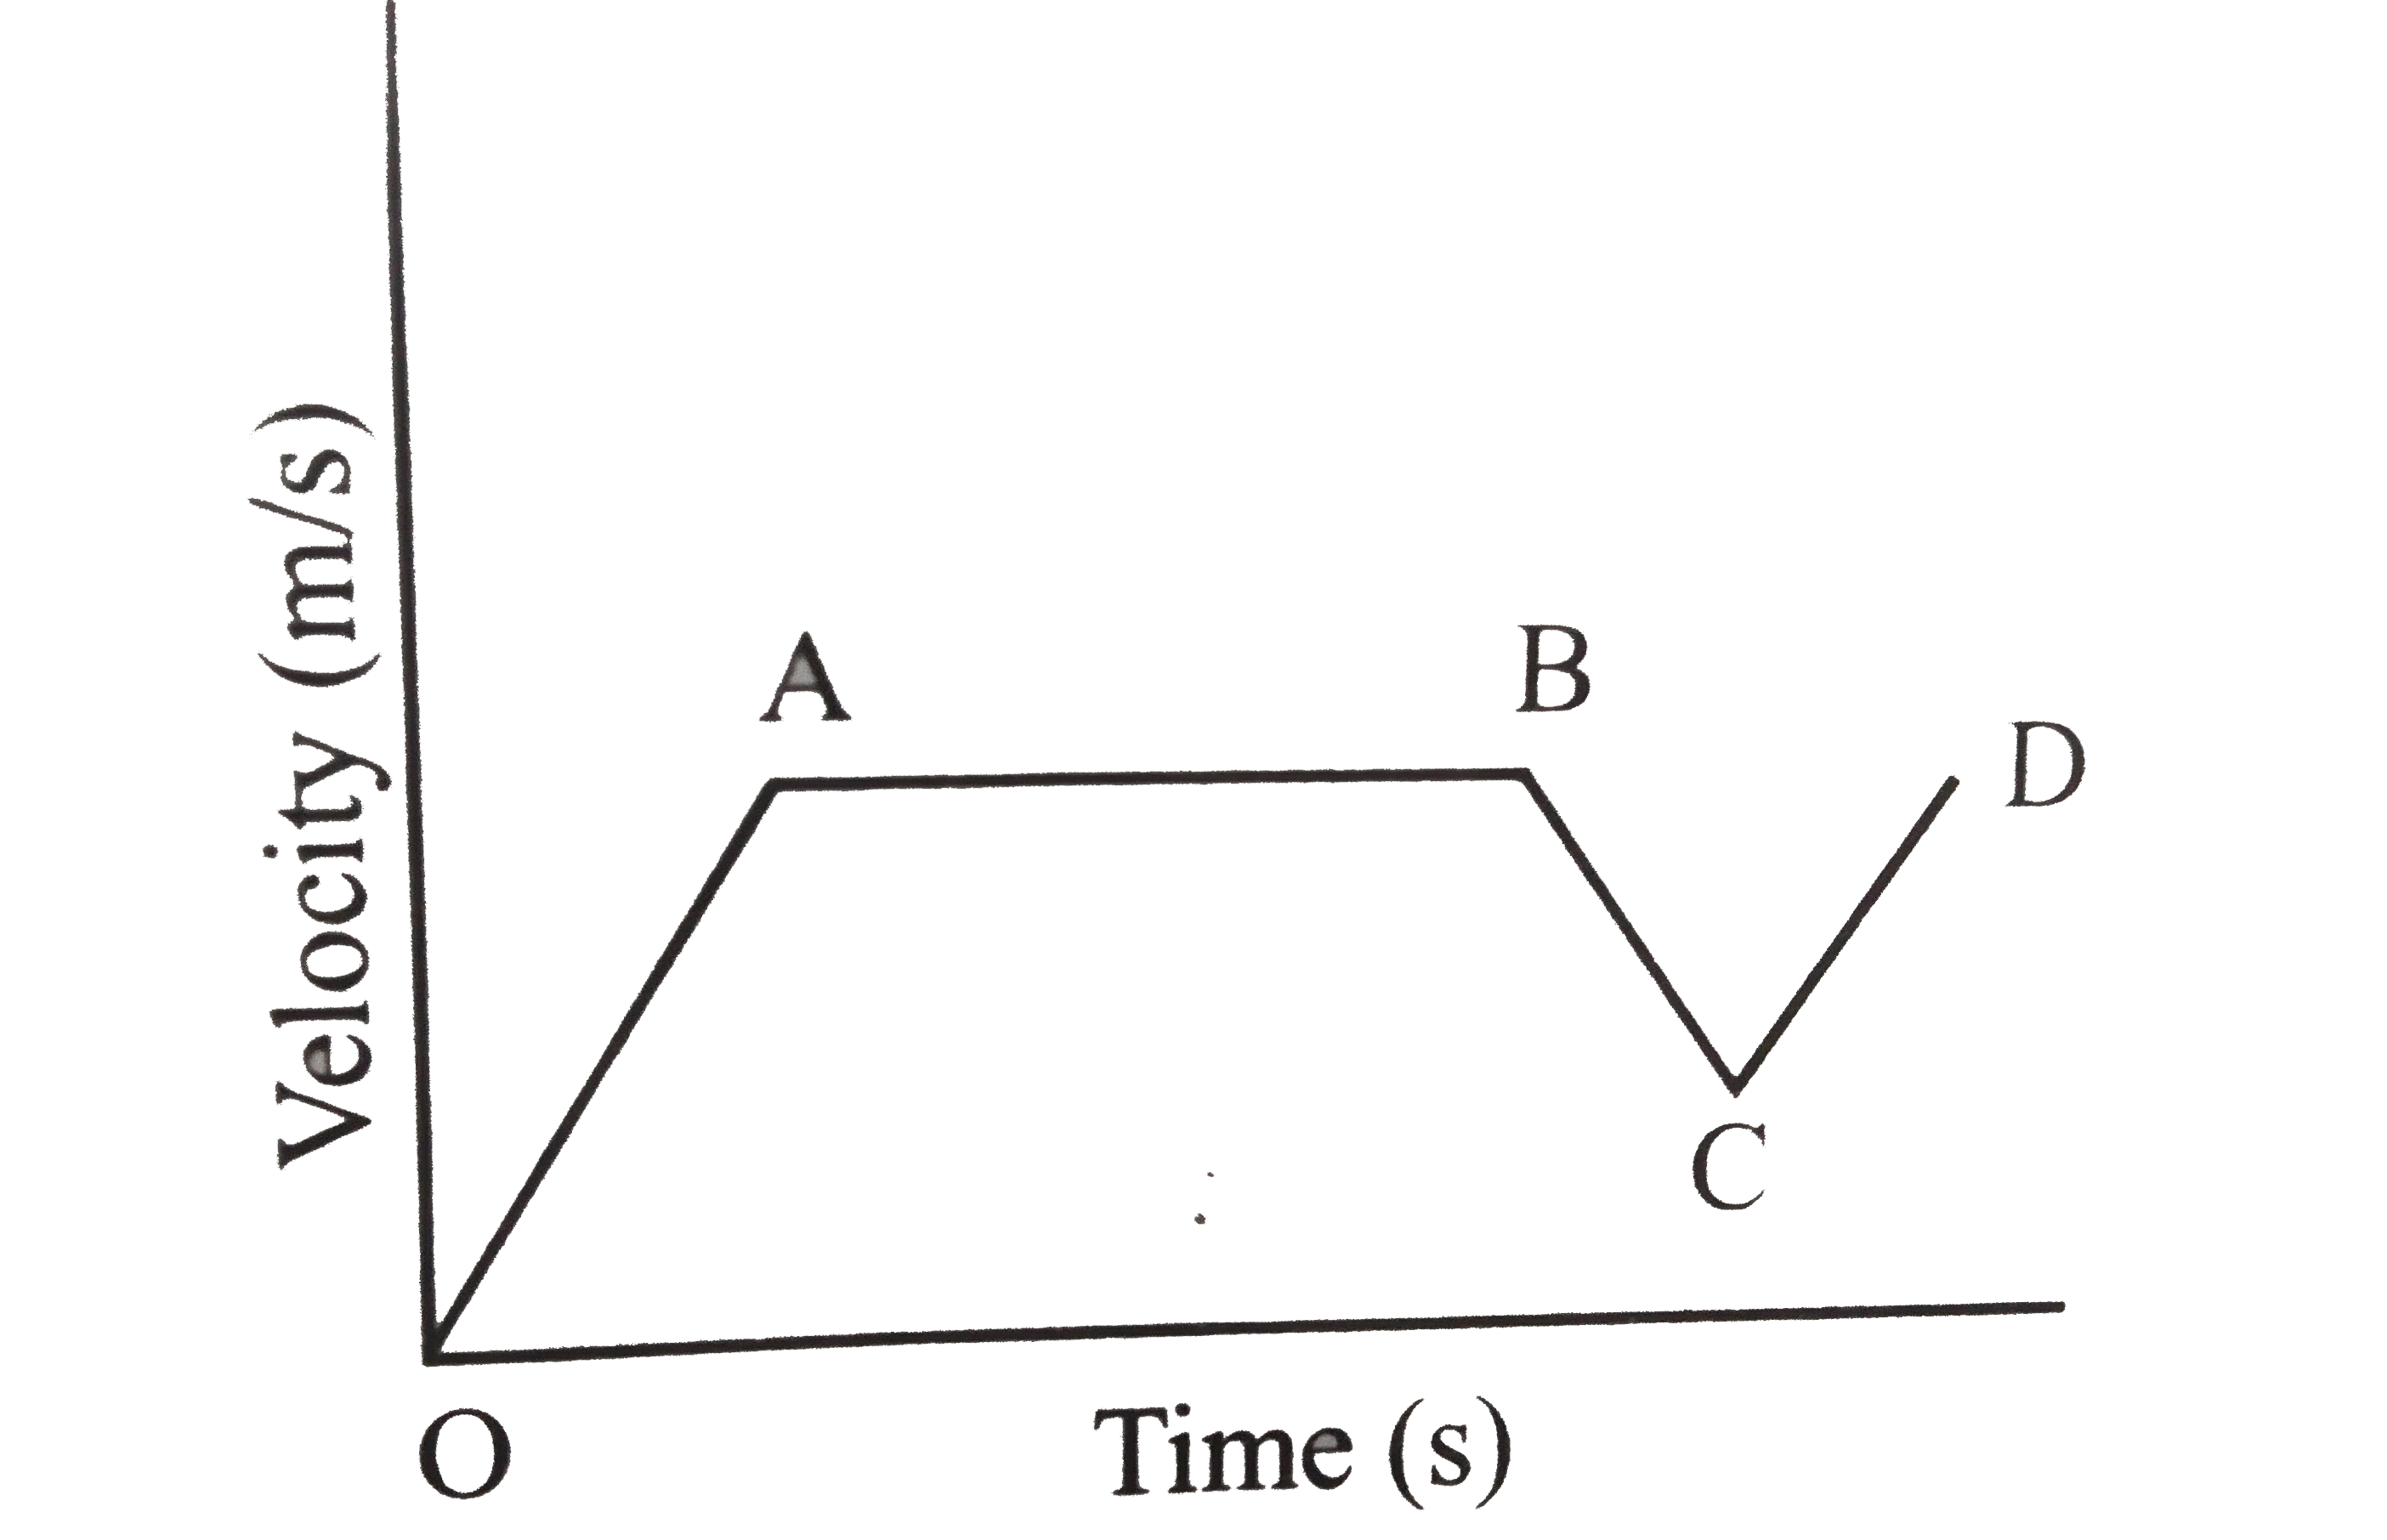
Which segment of the graph represents the retardation?
View Solution
Knowledge Check
Which of the graph shows that the particle is at rest .
A B
B C
C D
D
Which of the following graph(s) represent retardation ? [v : velocity, t : time, x : position]
A B
B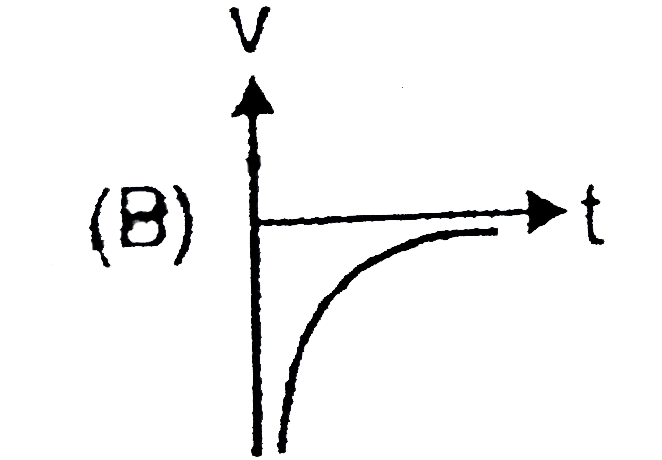 C
C D
D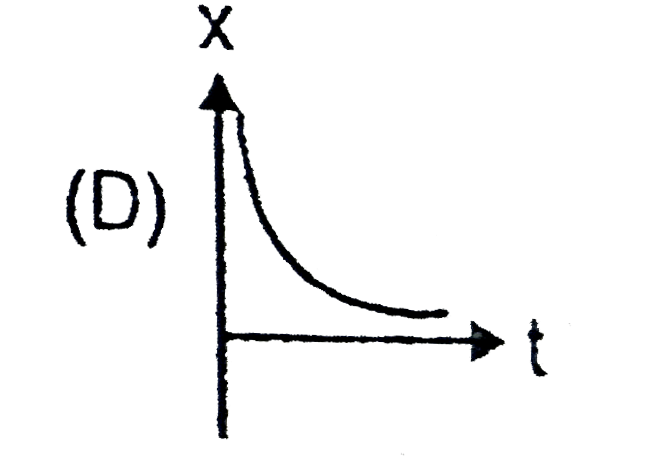
Which of the following graphs shows the variation of de-Broglie wavelength with potential through which a particle of charge q and mass m is accelerated ?
A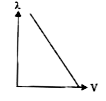 B
B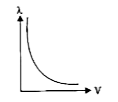 C
C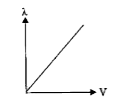 D
D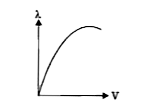
Which of the following graph(s) represent retardation ? [v : velocity, t : time, x : position]
View SolutionGive the equations of motion of a particle undergoing retardation along a straigth line.
View SolutionFigure shows a graph of potential energy.
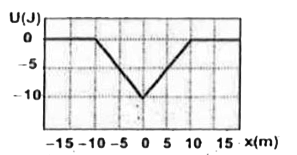
Consider the following graphs of position and time.
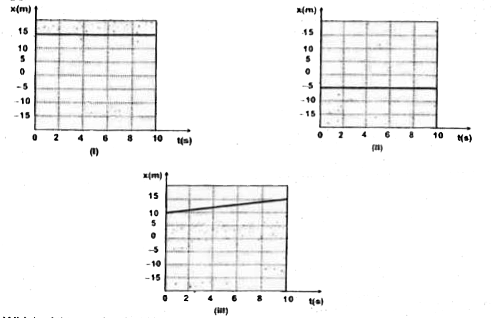
Which of the graphs could be the motion of a particle in the given potential?
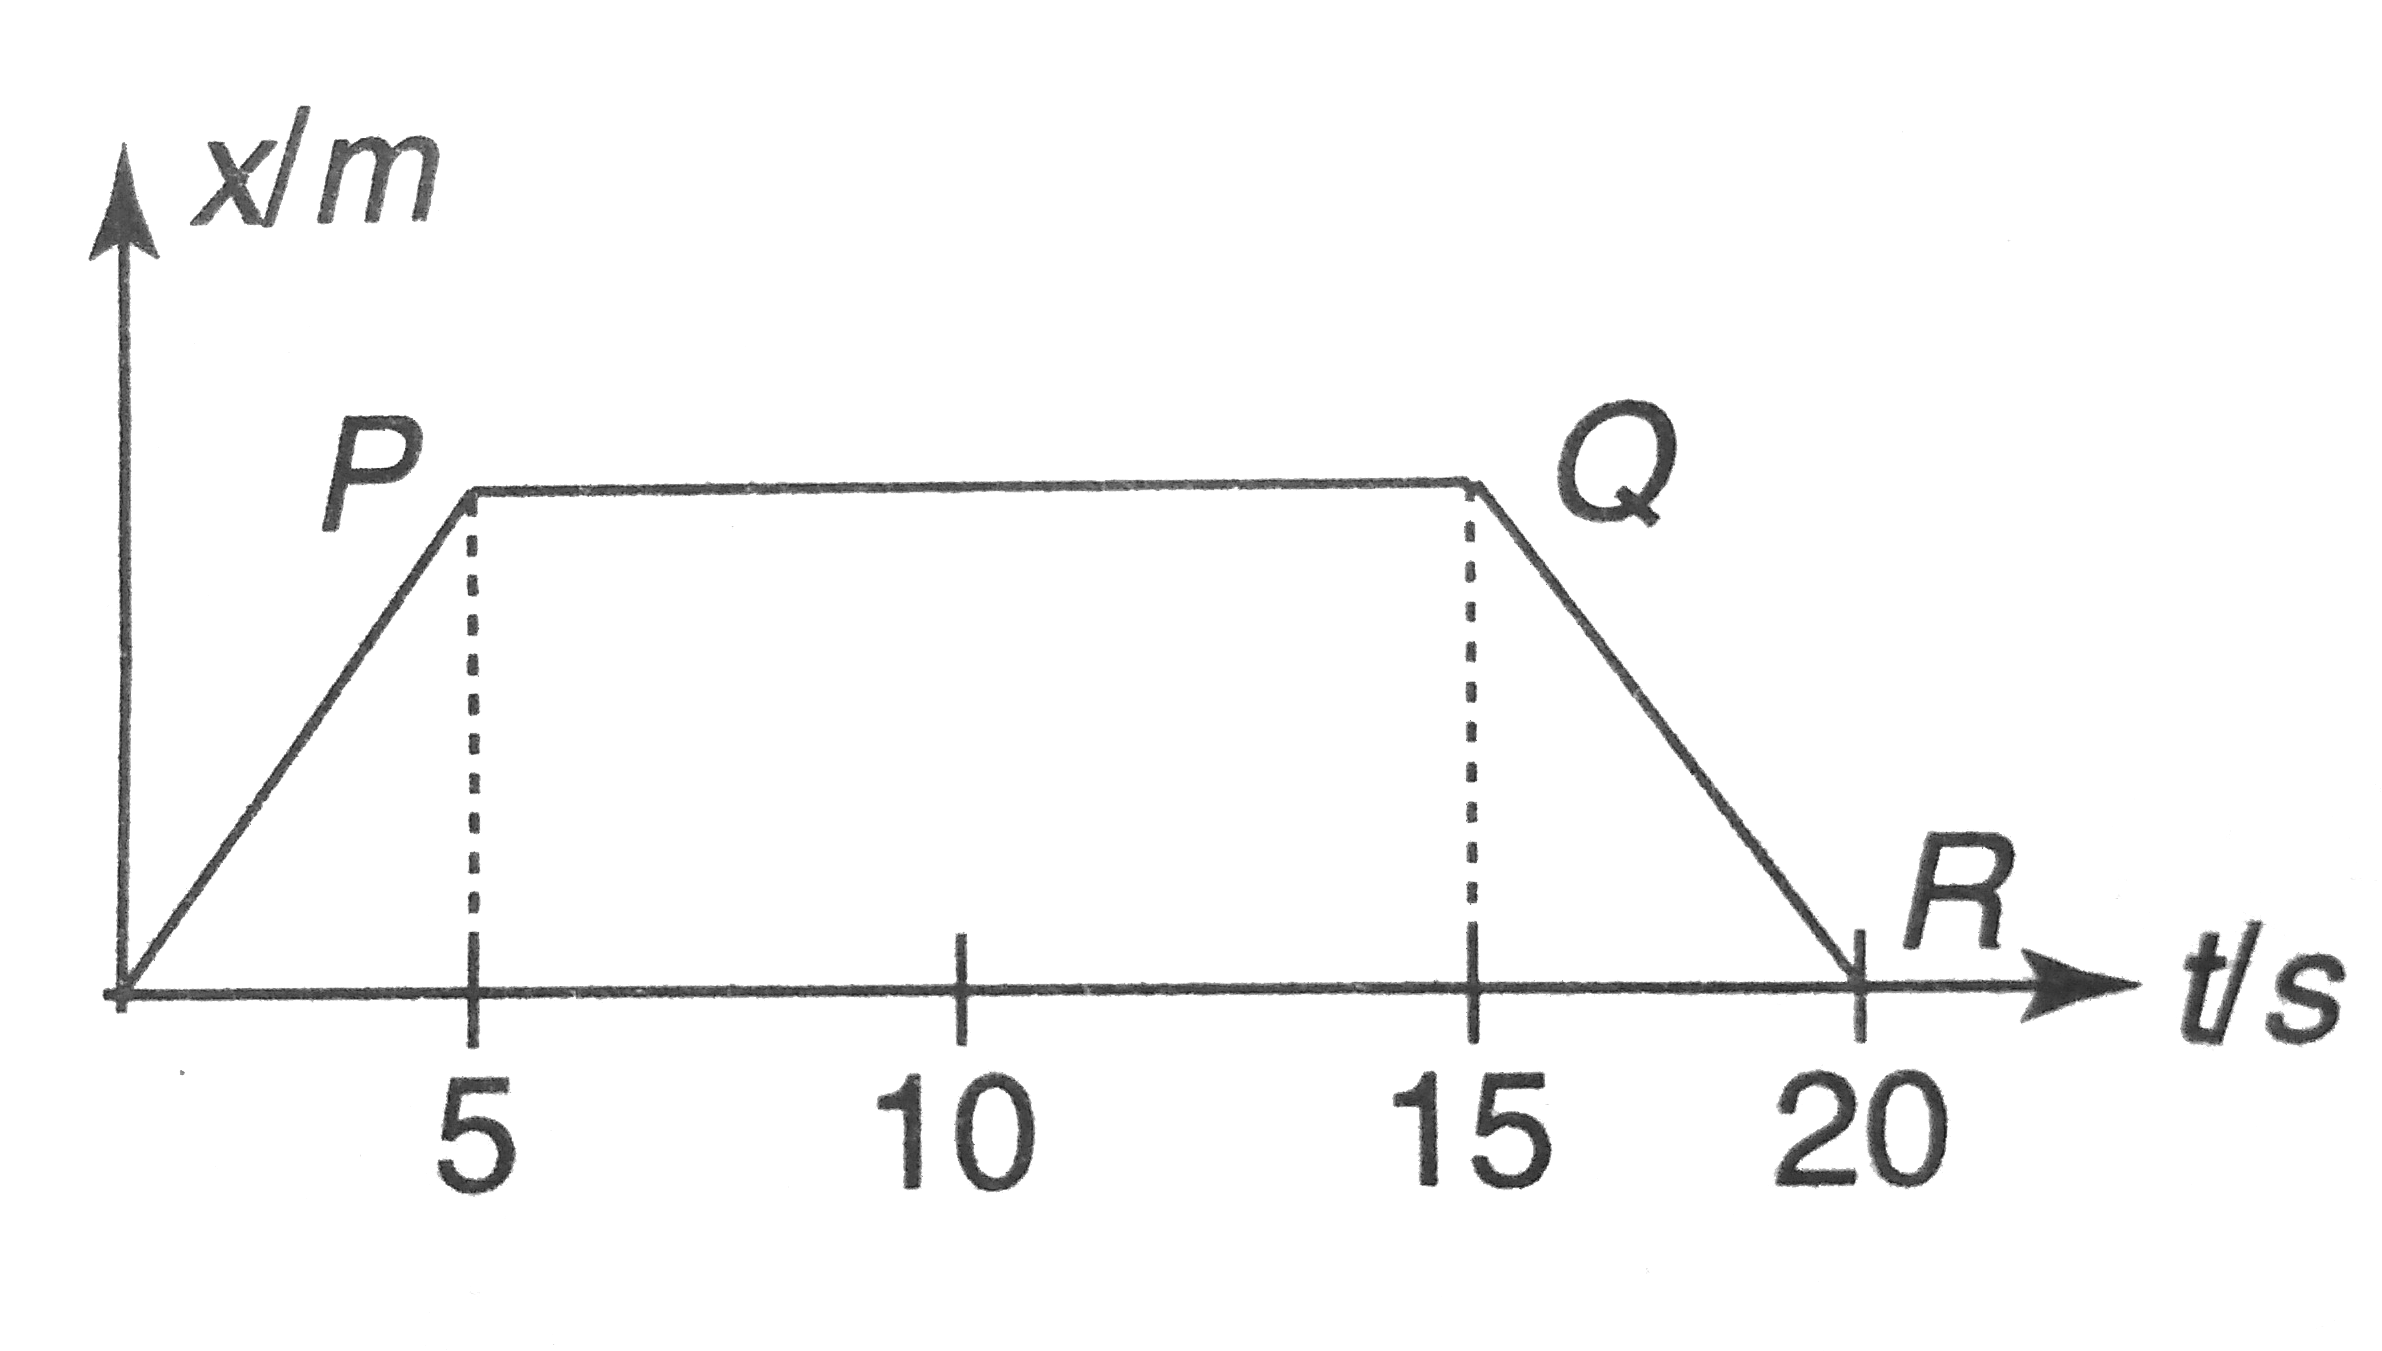
View SolutionFigure shows the position the graph for a particle in one dimensional motion. Which of the graphs in fugure represent the variation in the velocity of the particle with time ?
View SolutionFigure shows a graph of potential energy.

Consider the following graphs of position and time.

Which of the graphs could be the motion of a particle in the given potential?
View Solution
