Figure shows a graph of potential energy.
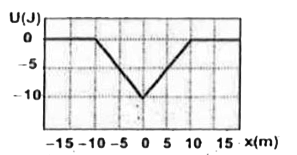
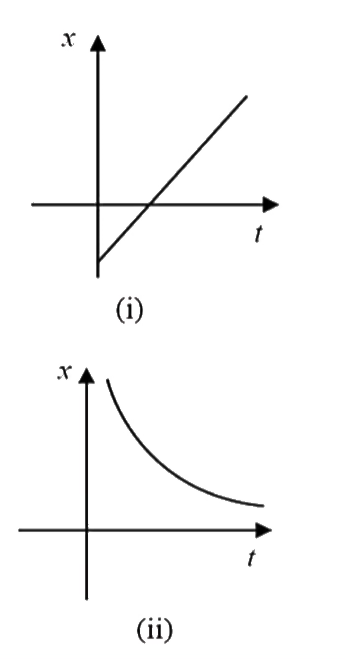
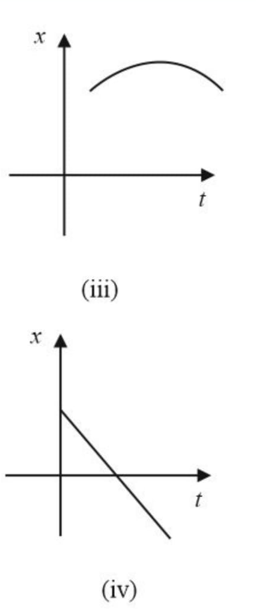
Consider the following graphs of position and time.
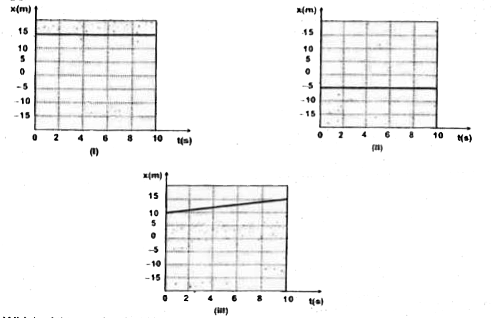
Which of the graphs could be the motion of a particle in the given potential?
I
II
I and II
I and III
The correct Answer is:D
Step by step video & image solution for Figure shows a graph of potential energy. Consider the following graphs of position and time. Which of the graphs could be the motion of a particle in the given potential? by Physics experts to help you in doubts & scoring excellent marks in Class 12 exams.
Updated on:21/07/2023Similar Questions
Figure shows a graph of potential energy.
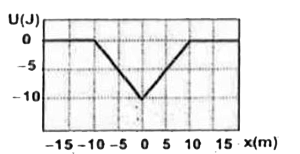
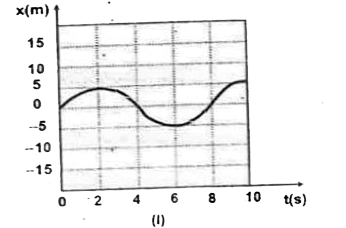
Consider the following graph of position and time , which represents the motion of the certain particle in the given potential. What is the total energy of the particle?
View SolutionWhich of the following graphs represents the motion of a particle moving with constant velocity?
View Solution
Knowledge Check
Which of the following graphs could not be the graph of a function?
A B
B C
C D
D
Which of the following graphs represents the position time-graph of a particle moving with negative velocity?
A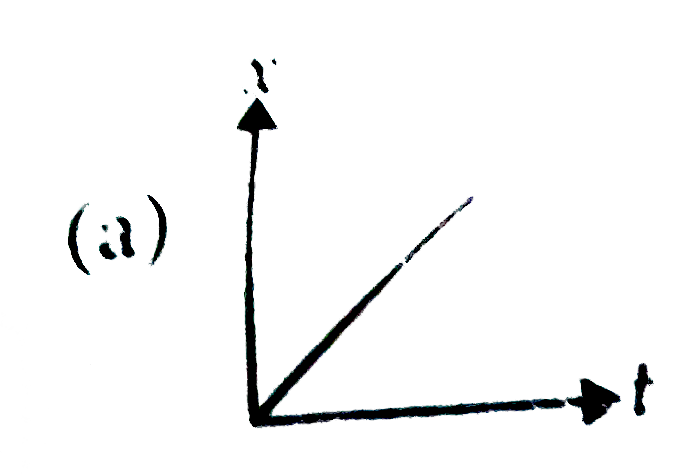 B
B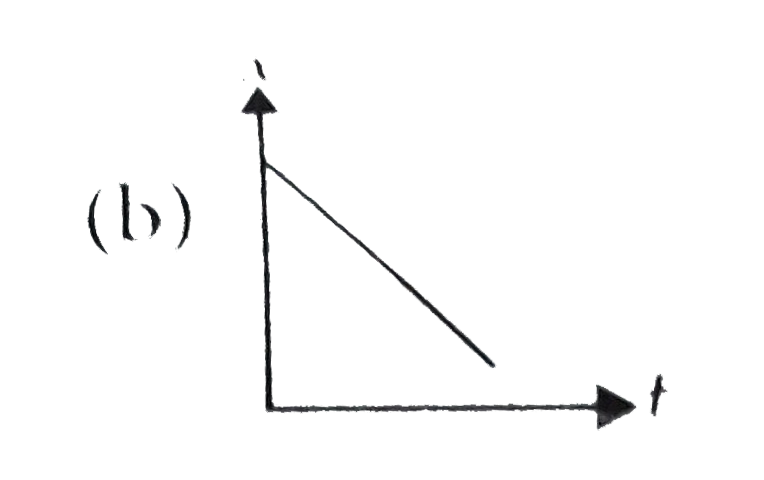 C
C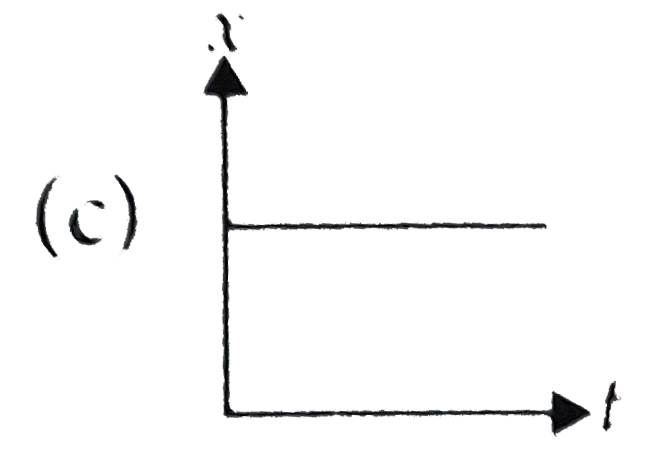 D
D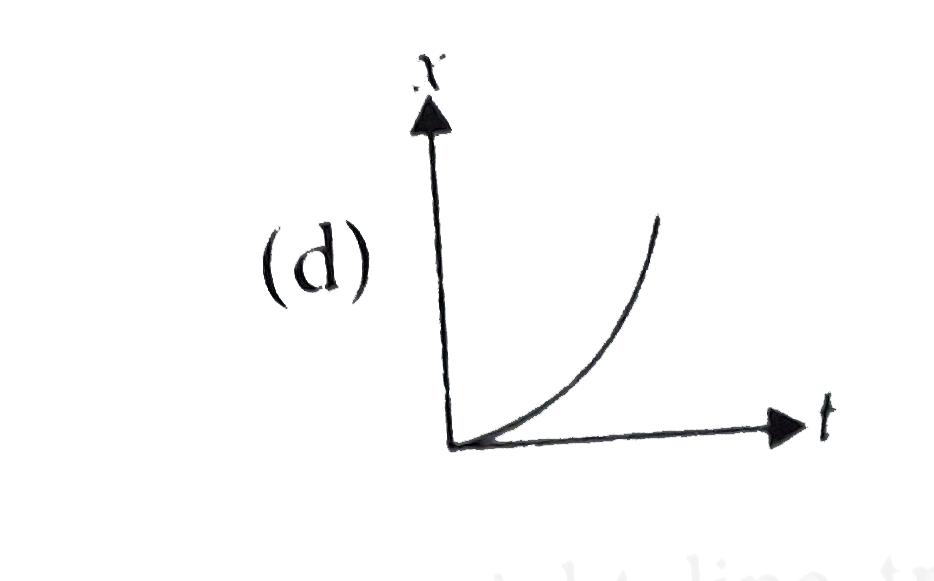
Which of the following graphs cannot possibly represent one dimensional motion of a particle?
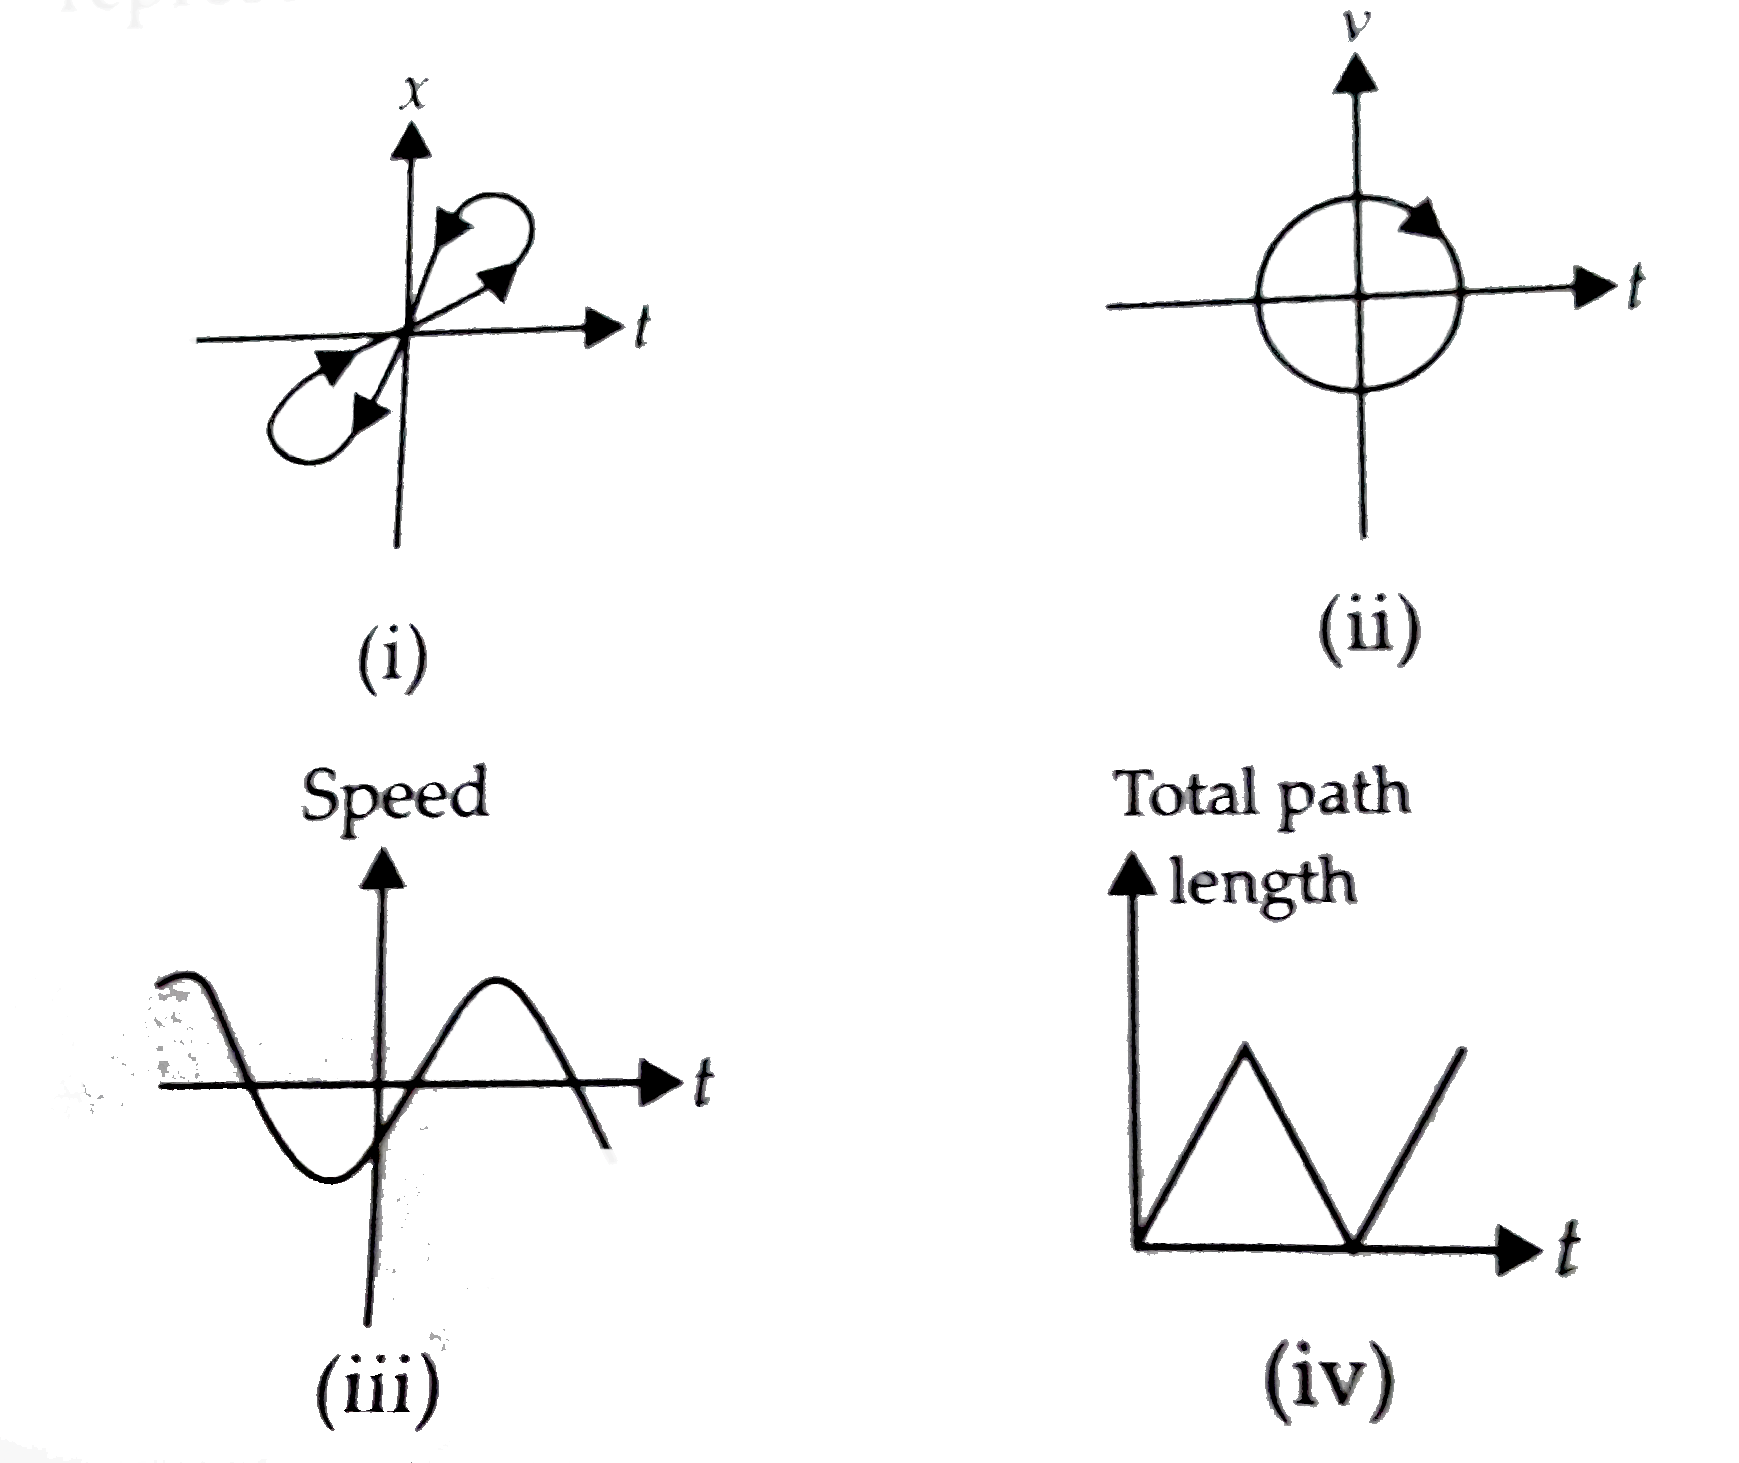 A(i) and (ii)B(ii) and (iii)C(i), (ii) and (iii)DAll four
Which of the following graphs cannot possibly represent one dimensional motion of a particle?

View SolutionThe first graph shows the potential energy U(x) for a particle moving on the x axis. Which of the other four graphs correctly gives the force F exerted on the particle?
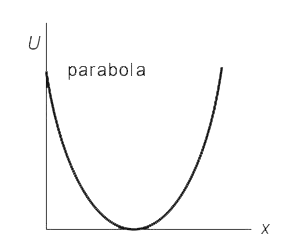
View SolutionAn object thrown vertically. Thevelocity-time graph for the motion of the particle is .
View SolutionThe graph showing the energy spectrum of β particle is
View SolutionFigure shows the stress-strain graphs for materials .A and B. From the graph it follows that
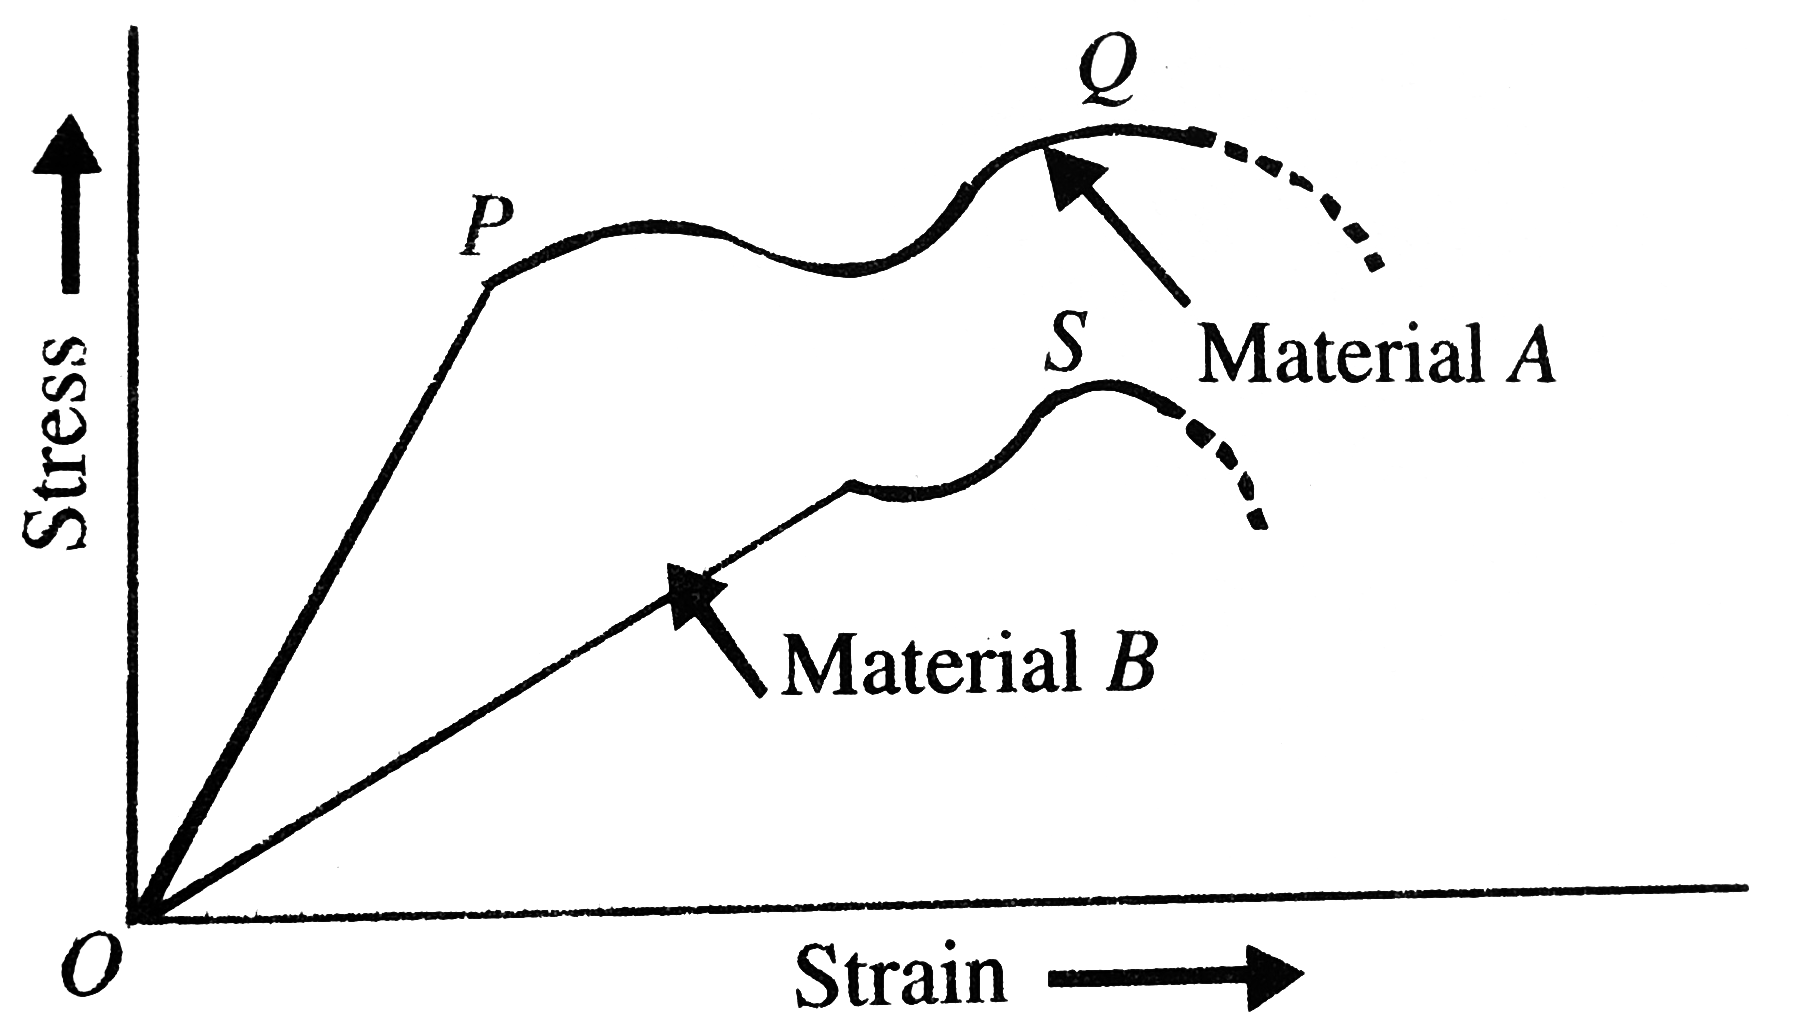
View Solution