A study was conducted to find out the concentration of sulphur dioxide in the air in parts per million (ppm) of a certain city. The data obtained for 30 days is a follows :

(i) Make a grouped frequency distribution table for this data with class-intervals as 0.00−0.04,0.04−0.08 and so on.
(ii) For how many day's was the concentration of sulphar dioxide more than 0.11 parts per million (ppm)?
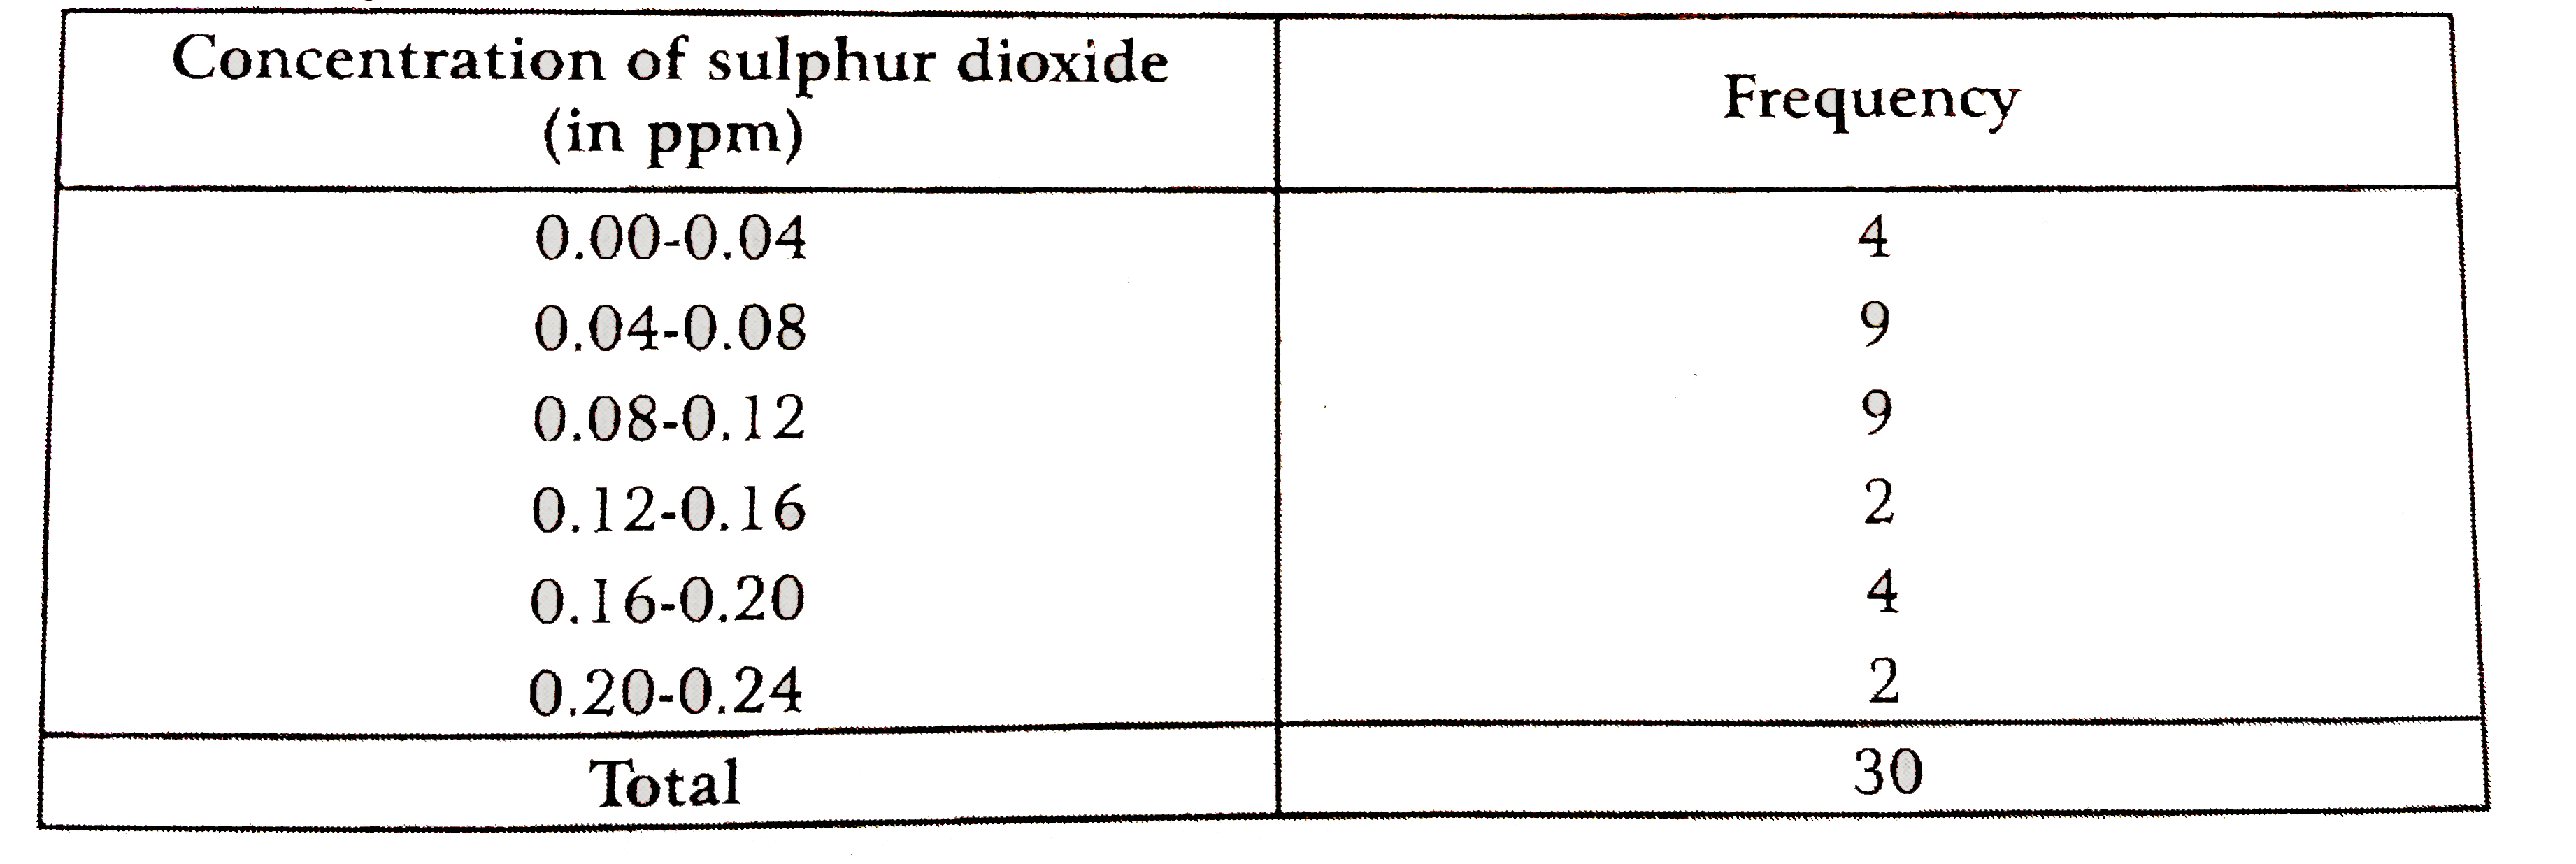
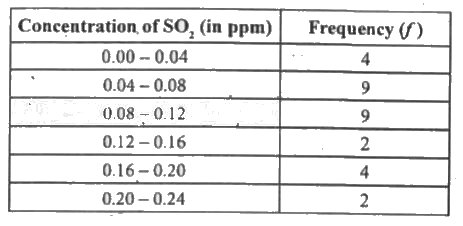
(i) We condense the given data into group like 0.00−0.04,0.04−0.08,….0.20−0.24. (since, our data is form 0.01 to 0.22). The class width in this case is 0.04.
Now, the given data can be condensed in tabular form as follows:

(ii) The concertration of sulphar dioxide was more than 0.11 ppm for 2+4+2=8 days (by table).
Topper's Solved these Questions
- BOOK - NAGEEN PRAKASHAN ENGLISHCHAPTER - STATISTICSEXERCISE - Exercise 14a10videos
STATISTICS
- BOOK - NAGEEN PRAKASHAN ENGLISHCHAPTER - STATISTICSEXERCISE - EXERCISE 14B13videos
STATISTICS
- BOOK - NAGEEN PRAKASHAN ENGLISHCHAPTER - STATISTICSEXERCISE - Revision Exercise12videos
STATISTICS
- BOOK - NAGEEN PRAKASHAN ENGLISHCHAPTER - QUADRILATERALSEXERCISE - Revision Exercise (long Answer Questions)5videos
QUADRILATERALS
- BOOK - NAGEEN PRAKASHAN ENGLISHCHAPTER - SURFACE AREA AND VOLUMEEXERCISE - Revision Exercise (long Answer Questions)10videos
SURFACE AREA AND VOLUME
Similar Questions
From the frequency distribution table from the following data
 View Solution
A study was conducted to find out the concentration of sulphur dioxide in the air in parts per million (ppm) of a certain city. The data obtained for 30 days is as follows: 0.03 0.08 0.08 0.09 0.04 0.170.16 0.05 0.02 0.06 0.18 0.200.11 0.08 0.12 0.13 0.22 0.070.08 0.01 0.10 0.06 0.09 0.180.11 0.07 0.05 0.07 0.01 0.04 (i) Make a grouped frequency distribution table for this data with class intervals as 0.00 - 0.04, 0.04 - 0.08, and so on.(ii) For how many days, was the concentration of sulphur dioxide more than 0.11 parts per million?
View SolutionTo find out the concentration of SO2 in the air (in parts per million, i.e., ppm), the data was collected for 30 localities in a certain city Find the mean concentration of SO2 in the air.
 View Solution
To find out the concentration of SO2in the air (in parts per million, i.e., ppm), the data was collected for 30 localities in a certain city and is presented below:Find the mean concentration of SO2in the air.
View SolutionA study was conduced to find out the concentration of sulphur dioxide in the air in parts per million (ppm) of a certain city. The data obtained for 30 days is as follow:
0.03 0.08 0.08 0.09 0.04 0.170.16 0.05 0.02 0.06 0.18 0.200.11 0.08 0.12 0.13 0.22 0.070.08 0.01 0.10 0.06 0.09 0.180.11 0.07 0.05 0.07 0.01 0.04
You were asked to prepare a frequency distribution table, regarding the concentration of sulphur dioxide in the air in parts per million of a certain city for 30 days. Using this table, find the probability of the concentration of sulphur dioxide in the interval 0.12-0.16 on any of these days.View SolutionPrepare a continuous grouped frequency distribution from the following data

Also, find the size of class intervals.View SolutionGiven below is the frequency distribution table regarding the concentration of sulphur dioxide in the air in parts per million of a certain city for 30 days.
Concentration0.00−0.040.04−0.080.08−0.120.12−0.160.16−0.200.20−0.24No. of days:489243
Find the probability of concentration of sulphur dioxide in the interval 0.12-0.16 on any of these days.View SolutionTo find out the concentrations of SO2 in the air (in parts per million, i.e., ppm), the data was collected for 30 localities in a certain city and is presented below: Concentration of SO2 (in ppm) Frequency 0.00 - 0.04 4 0.04 - 0.08 9 0.08 - 0.12 9 0.12 - 0.16 2 0.16 - 0.20 4 0.20 - 0.24 2 Find the mean concentration of SO2 in the air.
View SolutionGiven below is a cumulative frequency distribution showing the mars secured by 50 students of a class

From the frequency distribution table for the data.View SolutionThe following are weights (in kg) of 50 children taken at the time of birth:

Make an inclusive form grouped frequency distribution table with 0.3 kg as the width of ' each class.
Also, find the true class limits of each class.View Solution

