The following table gives the distribution of students of two sections according to the marks obtained by them

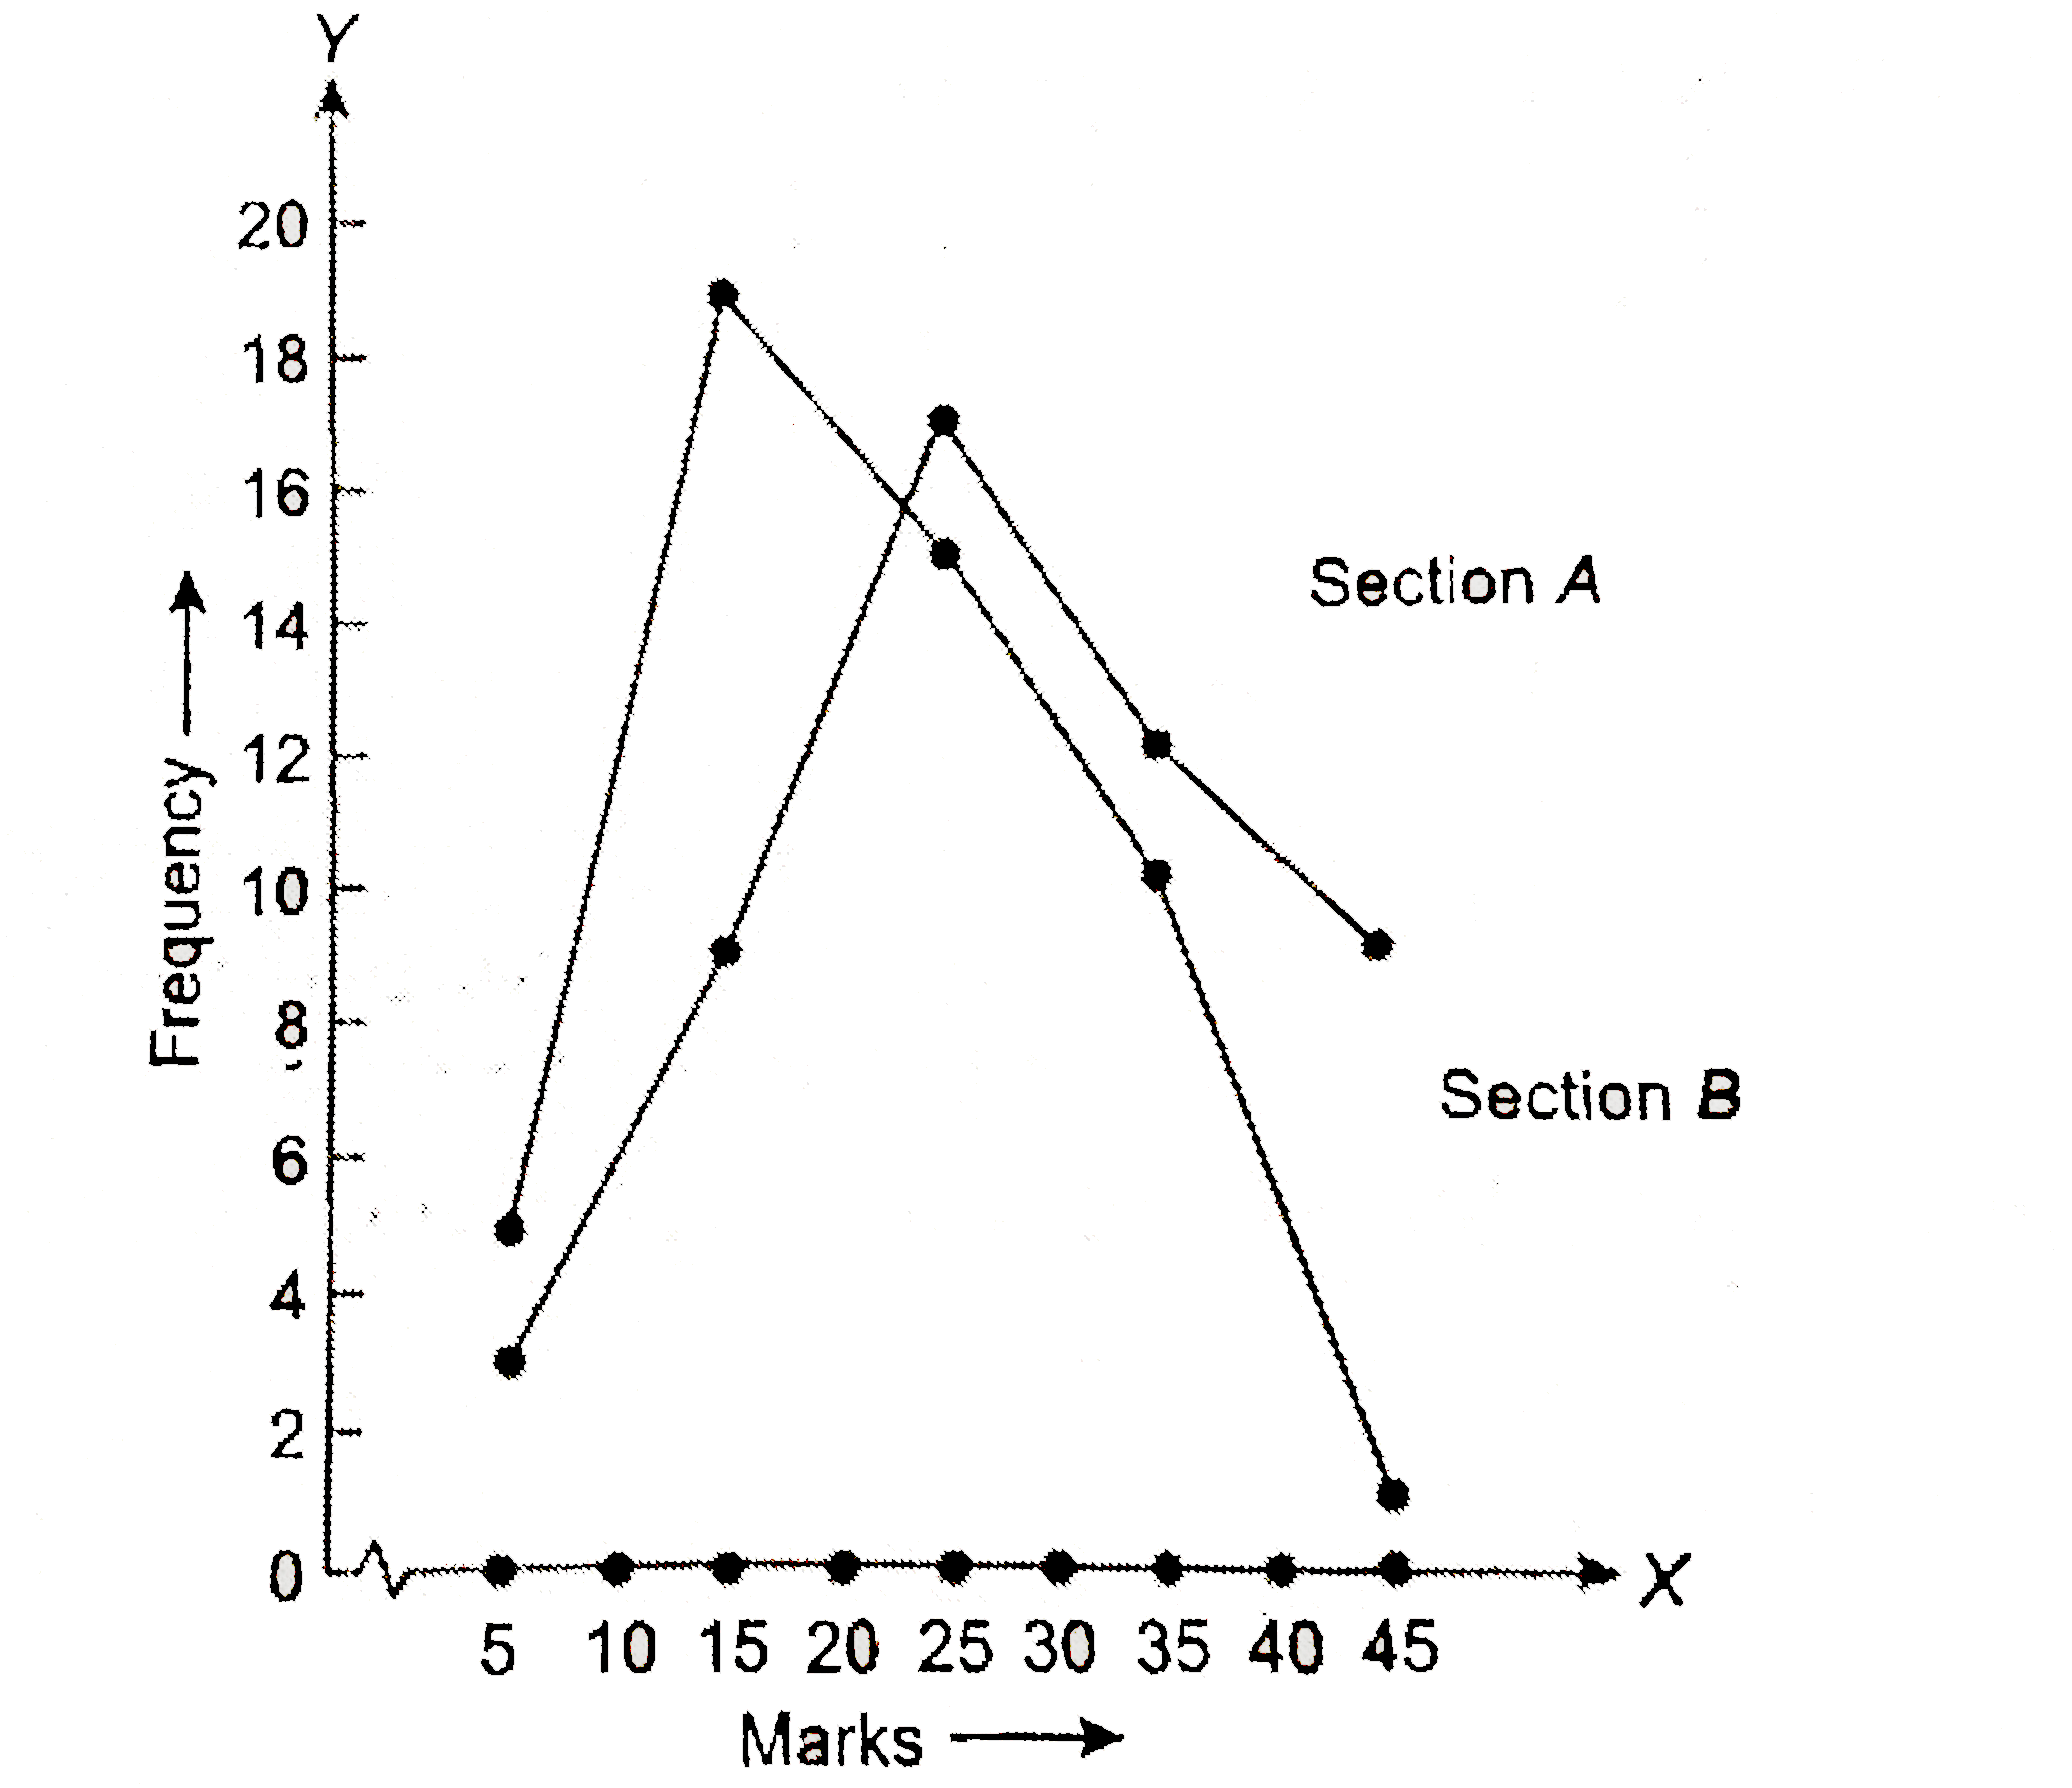
Represent the marks of the students of both the sections on the same graph by two frquency polygons. From the two polygons compare the performance of the two sections.
Here, we make modified tables by given data.
For section A,

For section B,

Now, required frequency polygon curves are:

Topper's Solved these Questions
- BOOK - NAGEEN PRAKASHAN ENGLISHCHAPTER - STATISTICSEXERCISE - Exercise 14a10videos
STATISTICS
- BOOK - NAGEEN PRAKASHAN ENGLISHCHAPTER - STATISTICSEXERCISE - EXERCISE 14B13videos
STATISTICS
- BOOK - NAGEEN PRAKASHAN ENGLISHCHAPTER - STATISTICSEXERCISE - Revision Exercise12videos
STATISTICS
- BOOK - NAGEEN PRAKASHAN ENGLISHCHAPTER - QUADRILATERALSEXERCISE - Revision Exercise (long Answer Questions)5videos
QUADRILATERALS
- BOOK - NAGEEN PRAKASHAN ENGLISHCHAPTER - SURFACE AREA AND VOLUMEEXERCISE - Revision Exercise (long Answer Questions)10videos
SURFACE AREA AND VOLUME
Similar Questions
A long magnet is cut in two parts in such a way that the ratio of their lengths is 2:1. The retio of pole strengths of both the section is
View SolutionWhich of the following graphs represents the relationship between the force F between two point charges and the distance r between them :
View SolutionA class of 50 students belonging to the Kindergraten is divided in two sections A and B , having students in the ratio 2:3 respectively. The average weight of the students of the entire calss is 40 Ibs. The average weight of the students of section A is 2 Ibs . less than that of the students B. What is the average weight of the students of section B ?
View SolutionMarks obtained by 40 students in a short asssessment is given below, where a and b are two missing data.

If the mean of the distribution is 7.2, find a and b.View SolutionMarks obtaind by 40 students in a short assessment is given below, where a and b are two missing data. If the mean of the distribution is 7.2 find a and b
View SolutionFollowing table shows the marks obtained by 8 students in English and Mathematics.

A candidate scored 85 marks in Y but was absent from the X test. Estimate his probable score for other test.View SolutionOut of 100 students, two sections of 40 and 60 are formed. If you and your friend are among the 100 students, what is the probability that(a) you both enter the same section?(b) you both enter the different sections?
View SolutionOut of 100 students two sections of 40 and 60 students are formed. If you and your friends are among the 100 students, what is the probability that i. You both enter the same section? ii. You both enter the different section?
View SolutionThe water flowing through the same tube having two different cross section areas has different flow rates .
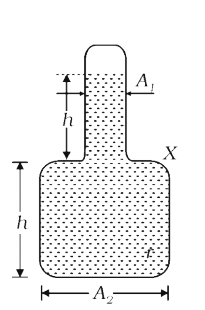
View SolutionThe vessel shown in the figure has two sections of areas of cross-section A1andA2. A liquid of density ρ fills both the section, up to a height h in each. Neglect atmospheric pressure. Choose correct options.
 View Solution

