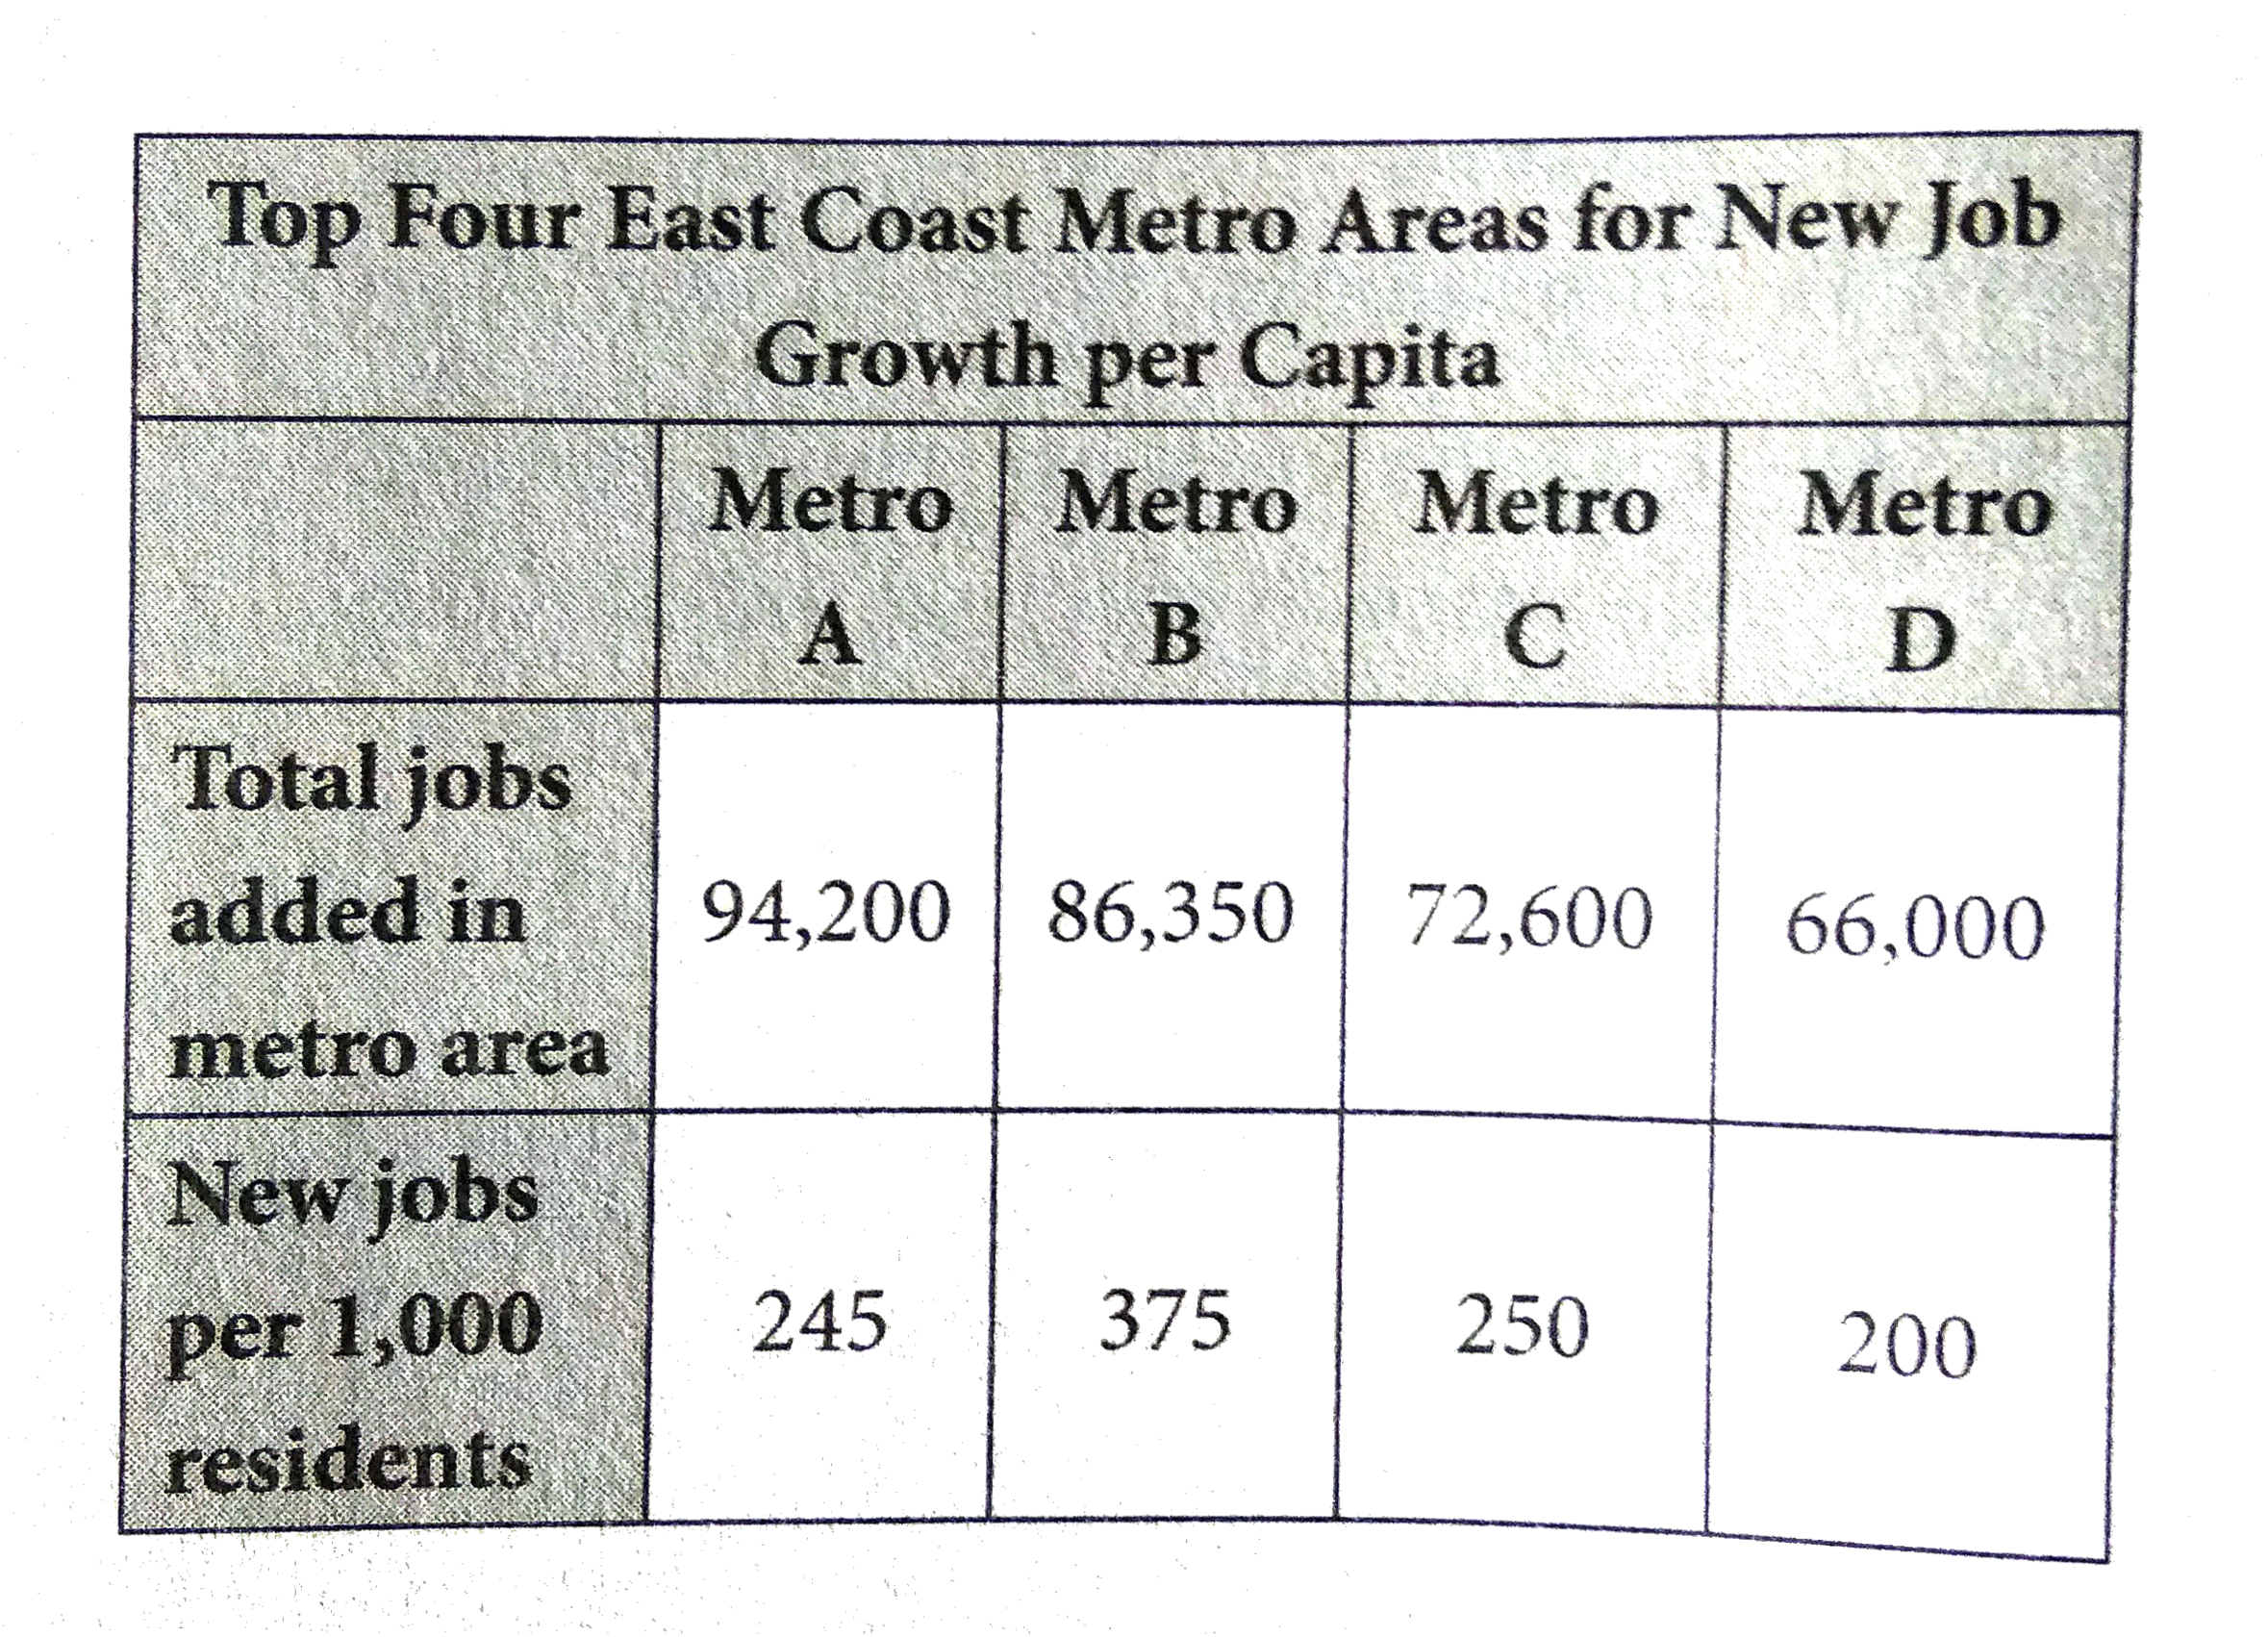
According to the information in the table, which of the following correctly orders the population of the metro areas from greatest to least?
A
A, B, C, D
B
D, C, B, A
C
A, D, C, B
D
A, D, B, C
Video Solution
Text Solution
The correct Answer is:C
Difficult: Hard
Category: Problem Solving and Data Analysis/ Statistics and Probability.
Strategic Advice: This is a trickly question because the two numbers given for each metro area (total jobs added and jobs per 1,000 residents) can't be used alone to answer the question. Think concenptually before making calculations.
Getting to the answer: The table shows the number of jobs added in total and the number added per 1,000 residents in each area. You need to set up and solve (using cross-multiplication) a proportion for each metro area that looks like new jobs1,000=total new jobtotal population. The total population is the unknown, so call it p.
Metro A:2451,000=94,200p→245p=94,200,00→p=384,490
Metro B:3751,000=86,350p→375p=86,350,000→p=230,267
Metro C:2501,000=72,600p→250p=72,600,000→p=290,400
Metro D:2001,000=66,000p→200p=66,000,000→p=330,000
Ordering the results from greatest to least gives A, D, C, B, which matches (C).
|
Updated on:21/07/2023
Topper's Solved these Questions
Similar Questions
Knowledge Check
- Question 1 - Select One
Which of the following inequalities orders the numbers 0.2,0.03and14 from least to greater?
A0.2<0.03<1.4B0.03<0.2<14C0.03<14<0.2D14<0.03<0.2
which of the following is not an attribute of a population?
View SolutionWhich of the following will decrease the density of population in a given area ?
View SolutionAccording to Bohr’s theory, which of the following correctly represents the variation of energy and radius of an electron in nth orbit of H-atom?
View SolutionWhich of the following is/are correct order in accordance of electropositive nature of metal ?
View SolutionWhich of the following correctly describes the measures that can be used to control over-population ?
View SolutionWhich of the following equation correctly represent species-area relationship?
View SolutionUsing the information in the following figure, find its area.
 View Solution

