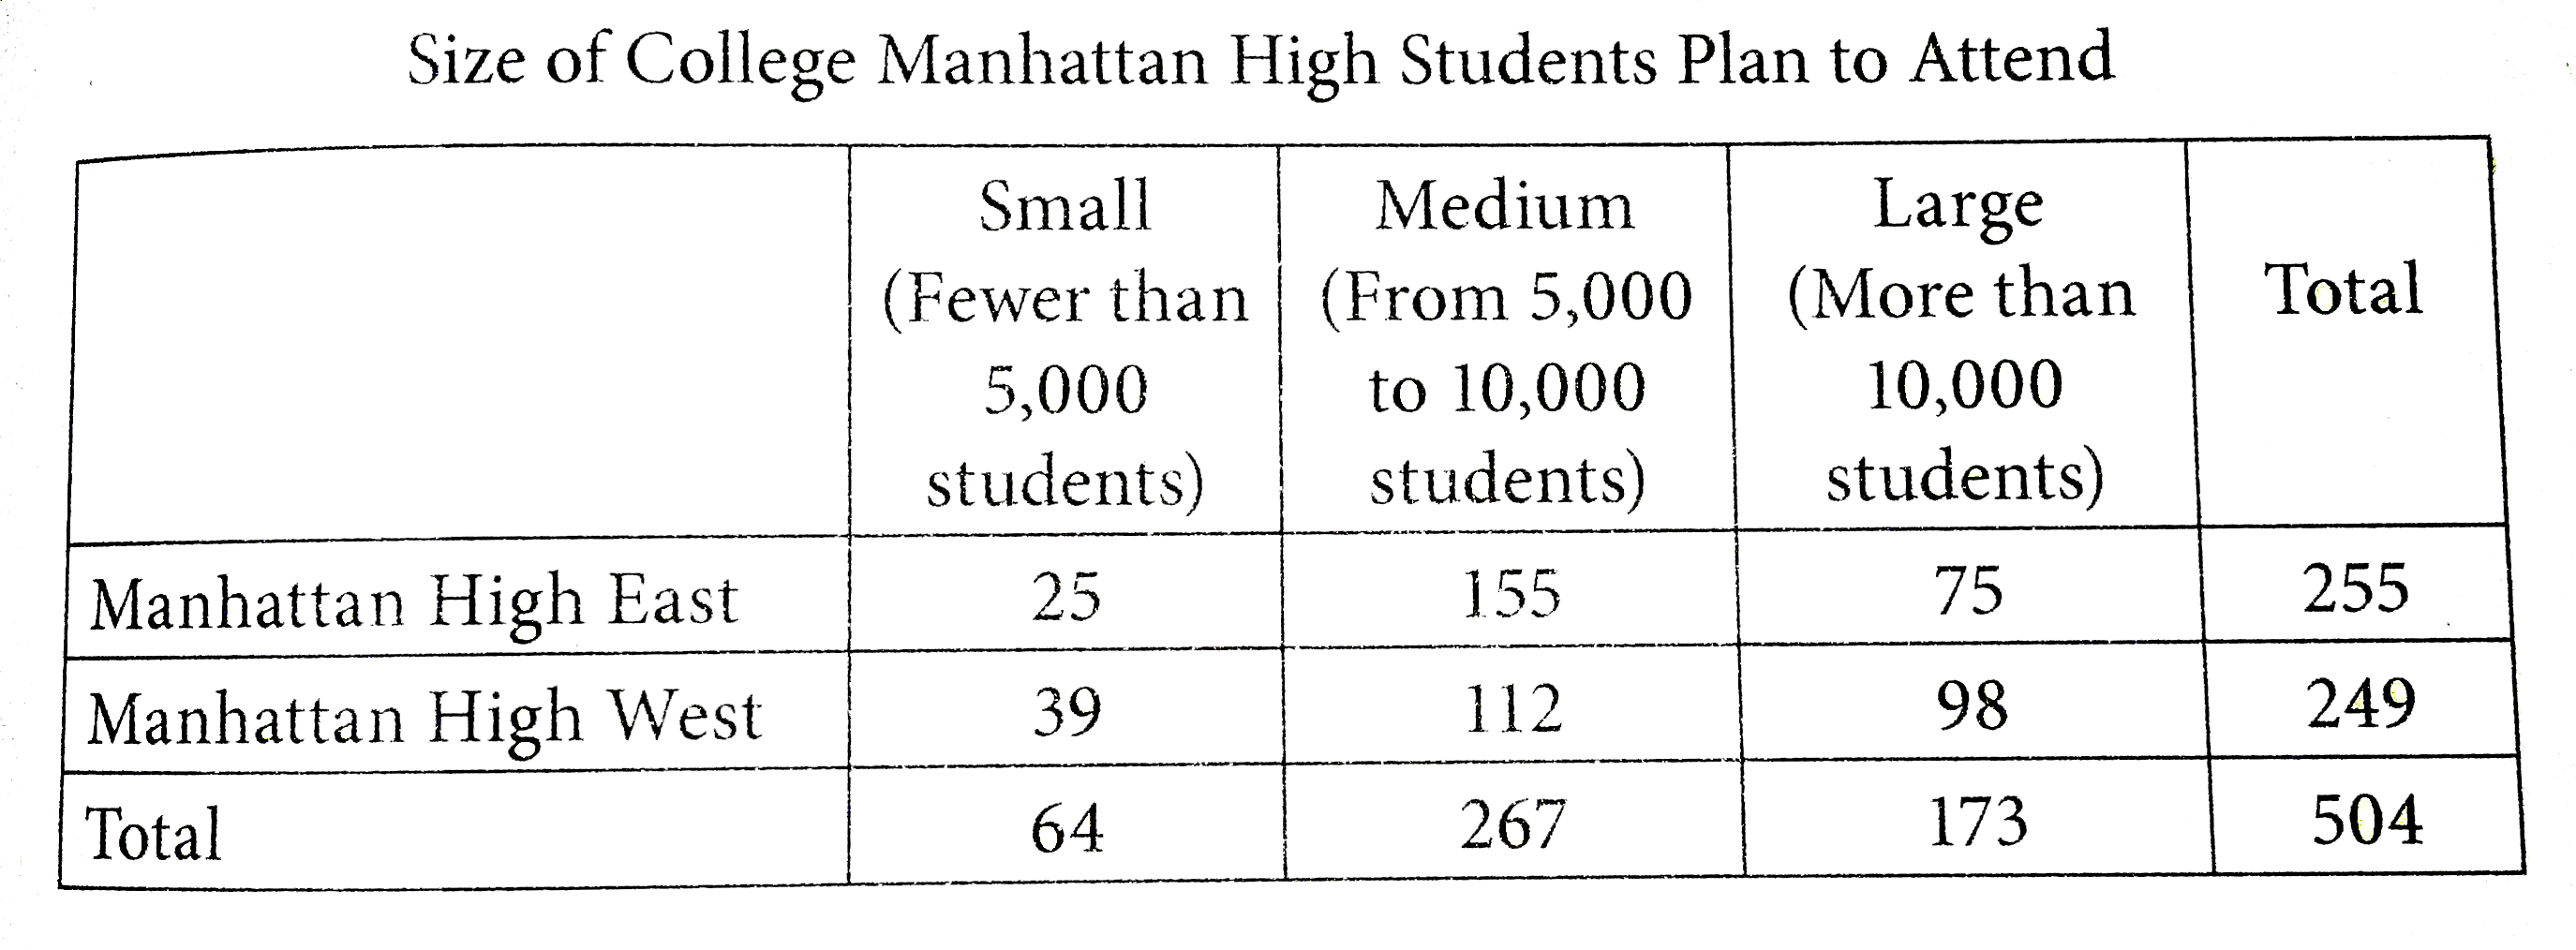
At two high schools, those planning to attend college after graduation were polled. The sizes of the colleges they planned to attend based on student body sizes were tabulated in the table above. The 255 polled students from Manhattan high east Had an average SAT score above 1100, and the 249 polled students from Manhattan High west had an average SAT score below 1100. IF a poll respondent were chosen at random from those planning to attend a college with atleast 5,000 students , what is the probability that the respondent would be enrolled at Manhattan High west?
210249
210440
230440
440504
The correct Answer is:B
Topper's Solved these Questions
- ADVANCED ARITHMETICBOOK - PRINCETONCHAPTER - ADVANCED ARITHMETICEXERCISE - Advanced Arithmetic Drill: Calculator-Permitted Section
16 Videos
- ADDITIONAL TOPICSBOOK - PRINCETONCHAPTER - ADDITIONAL TOPICSEXERCISE - QUICK QUIZ #9
3 Videos
- ALEGBRABOOK - PRINCETONCHAPTER - ALEGBRAEXERCISE - QUICK QUIZ #6
3 Videos
Similar Questions
20-2x
20-x
20
20+x
20+2x
What is the average (arithmetic mean) of the list of number above?
View Solution
The table above provides values for the function g for selected values of t. Which of the following defines the function g?
View SolutionIf (3x)2=81, which of the following is a possible value of x?
View Solution50 छात्रों की कक्षा में औसतन 70% अंक प्राप्त किए गए । प्रथम 25 छात्रों ने औसतन 60% अंक प्राप्त किए और 24 छात्रों ने औसतन 80% अंक प्राप्त किए। अंतिम छात्र ने कितने अंक प्राप्त किए ?
View SolutionHow many lines of symmetry does the above figure have ?
View SolutionDetermine the point of symmetry of a regular hexagon.
View SolutionDtermine the images of the following figure about the given line :
View SolutionMatch the following Column A to Column B

View SolutionMatch the following Column A to Column B

View SolutionMatch the following Column A to Column B

View SolutionFind the area of figure given below.

View SolutionFind the perimeter of the figure given below.

View SolutionFind the area of the figure given below.

View SolutionThe area of the shaded part in the figure given below is ______.

View SolutionThe inequation represented by the graph given below is :
View Solution
