Consider the following input/output table. Draw a line graph for it.

Now, use the graph drawn to predict the outputs for the inputs of 3 and 8.
The correct Answer is:8 and 23 respectively
Step by step video, text & image solution for Consider the following input/output table. Draw a line graph for it. Now, use the graph drawn to predict the outputs for the inputs of 3 and 8. by Maths experts to help you in doubts & scoring excellent marks in Class 8 exams.
Updated on:21/07/2023Topper's Solved these Questions
- LINE GRAPHS AND LINEAR GRAPHSBook:RS AGGARWALChapter:LINE GRAPHS AND LINEAR GRAPHSExercise:Exercise 23
Explore 25 Videos
- INTRODUCTION TO COORDINATE GEOMETRYBook:RS AGGARWALChapter:INTRODUCTION TO COORDINATE GEOMETRYExercise:EXERCISE B (OBJECTIVE QUESTIONS)
Explore 7 Videos
- LINEAR EQUATIONSBook:RS AGGARWALChapter:LINEAR EQUATIONSExercise:TEST PAPER-8 (D) (Write .T. for true and .F. for false for each of the following:)
Explore 1 Video
Similar Questions
Knowledge Check
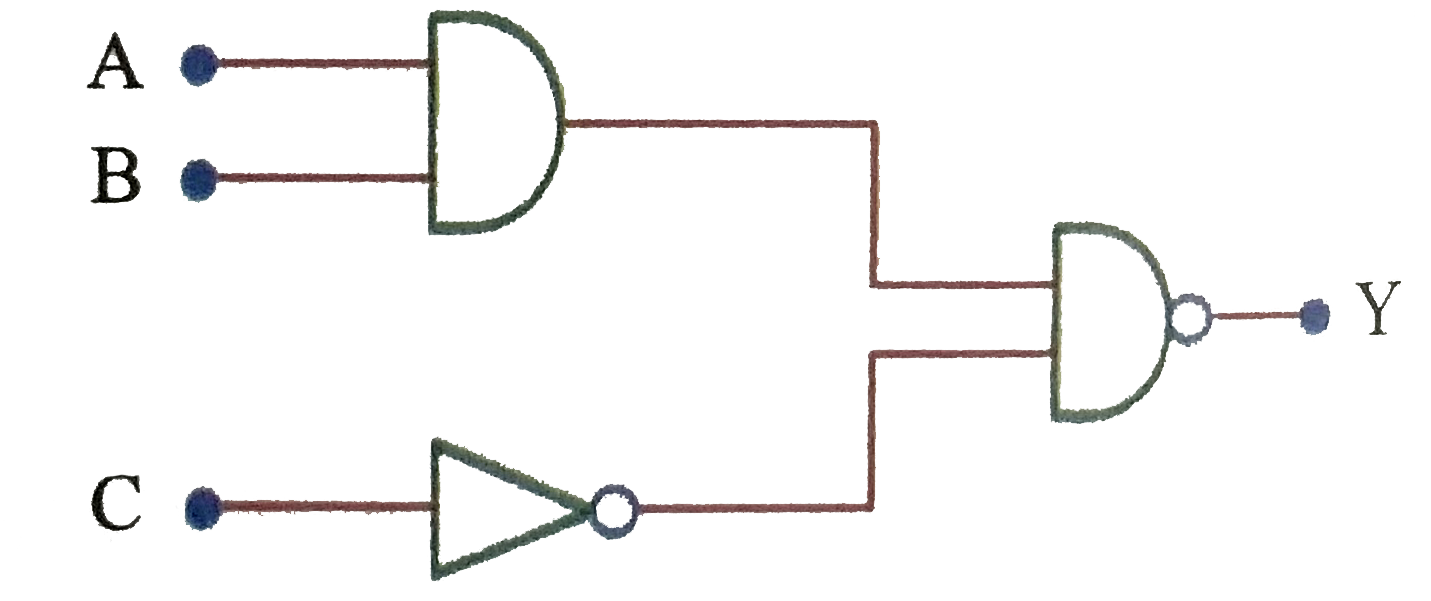
In the following circuit the output Y becomes zero for the inputs
 .AA=1,B=0,C=0BA=0,B=1,C=1CA=0,B=0,C=0DA=1,B=1,C=0
Given the followig truth table, where A,B are inputs and Y the output
 AA¯¯¯BB¯¯¯ABCABD¯¯¯AB
In the following circuit, the output Y for all possible inputs A and B is expressed by the truth table:
 A∣∣ ∣ ∣ ∣ ∣ ∣∣ABY000010100111∣∣ ∣ ∣ ∣ ∣ ∣∣B∣∣ ∣ ∣ ∣ ∣ ∣∣ABY001011101110∣∣ ∣ ∣ ∣ ∣ ∣∣C∣∣ ∣ ∣ ∣ ∣ ∣∣ABY001010100110∣∣ ∣ ∣ ∣ ∣ ∣∣D∣∣ ∣ ∣ ∣ ∣ ∣∣ABY000011101111∣∣ ∣ ∣ ∣ ∣ ∣∣
Study the table given below and draw a line graph for it.

Is the graph drawn, a linear graph ?
View SolutionConsider this input/output table.

(a) Graph the values from the table by taking Input along horizontal axis from 0 to 8 and Output along vertical axis from 0 to 24.
(b) Use your graph to predict the outputs for inputs of 3 and 8.
View SolutionUse the table given below to draw the graph.Use the graph drawn to find the value of a and b.
View SolutionTo get output 1 for the following circuit the correct choice for the input is
f
View SolutionTo get output 1 for the following circuit, the correct choice for the input is:

View Solution

