The table given below depicts the annual gross profit of a company for a period of 5 years . Study the table and draw a line graph for the same .

Step by step video & image solution for The table given below depicts the annual gross profit of a company for a period of 5 years . Study the table and draw a line graph for the same . by Maths experts to help you in doubts & scoring excellent marks in Class 8 exams.
Updated on:21/07/2023Topper's Solved these Questions
- LINE GRAPHS AND LINEAR GRAPHSBOOK - RS AGGARWALCHAPTER - LINE GRAPHS AND LINEAR GRAPHSEXERCISE - Exercise 23
25 Videos
- INTRODUCTION TO COORDINATE GEOMETRYBOOK - RS AGGARWALCHAPTER - INTRODUCTION TO COORDINATE GEOMETRYEXERCISE - EXERCISE B (OBJECTIVE QUESTIONS)
7 Videos
- LINEAR EQUATIONSBOOK - RS AGGARWALCHAPTER - LINEAR EQUATIONSEXERCISE - TEST PAPER-8 (D) (Write .T. for true and .F. for false for each of the following:)
1 Videos
Similar Questions
Knowledge Check
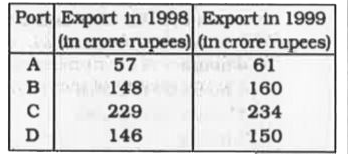
Study the following table and answer the questions based on it.The percentage increase in the export of the commodity from the year 1998 to 1999 was the highest from which port?
AABBCCDDThe table given below depicts the export of a commodity through four ports in the years 1998 and 1999.
Study the table and answer the questions.

The percentage increase in the export of the commodity from the year 1998 to 1999 was the lowest from which port ?AABBCCDDThe table given below depicts the export of a commodity through four ports in the years 1998 and 1999.
Study the table and answer the questions.

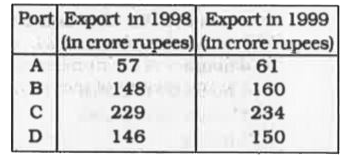
What was the average increase in the export of the commodity from the ports in the year 1999 as compared to the year 1998 ?ARs 82500000BRs 80000000CRs 75000000DRs 62500000
The table given below depicts the export of a commodity through four ports in the years 1998 and 1999.
Study the table and answer the questions.

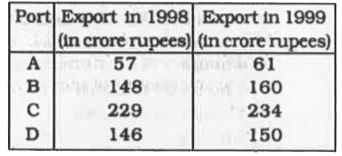
What was the change in the aggregate export of the commodity in the year 1999 as compared to the year 1998 ?
View SolutionThe table given below depicts the export of a commodity through four ports in the years 1998 and 1999 .
Study the table and answer the questions

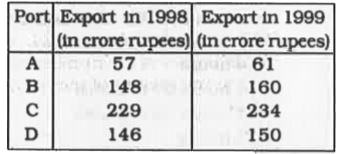
The percentage increase in the export of the commodity from the year 1998 to 1999 was the highest from which port ?
View SolutionThe table given below depicts the export of a commodity through four ports in the years 1998 and 1999 .
Study the table and answer the questions

The percentage increase in the export of the commodity from the year 1998 to 1999 was the lowest from which port ?
View SolutionThe table given below depicts the export of a commodity through four ports in the years 1998 and 1999 .
Study the table and answer the questions

What was the average increase in the export of the commodity from the ports in the year 1999 as compared to the year 1998 ?
View SolutionThe table given below depicts the export of a commodity through four ports in the years 1998 and 1999 .
Study the table and answer the questions

What was the change in the aggregate export of the commodity in the year 1999 as compared to the year 1998 ?
View Solution


