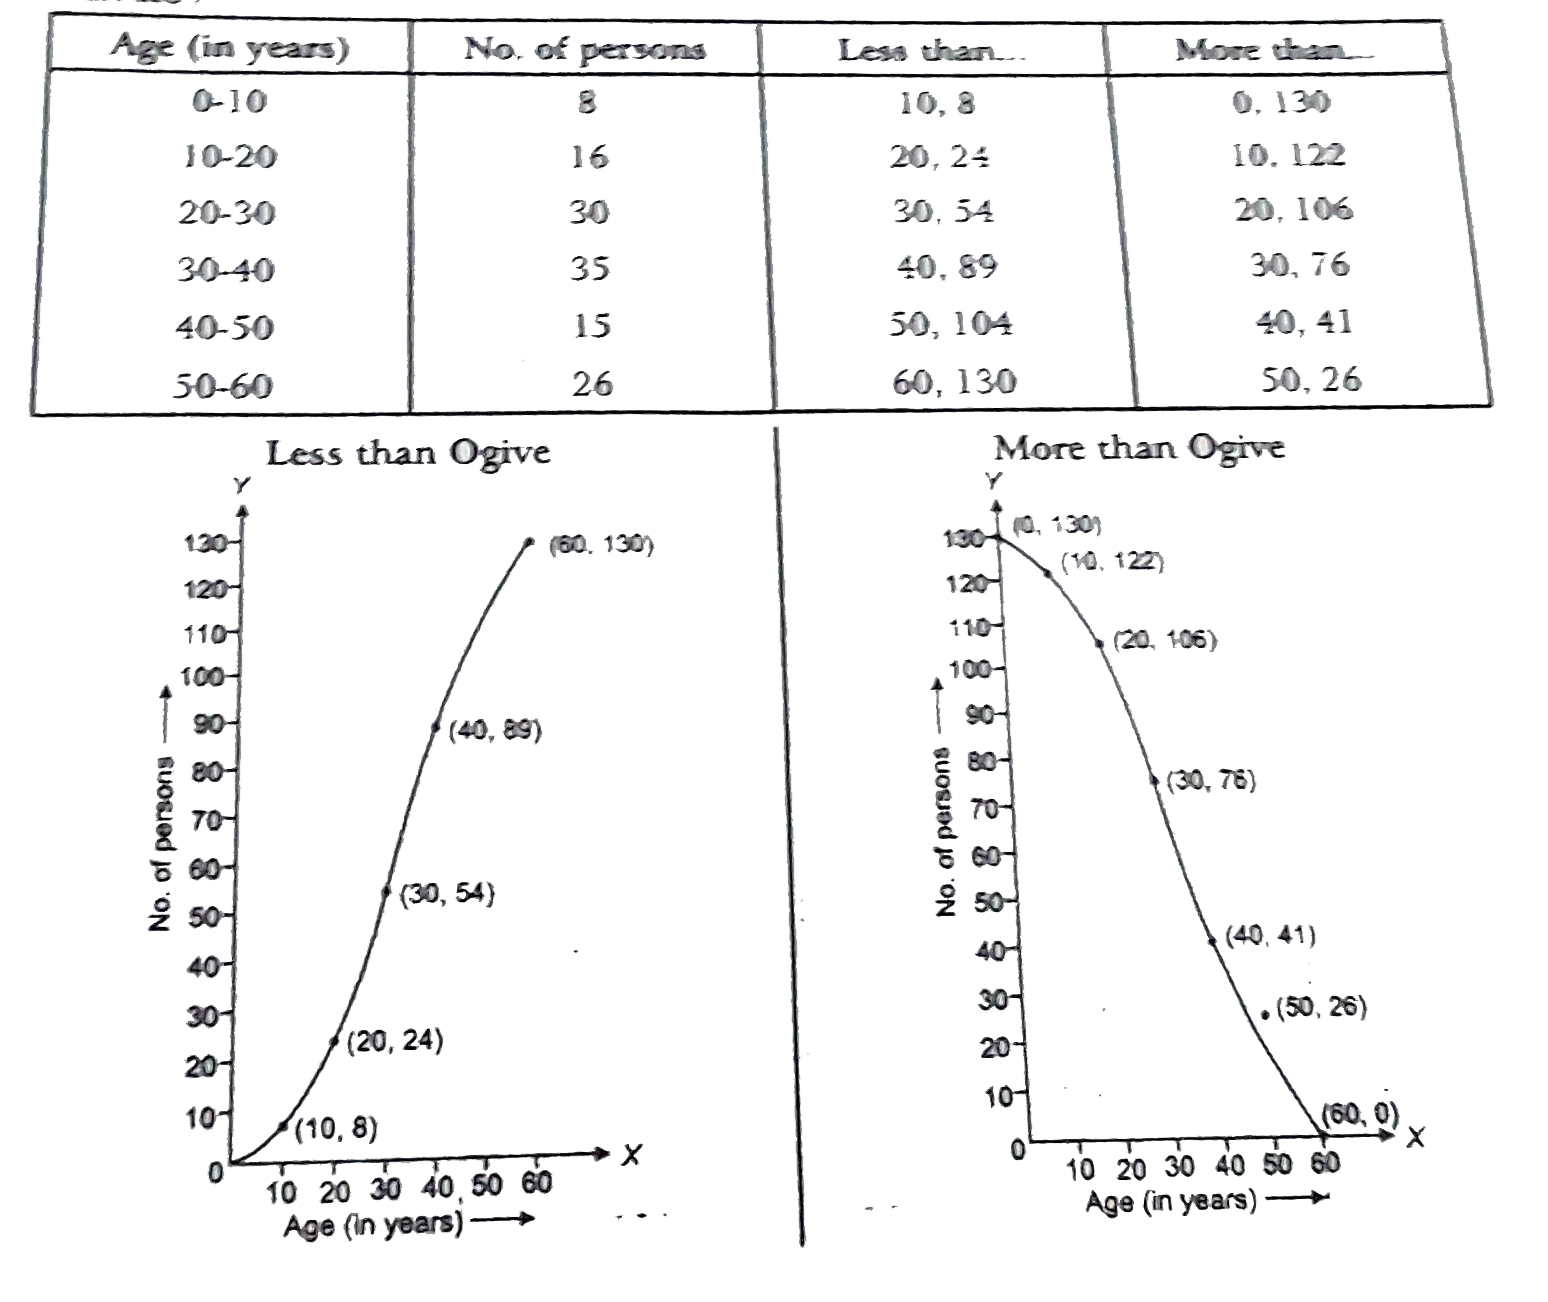
Construct a less than ogive and a more than ogive from the following data :

Text Solution
Cumulative frequency distribution table according to ages ( in years) less than and more than are :

|
Topper's Solved these Questions
- STATISTICS BOOK - NAGEEN PRAKASHANCHAPTER - STATISTICS EXERCISE - Problems From NCERT/exemplar
4 Videos
- STATISTICS BOOK - NAGEEN PRAKASHANCHAPTER - STATISTICS EXERCISE - Exercise 14 A
17 Videos
- SOME APPLICATIONS OF TRIGONOMETRYBOOK - NAGEEN PRAKASHANCHAPTER - SOME APPLICATIONS OF TRIGONOMETRYEXERCISE - Long Answer Questions
5 Videos
- TRIANGLES BOOK - NAGEEN PRAKASHANCHAPTER - TRIANGLES EXERCISE - Revision Exercise Long Questions
4 Videos
Similar Questions
Knowledge Check
for given statistical data, the graphs for less than ogive and more than ogive are drawn. If the point at which the two curves intersect as P, then abscissa of point P gives the value of which one of the folloiwng measures of central tendency?
AMedianBMeanCModeDGeometric MeanDraw 'less than' and 'more than' ogive curves from the following data :
 AMediumBModeCArithmetic meanDnone of these
Simplify :- 45% of 1770 ÷ 3 = 657 - ?
Aa. 391.5Bb. 401.5Cc. 372.5Dd. 297.5
Draw 'less than' as well as 'more than' ogives for the following data :

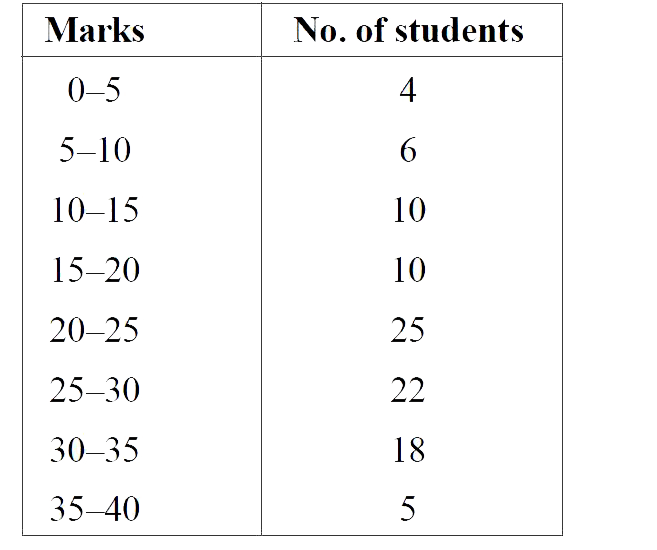
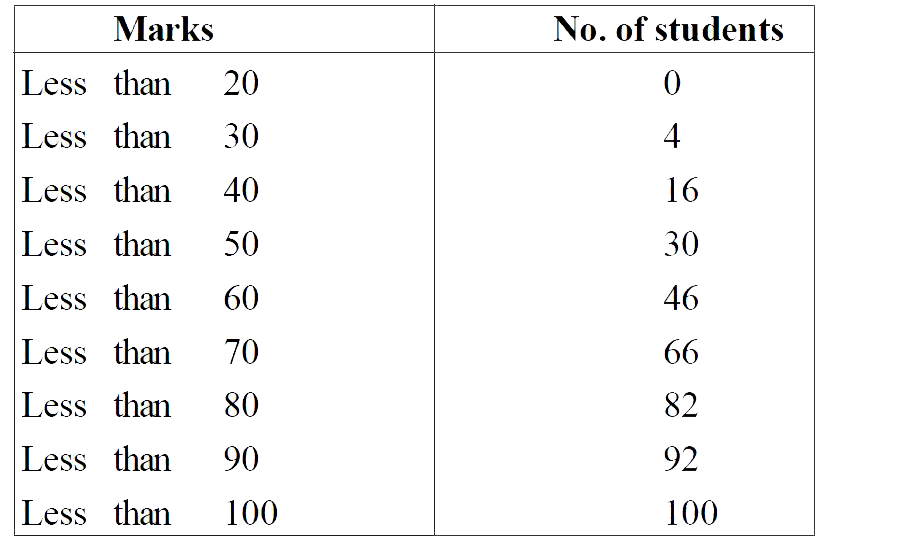
View SolutionThe distribution given below show the marks of 100 students of a class.

Draw a less than type and a more than type ogive from the given data. Hence obtain the median marks from the graph.
View SolutionDuring the medical checkup of 35 students of a class their weight were recorded as follows :

Draw a less than type a more than type ogive from the given data. Hene obtain the median weigth from the graph.
View SolutionThe point where ' less than ogive' and more than ogive ' intersect each other determines median .
View SolutionThe 'less than' ogive curve and the 'more than' ogive curve intersect at
View Solution

