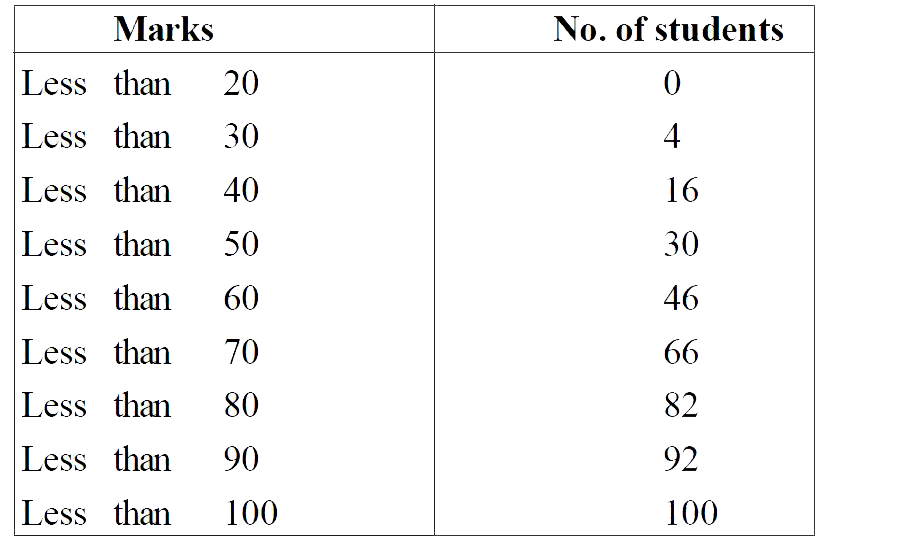
Draw 'less than' and 'more than' ogive curves from the following data :

Step by step video, text & image solution for Draw 'less than' and 'more than' ogive curves from the following data : by Economics experts to help you in doubts & scoring excellent marks in Class 11 exams.
Updated on:21/07/2023Topper's Solved these Questions
- FREQUENCY DIAGRAMS - HISTOGRAM, POLYGON AND OGIVEBOOK - TARUN JAIN & VK OHRICHAPTER - FREQUENCY DIAGRAMS - HISTOGRAM, POLYGON AND OGIVEEXERCISE - EXERCISE NCERT
7 Videos
- FREQUENCY DIAGRAMS - HISTOGRAM, POLYGON AND OGIVEBOOK - TARUN JAIN & VK OHRICHAPTER - FREQUENCY DIAGRAMS - HISTOGRAM, POLYGON AND OGIVEEXERCISE - EXERCISE CONCEPT BASED OBJECTIVE
5 Videos
- DIAGRAMMATIC PRESENTATION OF DATA BAR DIAGRAMS AND PIE DIAGRAMSBOOK - TARUN JAIN & VK OHRICHAPTER - DIAGRAMMATIC PRESENTATION OF DATA BAR DIAGRAMS AND PIE DIAGRAMSEXERCISE - NCERT Question (With Hints to Answers)
3 Videos
- INDEX NUMBERSBOOK - TARUN JAIN & VK OHRICHAPTER - INDEX NUMBERSEXERCISE - NCERT Questions (With Hints to Answers)
12 Videos
Similar Questions
Knowledge Check
for given statistical data, the graphs for less than ogive and more than ogive are drawn. If the point at which the two curves intersect as P, then abscissa of point P gives the value of which one of the folloiwng measures of central tendency?
AMedianBMeanCModeDGeometric MeanSimplify :- 45% of 1770 ÷ 3 = 657 - ?
Aa. 391.5Bb. 401.5Cc. 372.5Dd. 297.5
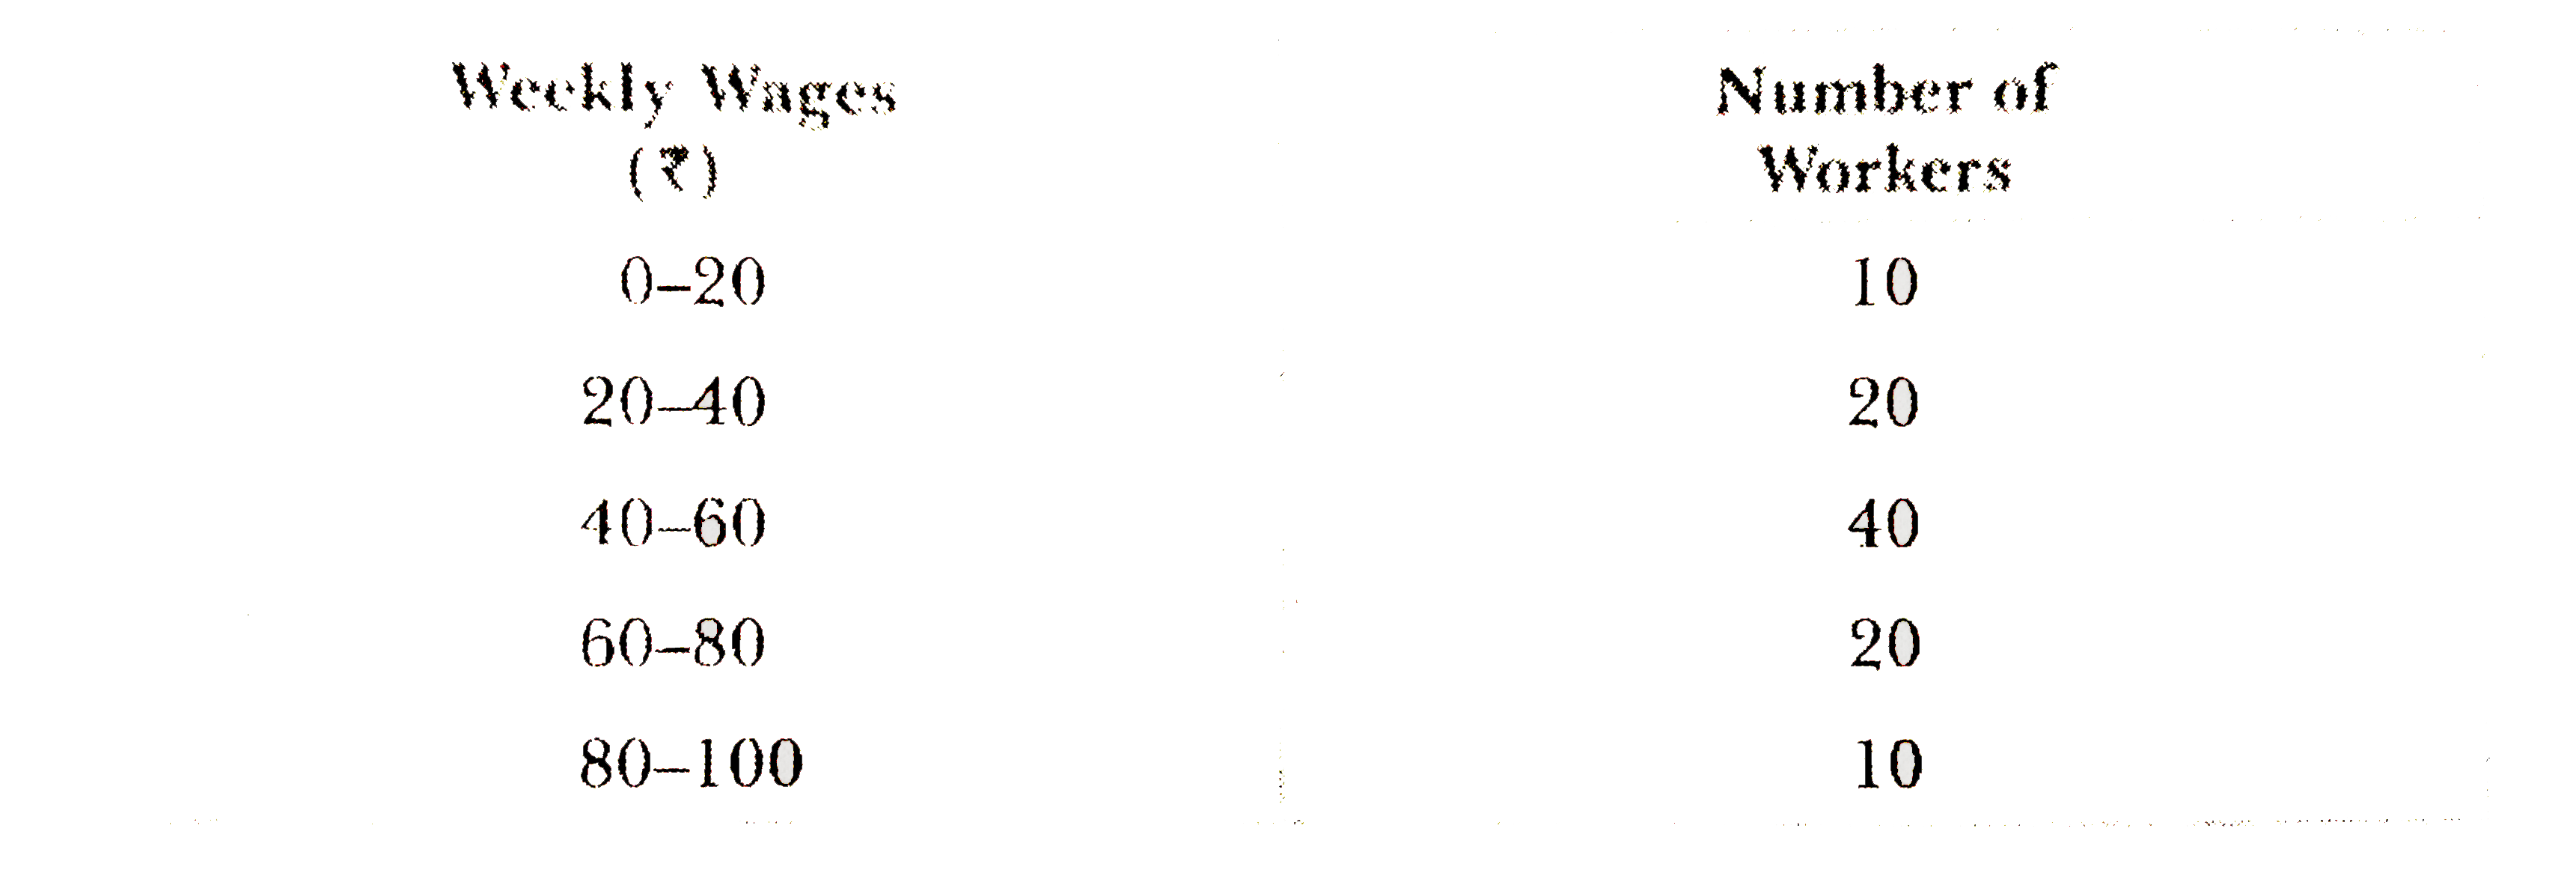
Draw a 'less than' ogive of the following data

View SolutionThe distribution given below show the marks of 100 students of a class.

Draw a less than type and a more than type ogive from the given data. Hence obtain the median marks from the graph.
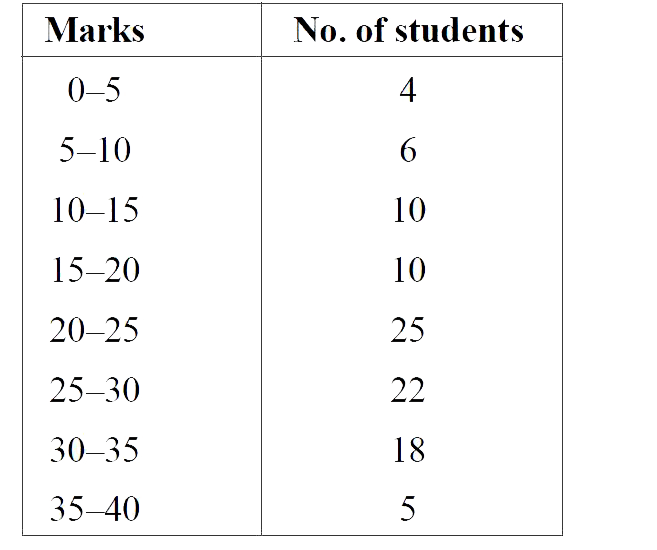
View SolutionDraw the 'less than' and 'more than' ogive on the same graph paper from the data given below :

View SolutionDraw the 'less than' and 'more than' ogive on the same graph paper from the data given below :

View SolutionDuring the medical checkup of 35 students of a class their weight were recorded as follows :

Draw a less than type a more than type ogive from the given data. Hene obtain the median weigth from the graph.
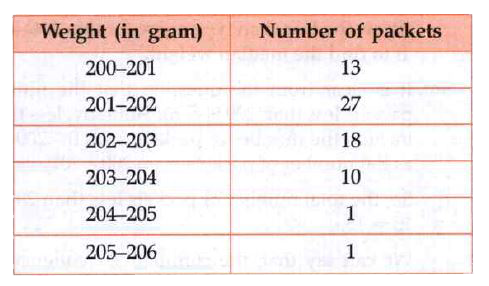
View SolutionThe weighs of tea in 70 packets are shown in the following table:
Draw the less than type and more than type ogives for the data and use them to find the median weight.

View Solution


