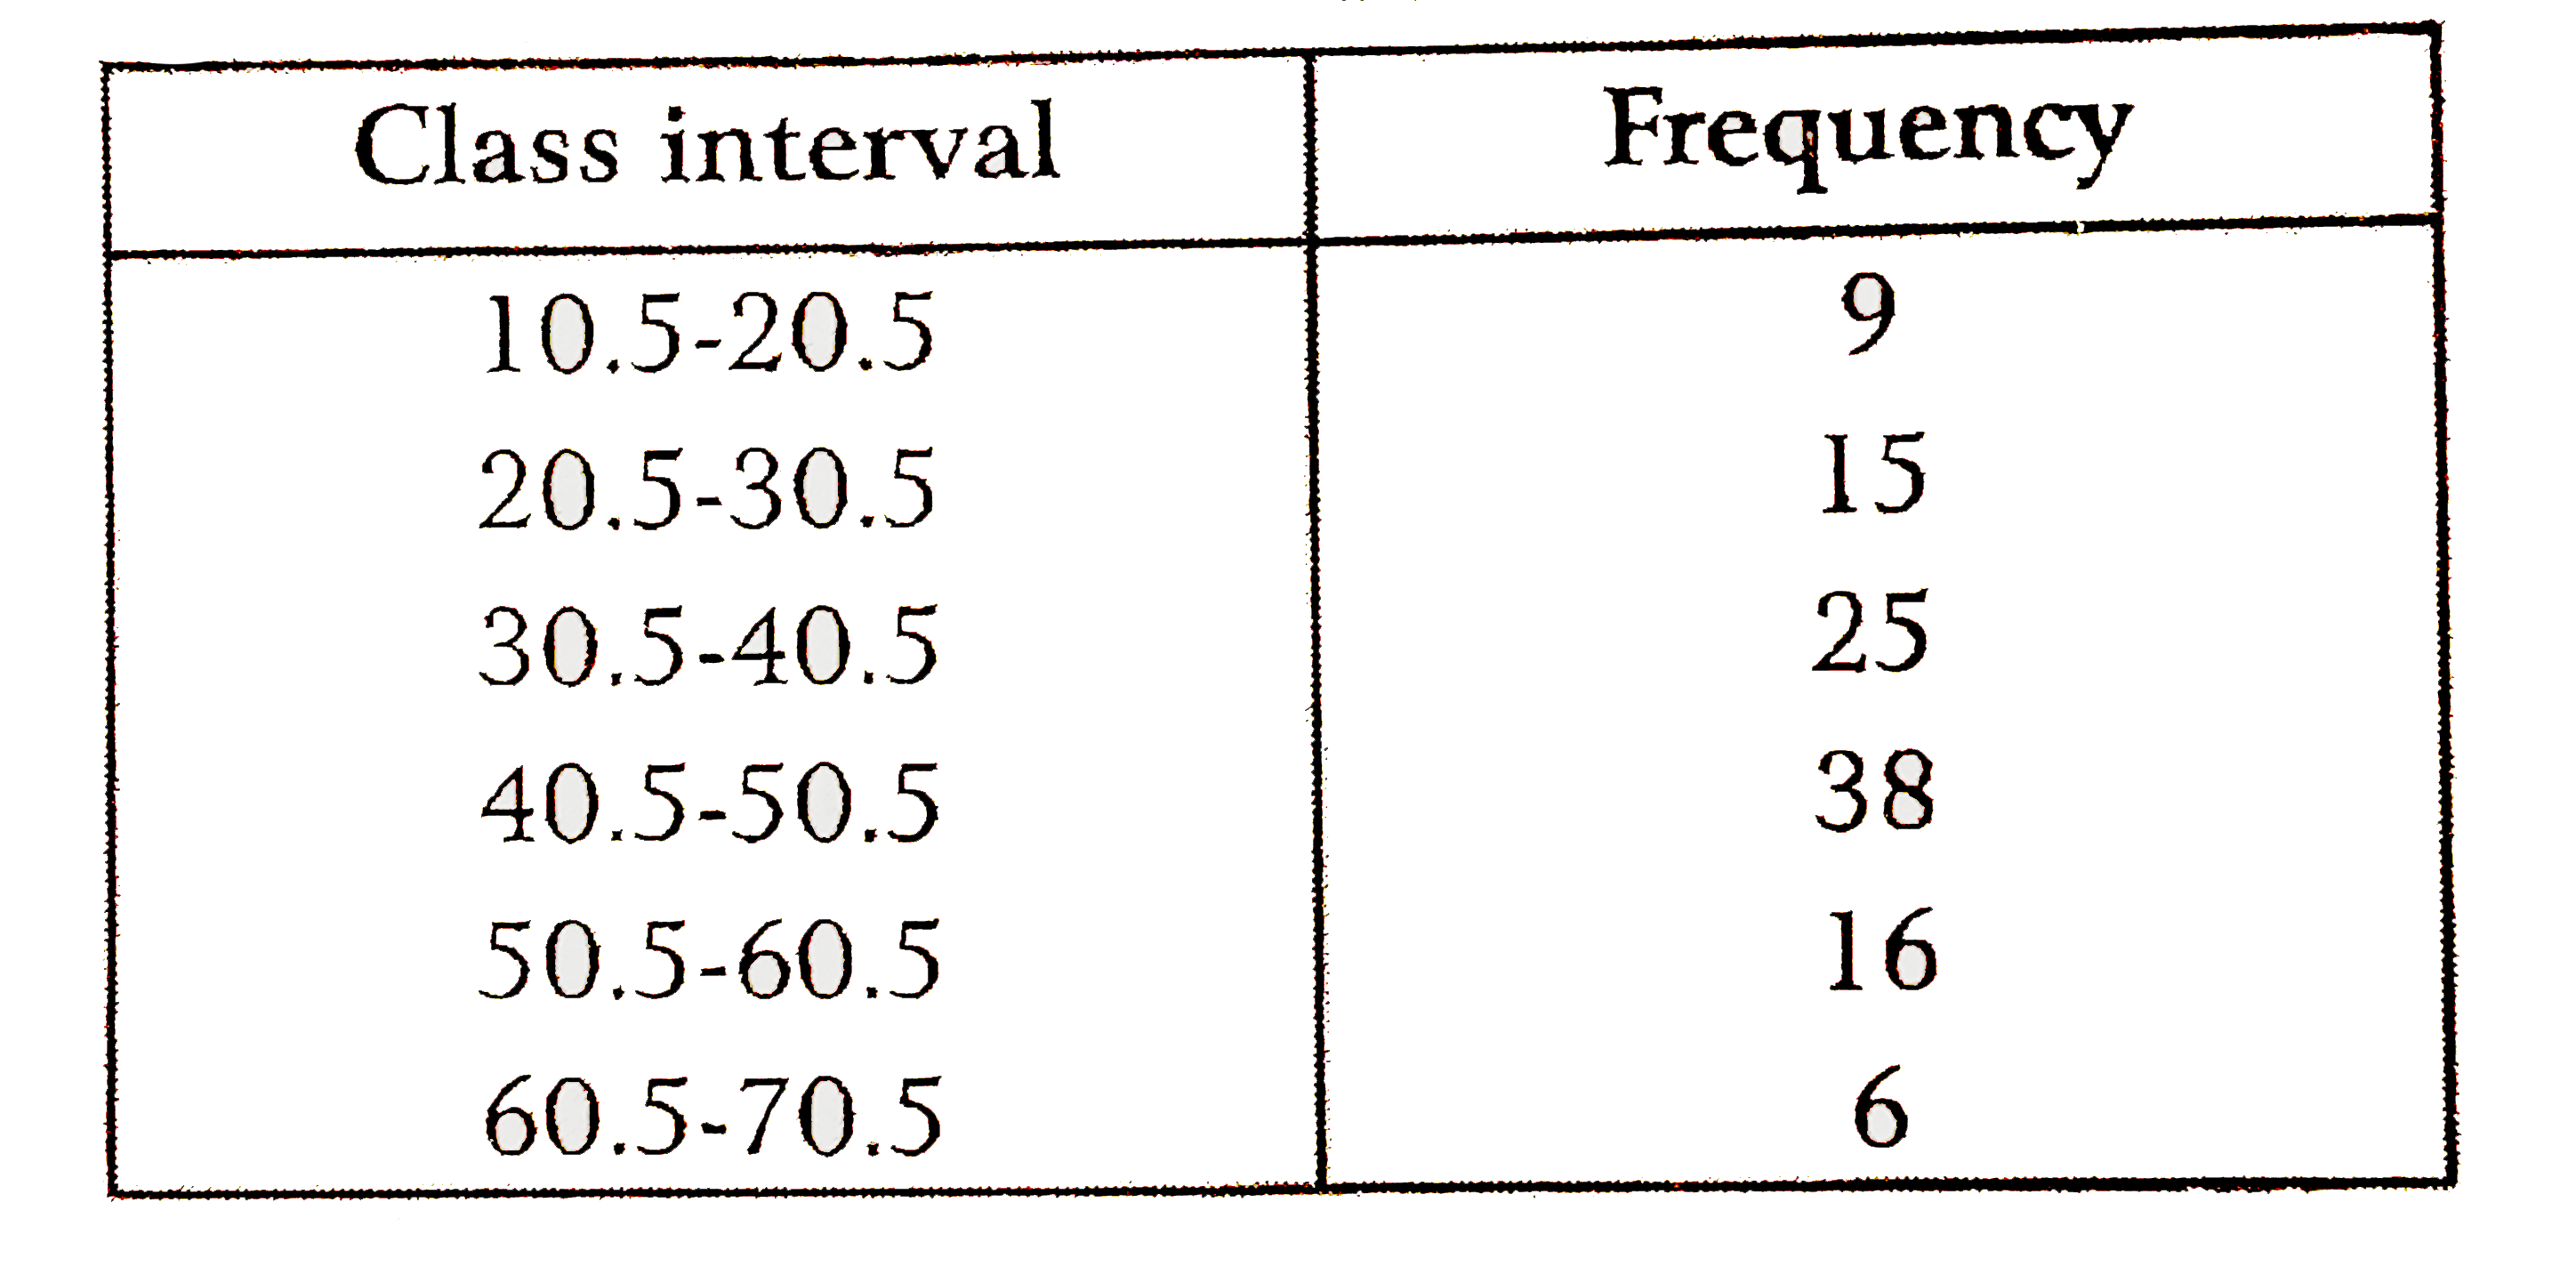
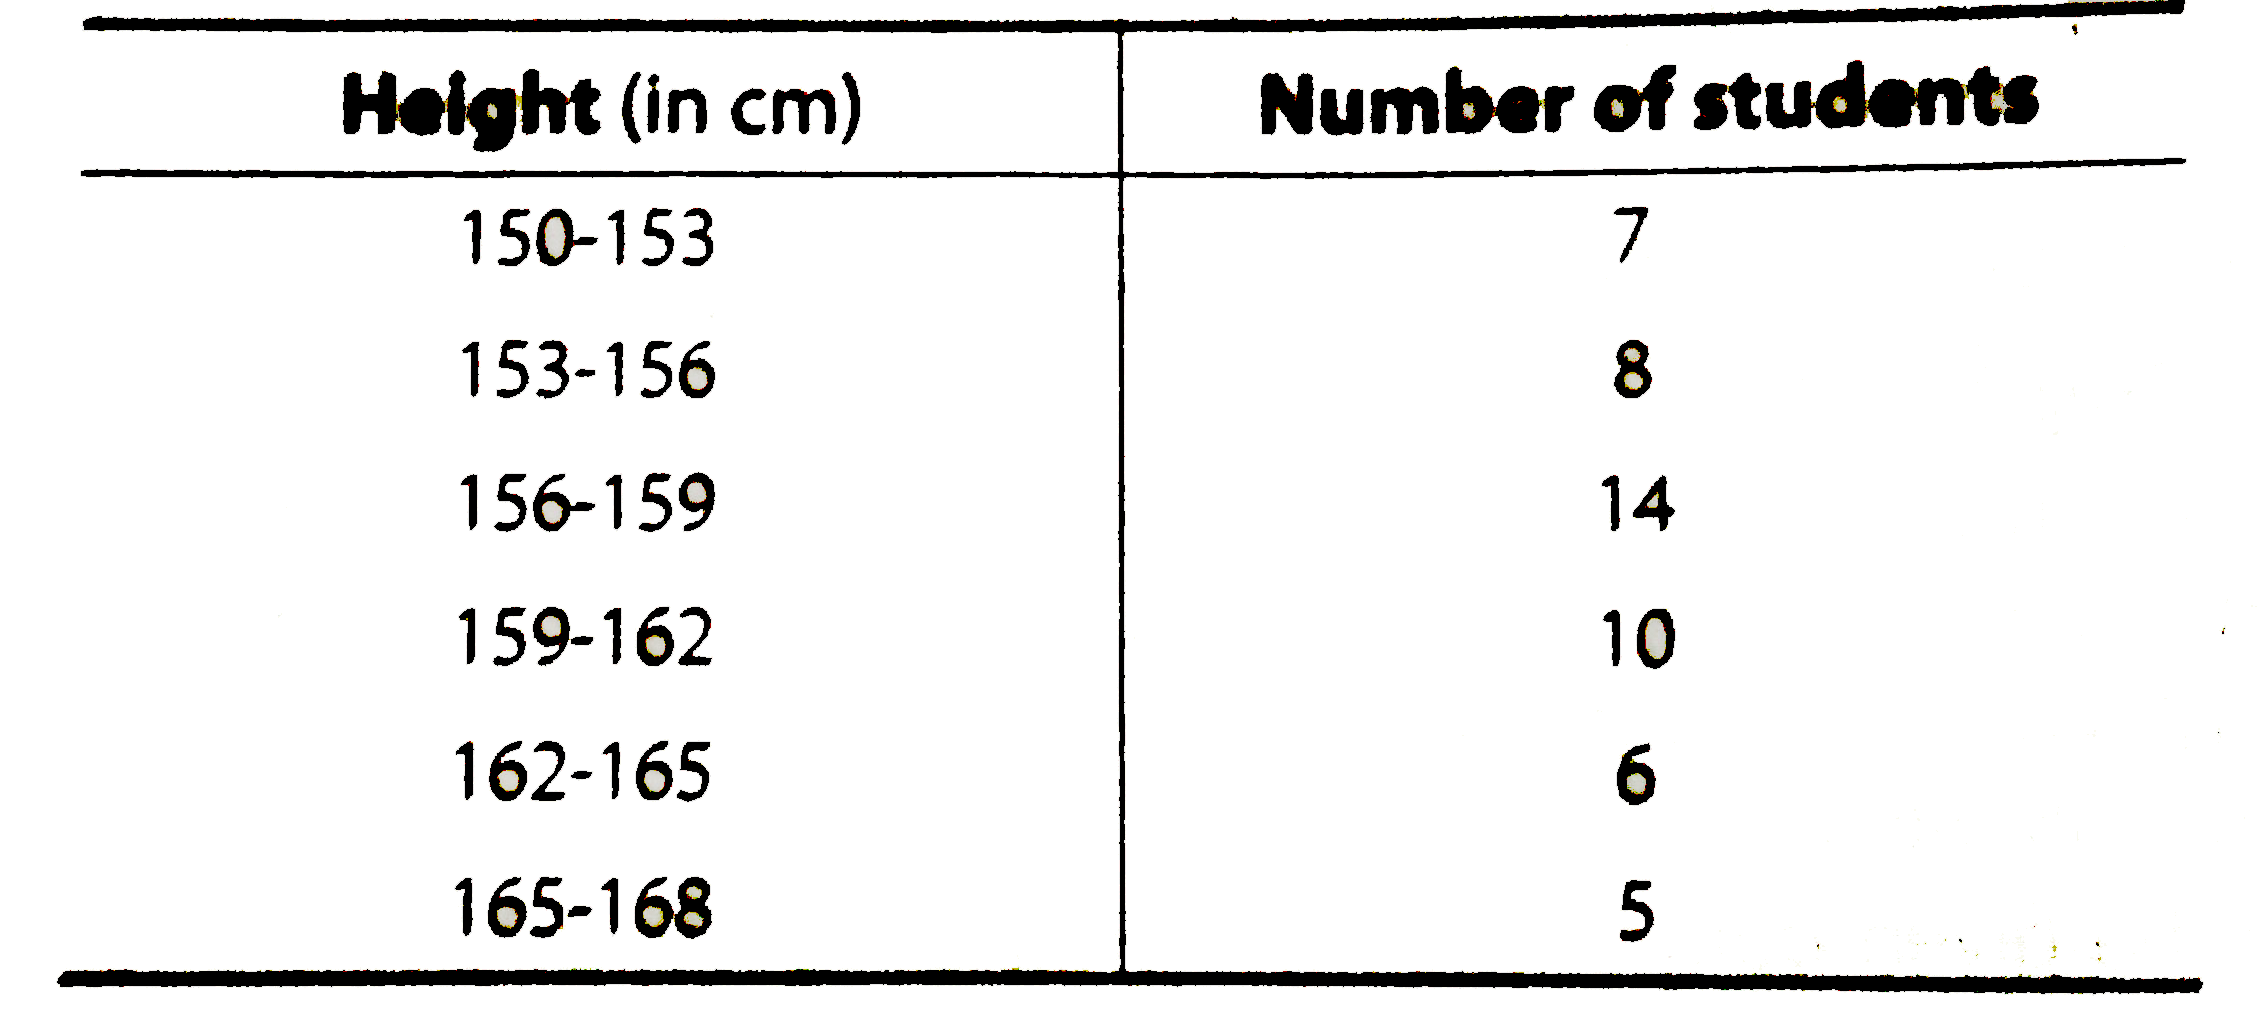
Draw a histogram from the following data:

Video Solution
Text Solution
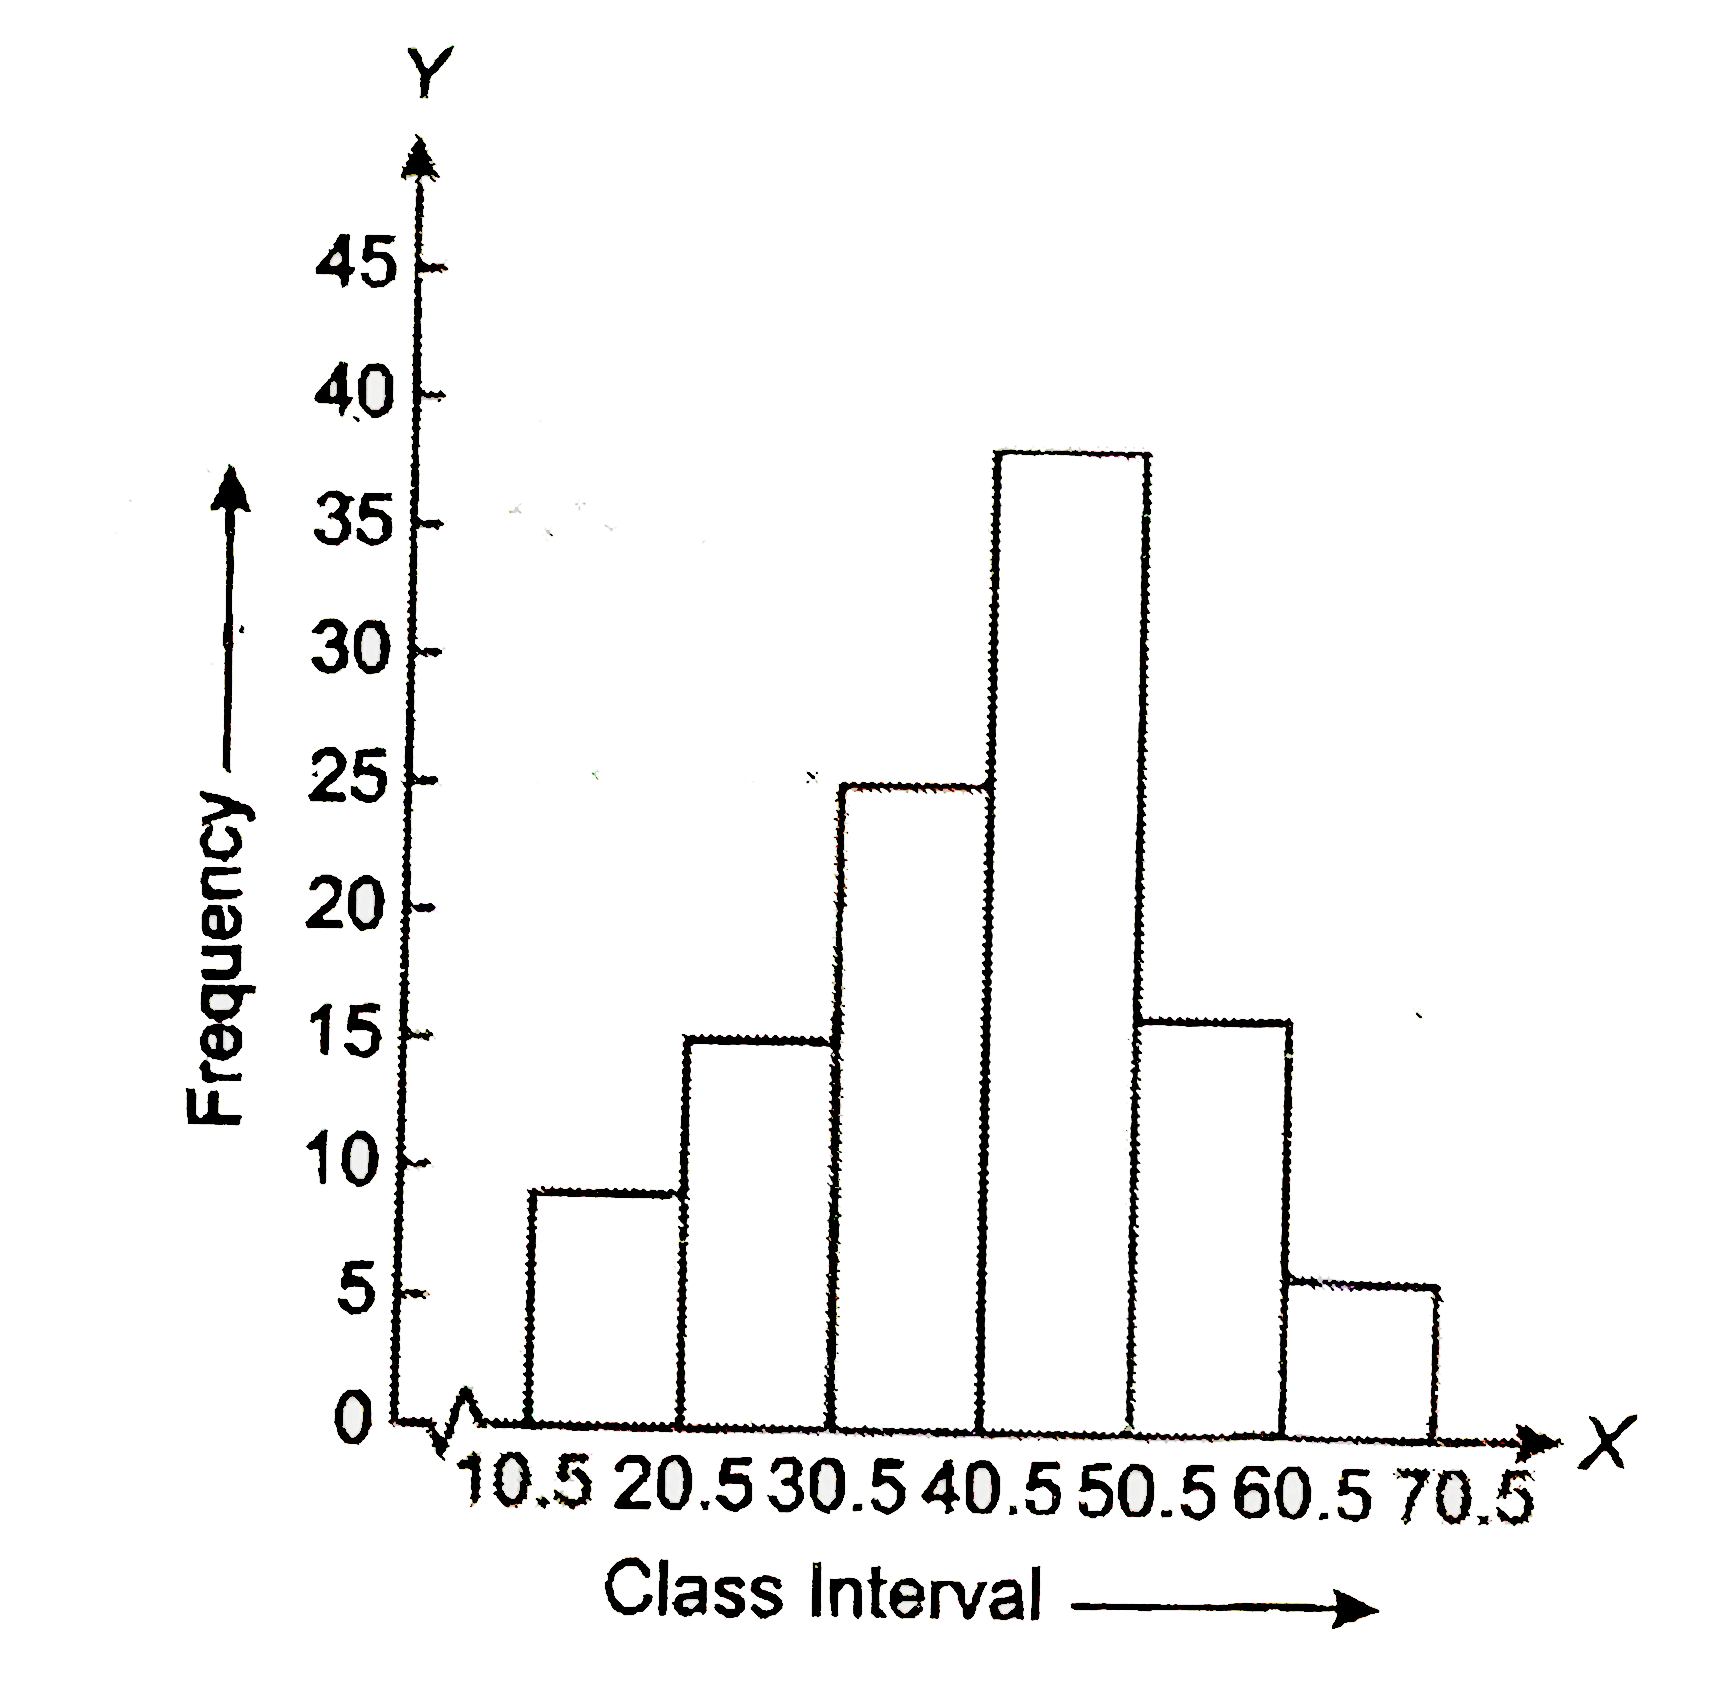
Given table is in the inclusive form. First we will convert it into the exclusive form. So the frequency table in the exclusive form is as follows:

Scale : Let 1 cm = 10 units on X-axis
1 cm = 5 units on Y-axis

|
Updated on:21/07/2023
Topper's Solved these Questions
- BOOK - NAGEEN PRAKASHAN ENGLISHCHAPTER - STATISTICSEXERCISE - Problems From NCERT/exemplar22videos
STATISTICS
- BOOK - NAGEEN PRAKASHAN ENGLISHCHAPTER - STATISTICSEXERCISE - Exercise 14a10videos
STATISTICS
- BOOK - NAGEEN PRAKASHAN ENGLISHCHAPTER - QUADRILATERALSEXERCISE - Revision Exercise (long Answer Questions)5videos
QUADRILATERALS
- BOOK - NAGEEN PRAKASHAN ENGLISHCHAPTER - SURFACE AREA AND VOLUMEEXERCISE - Revision Exercise (long Answer Questions)10videos
SURFACE AREA AND VOLUME
Similar Questions
Draw a histogram for the following data:
 View Solution
Draw a histogram for the following data:
 View Solution
Draw a histogram for the following data:
 View Solution
Draw a histogram for the following data:
 View Solution
Draw a histogram for the following data :
 View Solution
Draw a histogram of the following data: Class interval: 10-15, 15-20, 20-25, 25-30, 30-35, 35-40, Frequency: 30, 98, 80, 58, 29, 50,
View SolutionDraw a bar graph from the following data:
 View Solution
Draw a histogram of the following distribution.
 View Solution
Draw a histogram for the following
Class interval 11−2021−3031−4041−5051−60 Frequency 5 8 13 10 6View SolutionDraw a histogram for the following frequency distribution and find the mode from the graph :
 View Solution

