Draw a line graph to represent the runs made by different batsmen in a match whose details are given in the following table:

Step by step video & image solution for Draw a line graph to represent the runs made by different batsmen in a match whose details are given in the following table: by Maths experts to help you in doubts & scoring excellent marks in Class 7 exams.
Updated on:21/07/2023Similar Questions
Draw a bar graph using the data given in the following table.

View SolutionDraw the line graph for the following table:

View Solution(A graph on “performance”)The given graph (Fig 15.7) represents the total runs scored by two batsmen A and B, during each of the ten different matches in the year 2007. Study the graph and answer the following questions.(i) What information is given on the two axes?(ii) Which line shows the runs scored by batsman A?(iii) Were the run scored by them same in any match in 2007? If so, in which match?(iv) Among the two batsmen, who is steadier? How do you judge it?
View SolutionThe given bar graph presents the runs scored and strike rate of a batsman in five matches , Strike rate is the number of runs scored per 100 balls faced. The strike rate is taken on record only when the batsmen scores at least 30 runs in a match
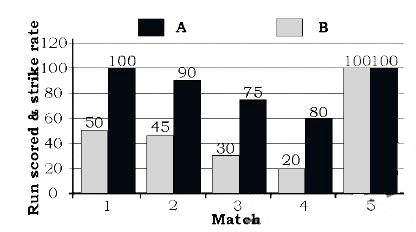
What is the average strike rate of the batsman
View SolutionThe bar graph given below represents the circulation of newspapers in different languages in a town. Study the bar graph and answer the following questions:
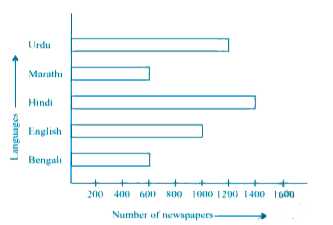
What is the circulation of English newspaper?
View SolutionThe graph given below represents the organisms reponse to temperature as an environmental conditions :
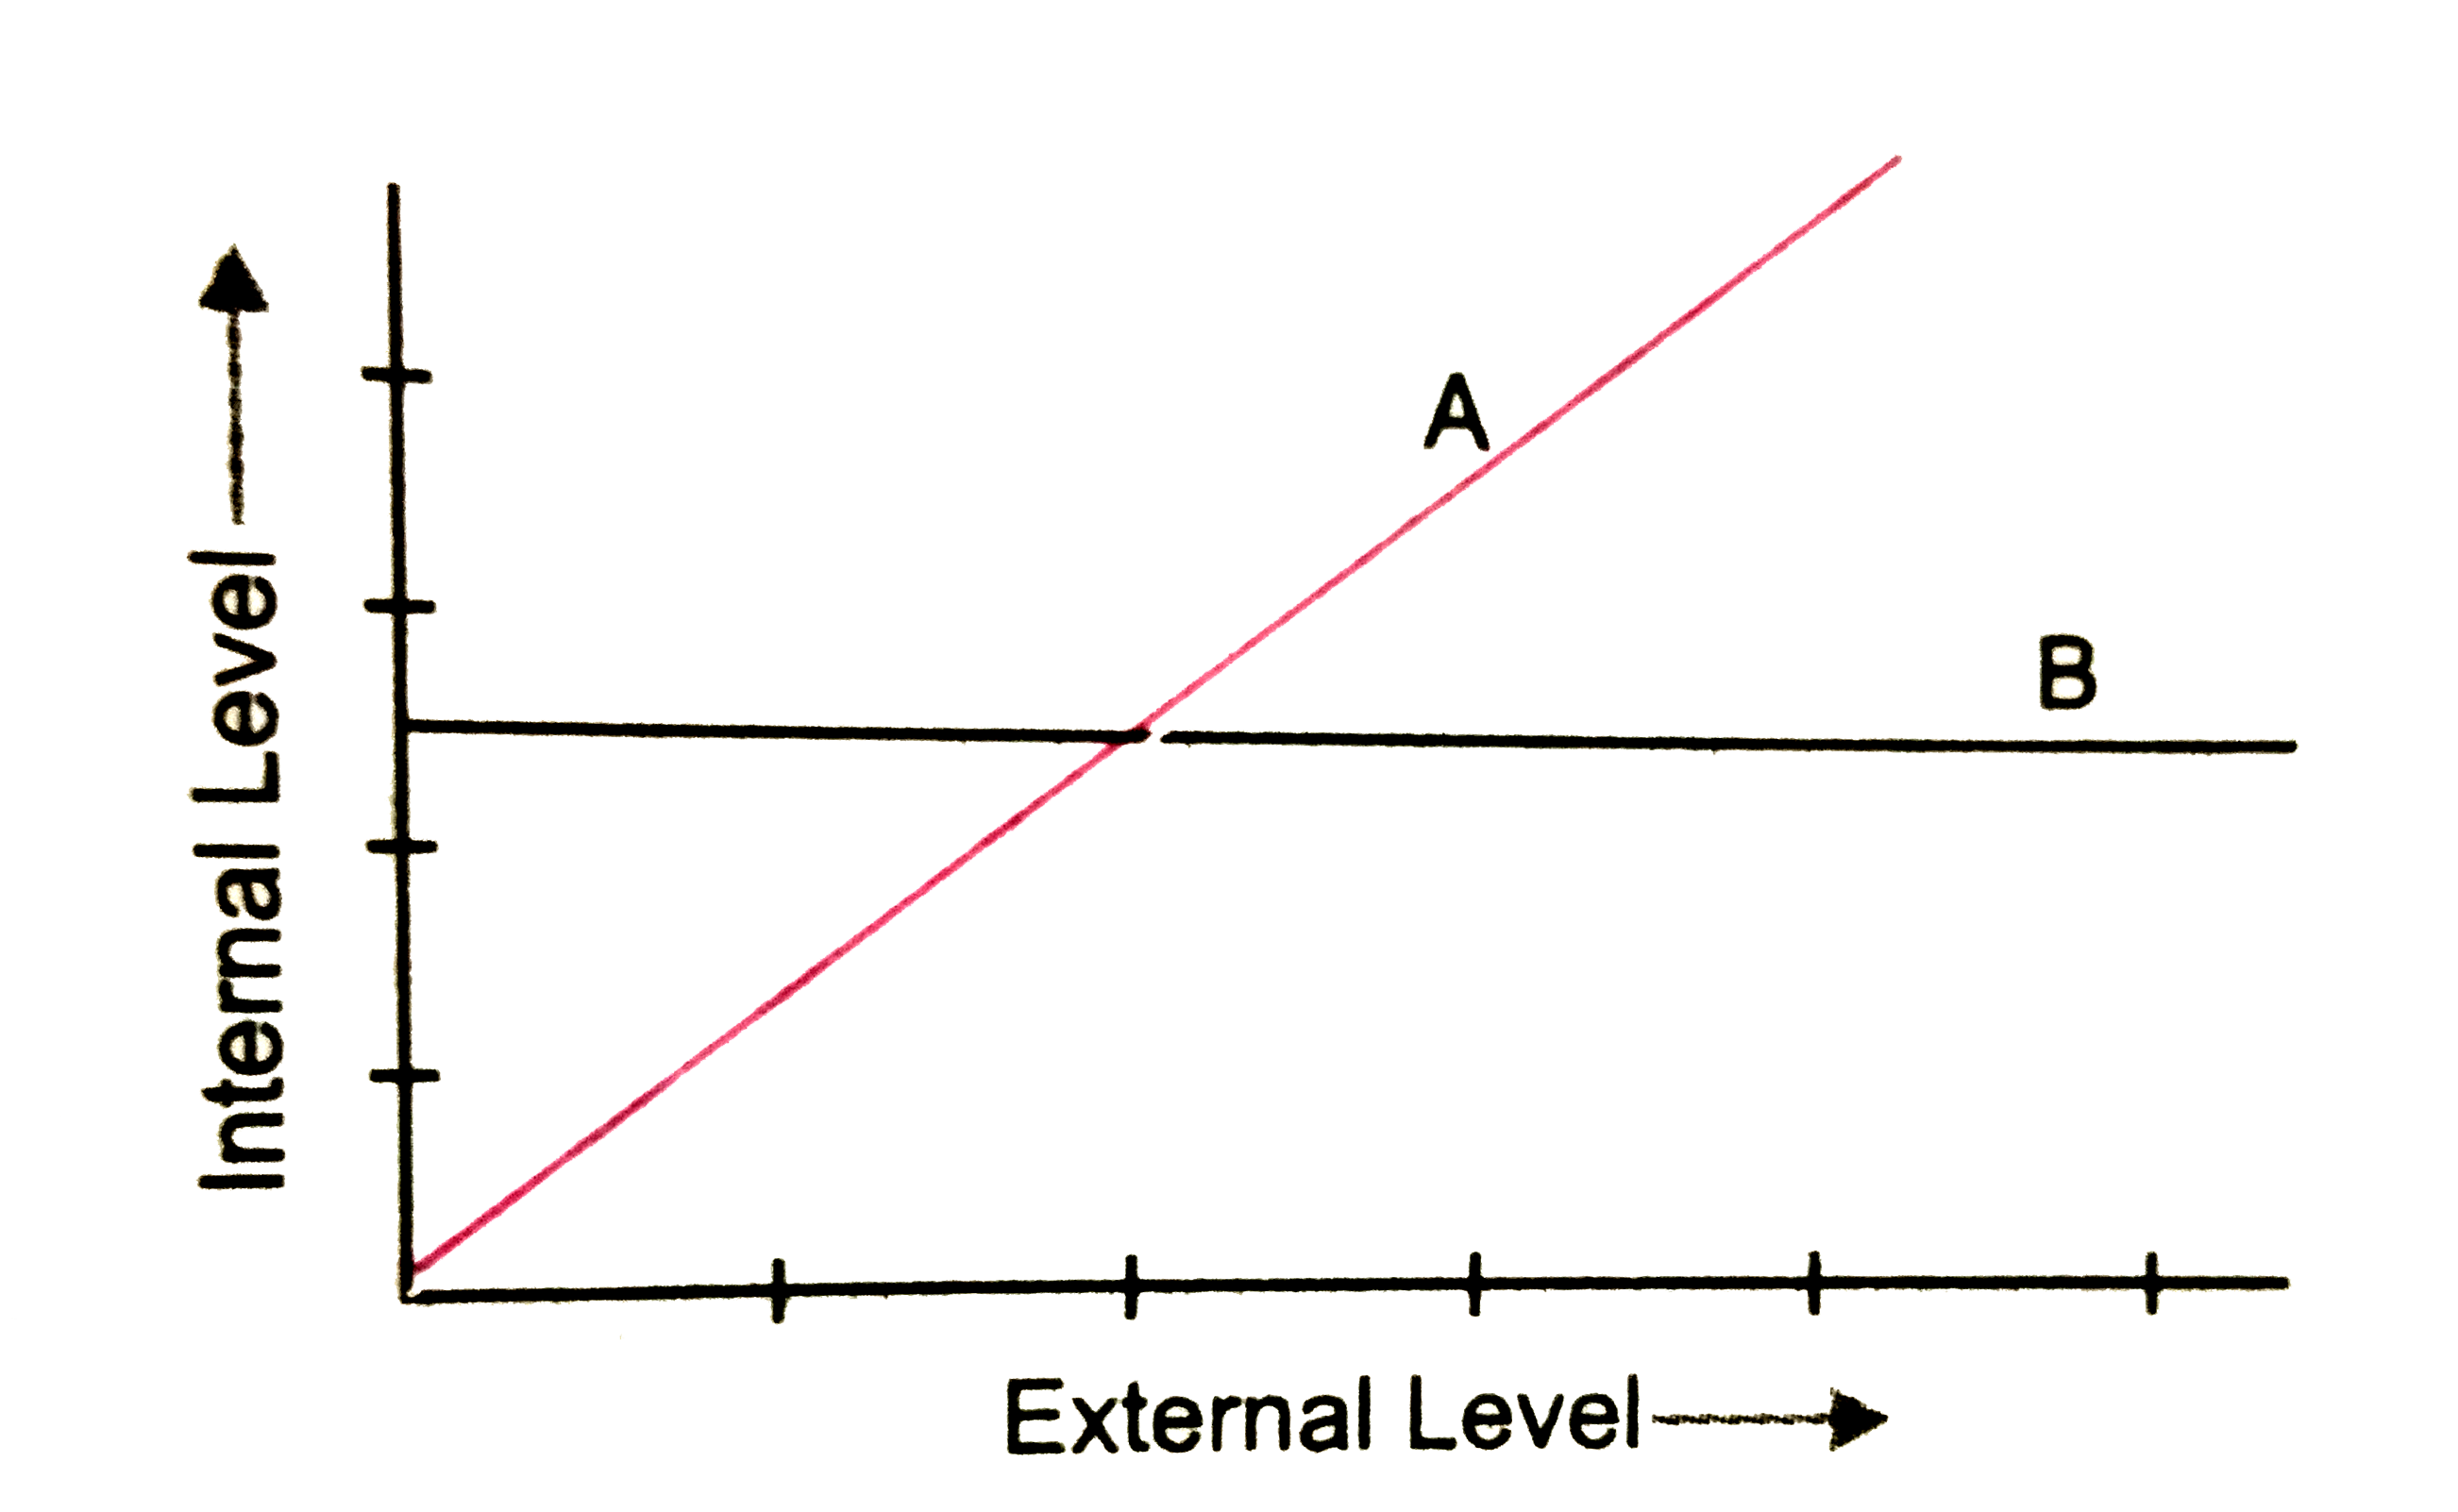
(i) Which one of the two lines represents conformers and why ?
(ii) What does the other line in the graph represent and why ?
(b) Mention the different adaptations the parasites have evolved with , to be able to successfuly complete their life cycle in their hosts.
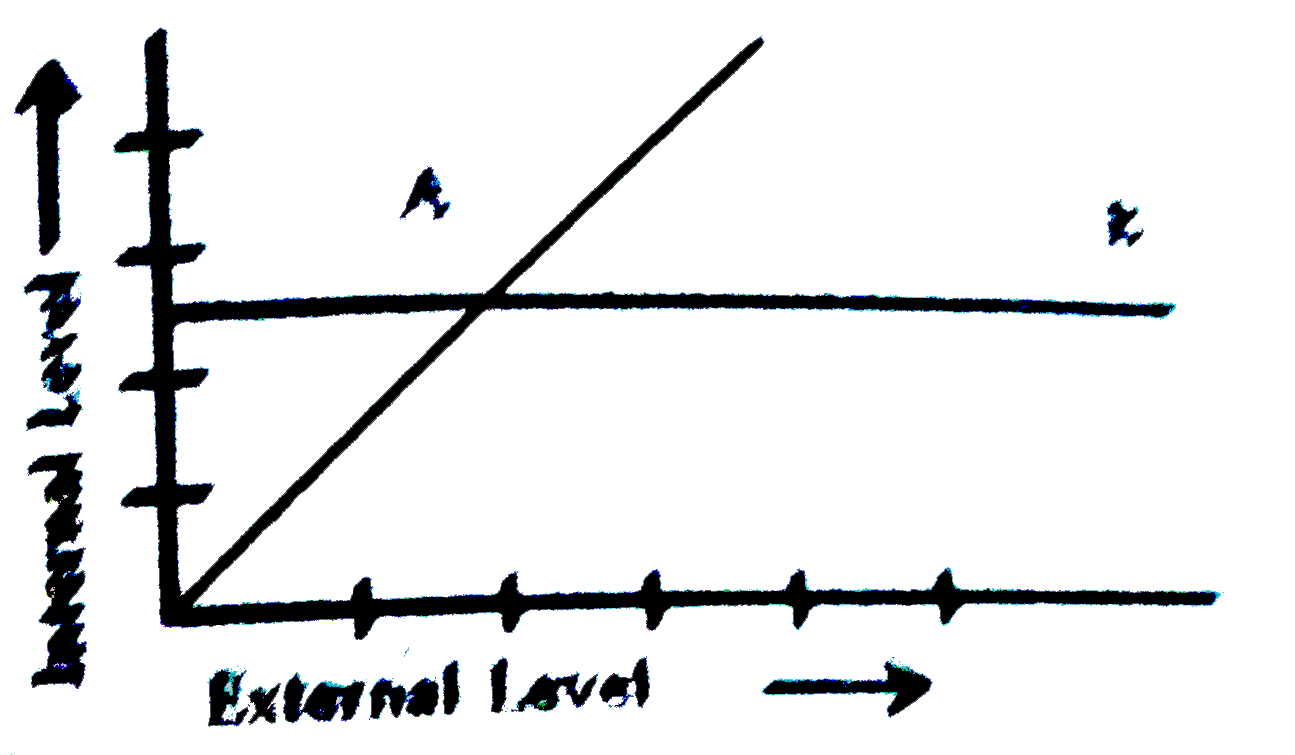
View Solution(a) The graph given below represents the organisms response to temperature as an environmental condition.
(i) Which one of the two lines represents conformers and why ?
(ii) What does the other line in the graph represent and why ?
(b) Mention the different adaptations the parasites have evolved with, to be able to successfully complete their life cycles in their hosts.
View SolutionThe following bar graph represents the data for different sizes of shoes worn by the students in a school. Read the graph and answer the following questions.
(a) Find the number of students whose shoe sizes have been collected.
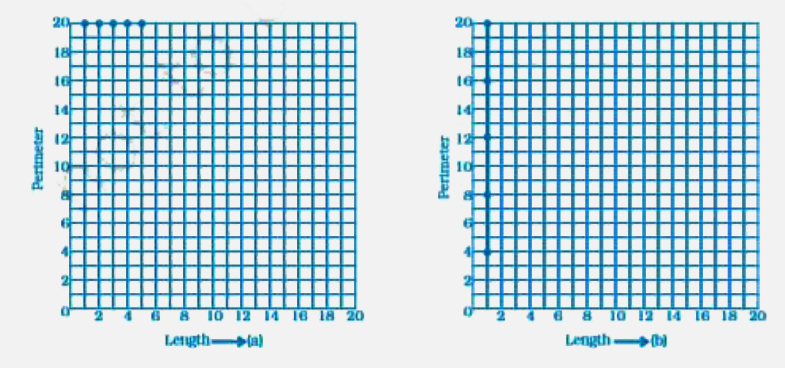
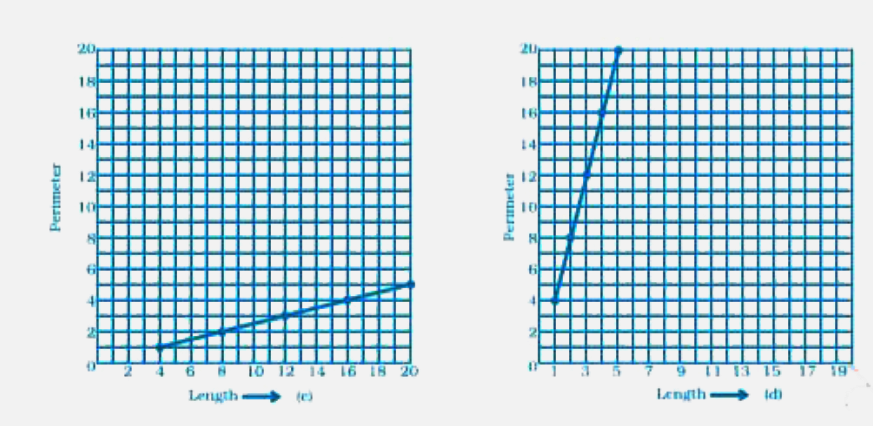
View SolutionWhich graphs of the following represent the table below?
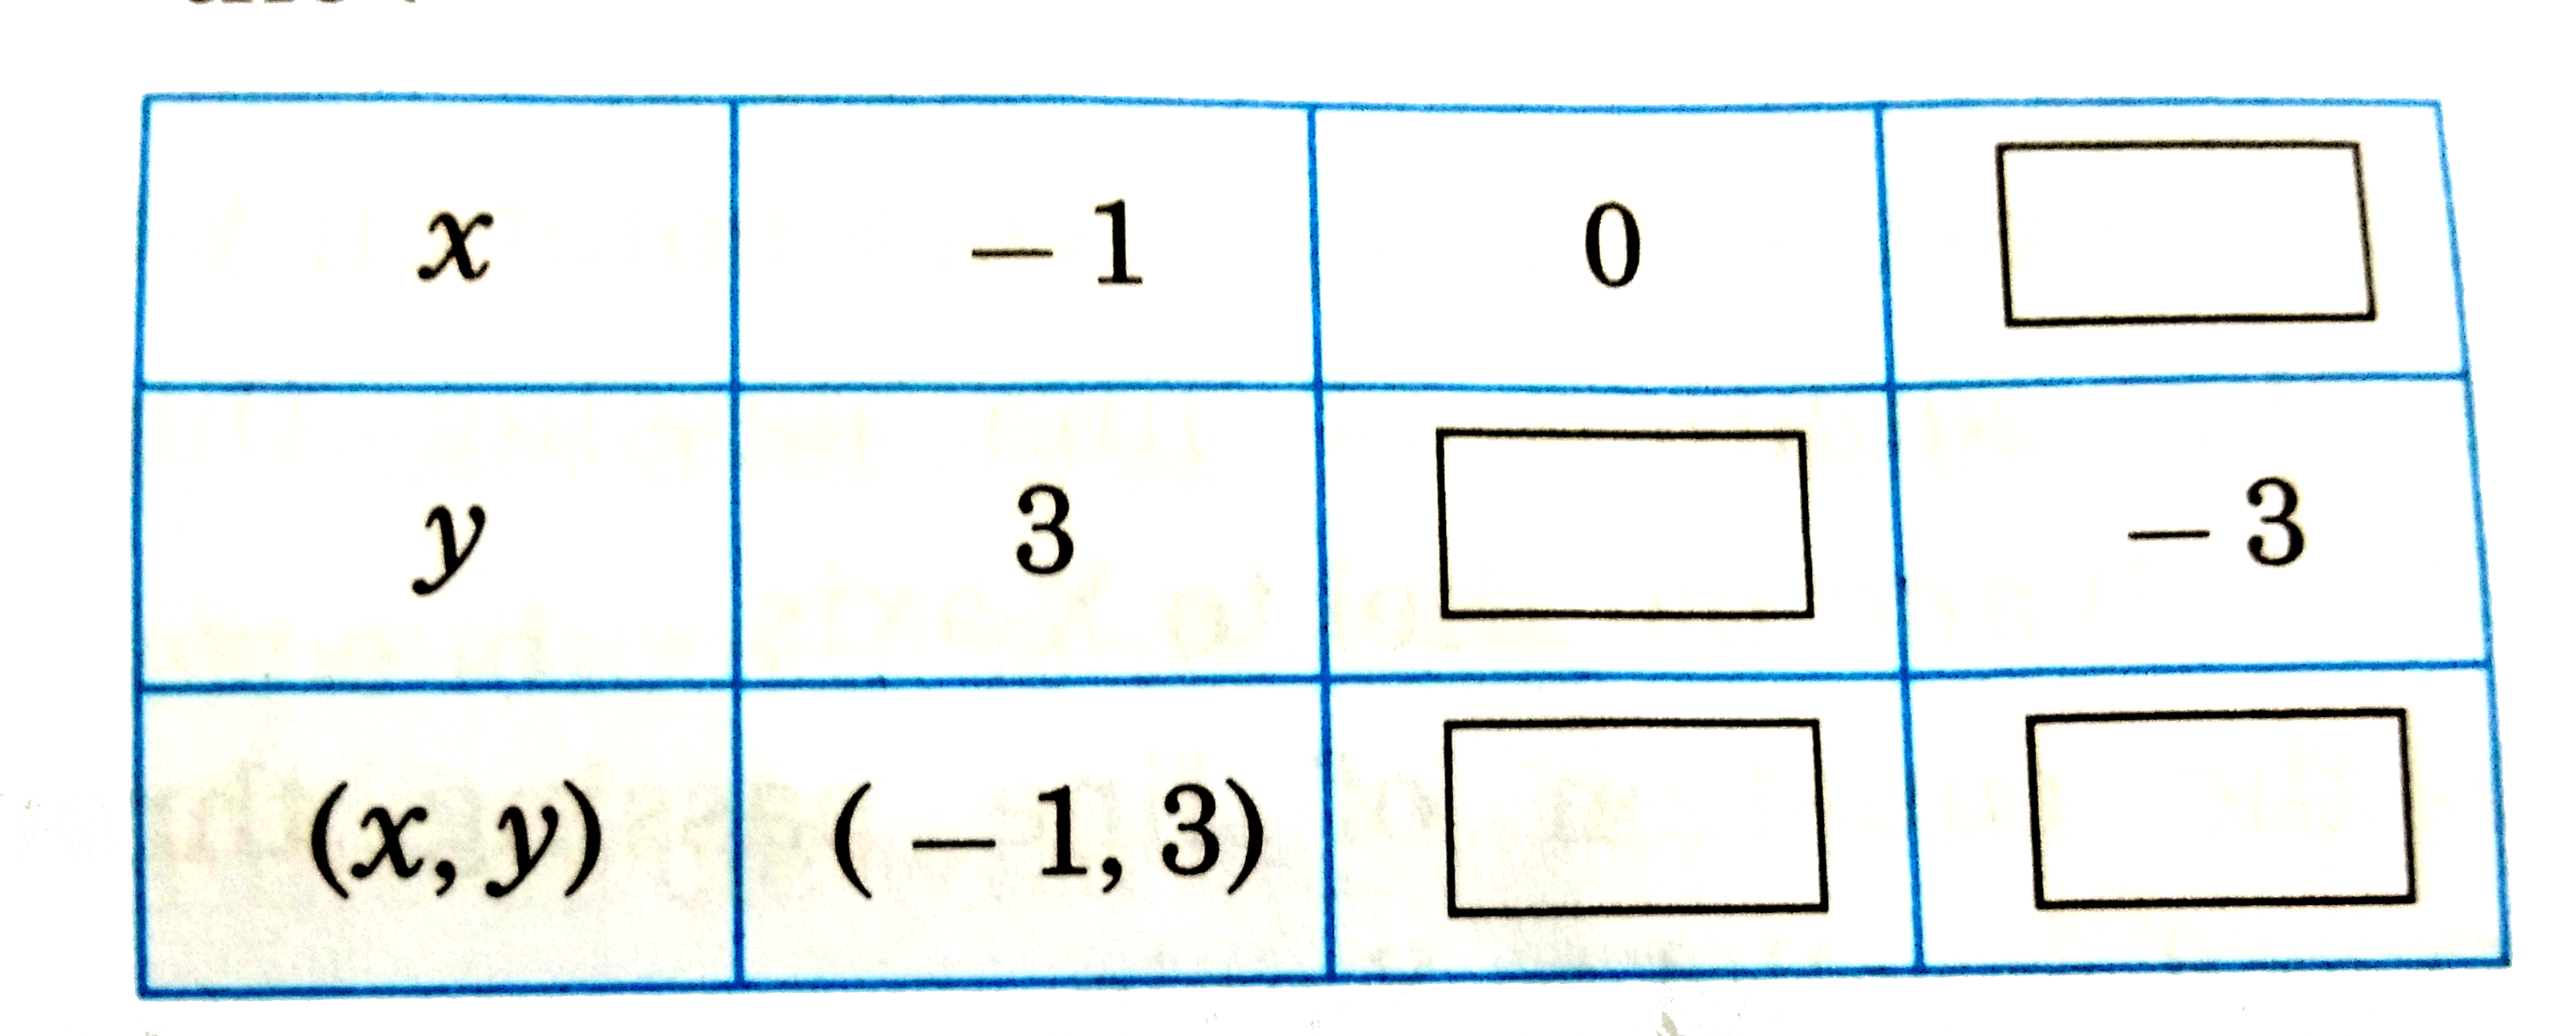
View SolutionTo draw the graph of equation 2x+y=1 , complete the following table :
View Solution
