Draw a pie chart showing the following information. The table shows the colours preferred by a group of people. Colours Numbers of people like Blue Green Red Yellow and Total
Given above is the video Showing how to make pie chart from given data.
Topper's Solved these Questions
- DATA HANDLINGBOOK - NCERT ENGLISHCHAPTER - DATA HANDLINGEXERCISE - SOLVED EXAMPLES
1 Videos
- DATA HANDLINGBOOK - NCERT ENGLISHCHAPTER - DATA HANDLINGEXERCISE - EXERCISE 5.1
5 Videos
- CUBES AND CUBE ROOTSBOOK - NCERT ENGLISHCHAPTER - CUBES AND CUBE ROOTSEXERCISE - SOLVED EXAMPLES
8 Videos
- DIRECT AND INVERSE PROPORTIONSBOOK - NCERT ENGLISHCHAPTER - DIRECT AND INVERSE PROPORTIONSEXERCISE - EXERCISE 13.1
10 Videos
Similar Questions

Human blood can be classified into four common blood types—A, B, AB, and O. It is also characterized by the presence (+) or absence (–) of the rhesus factor. The table above shows the distribution of blood type and rhesus factor for a group of people. If one of these people who is rhesus negative (–) is chosen at random, the probability that the person has blood type B is 19 . What is the value of x ?
View SolutionTwo hundred students of class VI and VII were asked to name their favourite colours so as to decide upon what should be the colour of their school house. The results are shown in the following table. Colour:, Red, Green, Blue, Yellow, Orange Number of student, 43, 19, 55, 49, 34 Represent the given data on a bar graph. Which is the most preferred colour and which is the least? How many colours are there in all?
View Solution
Knowledge Check
A group of people were surveyed one of the choose one of the tow TV shows they preferred more : Sherlock Holmes and Friends . Of the total 30 people who put forward their choice , 18 chose Sherlck Holmes and 20 chose Friends.Each preson had to choose one of the shows mentioned above . Choose the correct statements (s) :
I. 8 people liked both shows.
II. 22 people perferred one show over the other .
III. 12 people liked only one of the two shows.AOnly IBOnly IICOnly IIIDBoth I and IIWhen alkaline earth metals dissolve ini ammonia, they form coloured solution like alkali metals. Which of the following observations regarding the reaction are correct?
(i) Dilute solutions are bright blue in colour due to solvated electrons.
(ii) These solutions decompose to form amides and hydrogen.
(iii) From this solution the ammoniates
[M(NH3)6]2+ can be recovered by evaporation.AOnly (i) and (ii)BOnly (i), (ii) and (iii)COnly (ii) and (iii)DOnly (i)
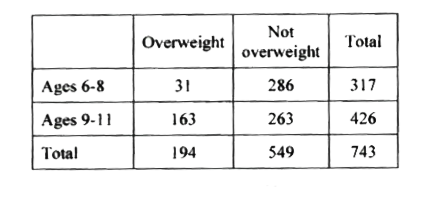
743 children from the United States, aged 6 through 11, were tested to see if they were overweight . The data are shown in the table below.

In 2014 the total population of children between 6 and 11 years old, inclusive , in the United States was about 74.3 million. If the test results are used to estimate information about children across the country, which of the following is the best estimate of the total number of children between 9 and 11 years old in the United States who were overweight in 2014 ?
View SolutionAn insurance company selected 2000 drivers at random (i.e., without any preference of one driver over another) in a particular city to find a relationship between age and accidents. The data obtained are given in the following table: Find the probabilities of the following events for a driver chosen at random from the city: (i) The driver being in the age group 18−29 years and having exactly 3 accidents in one year. (ii) The driver being in the age group of 30−50 year and having one or more accidents in a year. (iii) The number of drivers having no accidents in one year
View SolutionA survey was made to find the type of music that a certain group of young people liked in a city.Adjoining pie chart shows the findings of this survey. From this pie chart answer the following:(i) If 20 people liked classical music, how many young people were surveyed?(ii) Which type of music is liked by the maximum number of people?
View SolutionBorax Bead Test is carried out when the original mixture is coloured. It is done with the help of a cleam platinum wire on which a small loop is made at the end. When borax is heated on platinum wire loop transparent glass like bead is obtained. The hot bead is brought in contact with salt till it reacts with fused borax and colour is imparted to the bead. bead colour is noted.
Colour of the beadIon1. Blue greenCu2+2. Yellow Fe3+3. GreenCr3+4. VioletMn2+5. Dark blueCo2+6. BrownNi2+
Q. Blue bead can be of:
View SolutionBorax Bead Test is carried out when the original mixture is coloured. It is done with the help of a cleam platinum wire on which a small loop is made at the end. When borax is heated on platinum wire loop transparent glass like bead is obtained. The hot bead is brought in contact with salt till it reacts with fused borax and colour is imparted to the bead. bead colour is noted.
Colour of the beadIon1. Blue greenCu2+2. Yellow Fe3+3. GreenCr3+4. VioletMn2+5. Dark blueCo2+6. BrownNi2+
Q. The flame used in Borax Bead Test is:
View SolutionBorax Bead Test is carried out when the original mixture is coloured. It is done with the help of a cleam platinum wire on which a small loop is made at the end. When borax is heated on platinum wire loop transparent glass like bead is obtained. The hot bead is brought in contact with salt till it reacts with fused borax and colour is imparted to the bead. bead colour is noted.
Colour of the beadIon1. Blue greenCu2+2. Yellow Fe3+3. GreenCr3+4. VioletMn2+5. Dark blueCo2+6. BrownNi2+
Q. Glassy bead of :
View Solution
