Draw the graph of following function
2Cos3x
To draw the graph of the function y=2cos(3x), we will follow these steps:
Step 1: Identify the amplitude and period
The amplitude of the function y=2cos(3x) is given by the coefficient of the cosine function, which is 2. The period of the cosine function is calculated using the formula:
Period=2π|b|
where b is the coefficient of x in the cosine function. Here, b=3, so:
Period=2π3
Step 2: Determine key points
To plot the graph, we need to find key points. We will evaluate y=2cos(3x) at several standard angles. We can choose x values such as 0,π6,π3,π2,2π3,π1,3π2, and so on.
Calculating these points:
1. For x=0:
y=2cos(3⋅0)=2cos(0)=2⋅1=2
2. For x=π6:
y=2cos(3⋅π6)=2cos(π2)=2⋅0=0
3. For x=π3:
y=2cos(3⋅π3)=2cos(π)=2⋅(−1)=−2
4. For x=π2:
y=2cos(3⋅π2)=2cos(3π2)=2⋅0=0
5. For x=2π3:
y=2cos(3⋅2π3)=2cos(2π)=2⋅1=2
6. For x=5π6:
y=2cos(3⋅5π6)=2cos(5π2)=2⋅0=0
7. For x=π:
y=2cos(3⋅π)=2cos(3π)=2⋅(−1)=−2
Step 3: Plot the points
From the calculations, we have the following points:
- (0,2)
- (π6,0)
- (π3,−2)
- (π2,0)
- (2π3,2)
- (5π6,0)
- (π,−2)
Step 4: Draw the graph
Using the points calculated, we can sketch the graph of y=2cos(3x). The graph will oscillate between 2 and -2, with a period of 2π3. It will have the following characteristics:
- Starts at (0,2)
- Crosses the x-axis at π6 and π2
- Reaches a minimum at π3 and π
- Completes one full cycle by 2π3
Step 5: Extend the graph
Since the cosine function is periodic, we can extend the graph in both directions by repeating the pattern.
The amplitude of the function y=2cos(3x) is given by the coefficient of the cosine function, which is 2. The period of the cosine function is calculated using the formula:
To plot the graph, we need to find key points. We will evaluate y=2cos(3x) at several standard angles. We can choose x values such as 0,π6,π3,π2,2π3,π1,3π2, and so on.
y=2cos(3⋅0)=2cos(0)=2⋅1=2
y=2cos(3⋅π6)=2cos(π2)=2⋅0=0
y=2cos(3⋅π3)=2cos(π)=2⋅(−1)=−2
y=2cos(3⋅π2)=2cos(3π2)=2⋅0=0
y=2cos(3⋅2π3)=2cos(2π)=2⋅1=2
y=2cos(3⋅5π6)=2cos(5π2)=2⋅0=0
y=2cos(3⋅π)=2cos(3π)=2⋅(−1)=−2
From the calculations, we have the following points:
- (0,2)
- (π6,0)
- (π3,−2)
- (π2,0)
- (2π3,2)
- (5π6,0)
- (π,−2)
Using the points calculated, we can sketch the graph of y=2cos(3x). The graph will oscillate between 2 and -2, with a period of 2π3. It will have the following characteristics:
- Starts at (0,2)
- Crosses the x-axis at π6 and π2
- Reaches a minimum at π3 and π
- Completes one full cycle by 2π3
Since the cosine function is periodic, we can extend the graph in both directions by repeating the pattern.
Topper's Solved these Questions
- BOOK - RS AGGARWALCHAPTER - GRAPHS OF TRIGONOMETRIC FUNCTIONSEXERCISE - EXERCISE 196videos
GRAPHS OF TRIGONOMETRIC FUNCTIONS
- BOOK - RS AGGARWALCHAPTER - GEOMETRICAL PROGRESSIONEXERCISE - EXERCISE 12H (Very Short Answer Type Questions)13videos
GEOMETRICAL PROGRESSION
- BOOK - RS AGGARWALCHAPTER - HYPERBOLAEXERCISE - EXERCISE 2423videos
HYPERBOLA
Similar Questions
Draw the graph of following function y=cos−1(cosx) y=sin−1(sinx) y=cos(cos−1x) y=sin(sin−1x)
View SolutionDraw the graph of the following function.
f(2x)View SolutionDraw the graph of the following function.
2f(x)View SolutionConsider the following function f whose graph is given below.
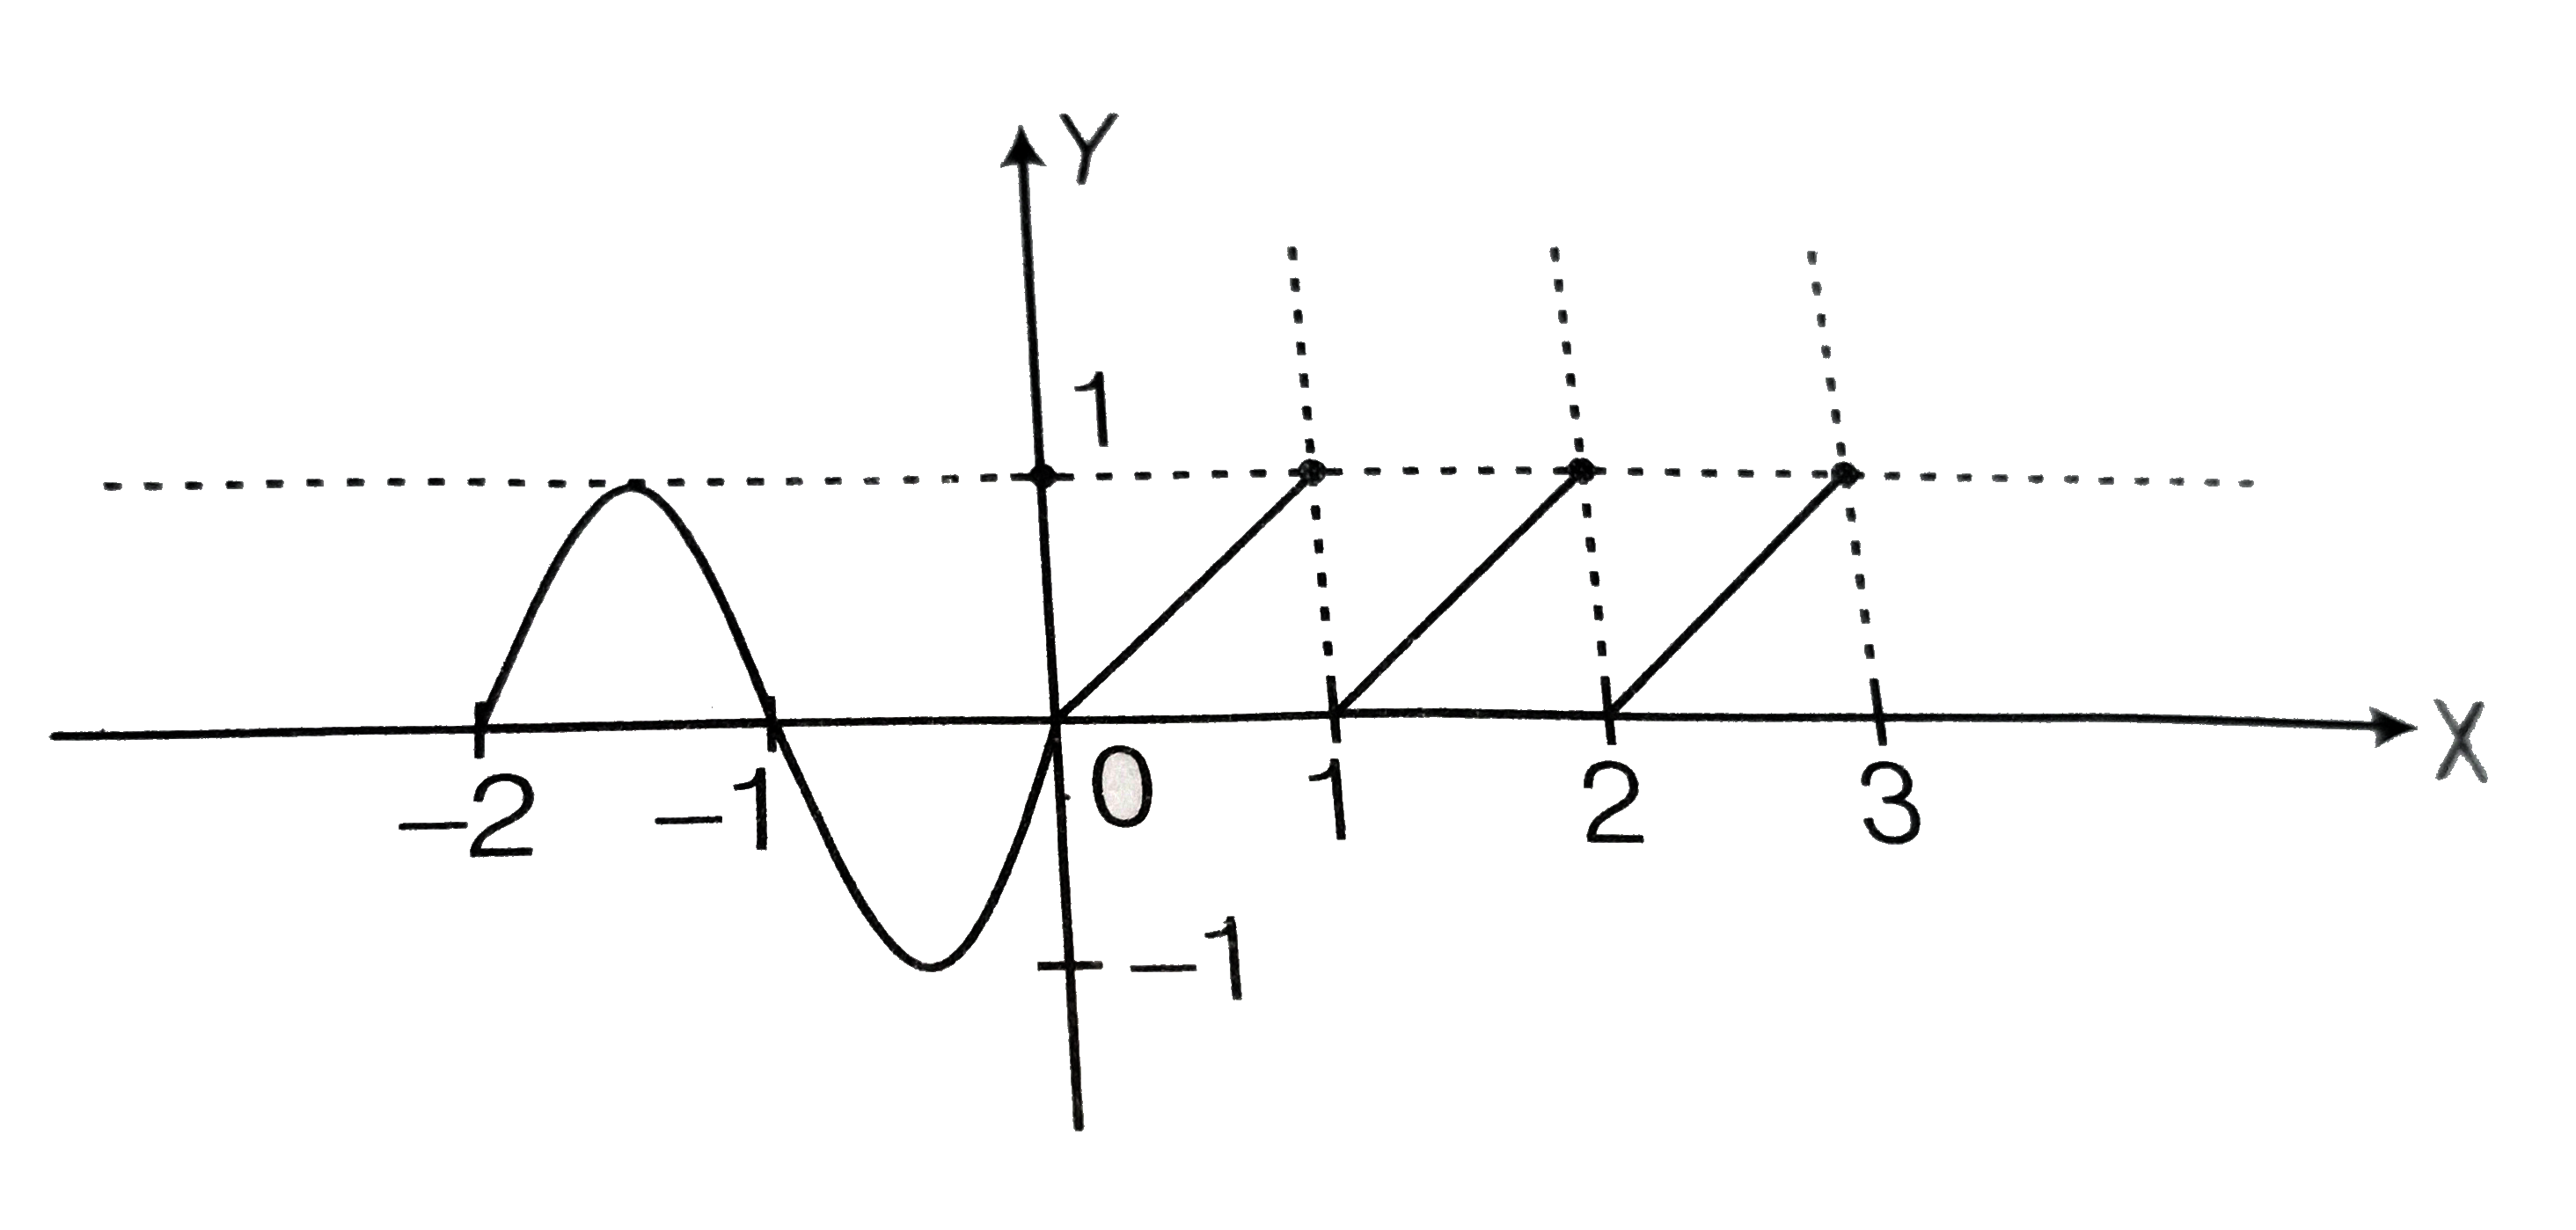
Draw the graph of following functions.
(g) f(x−[x])View SolutionConsider the following function f whose graph is given below.
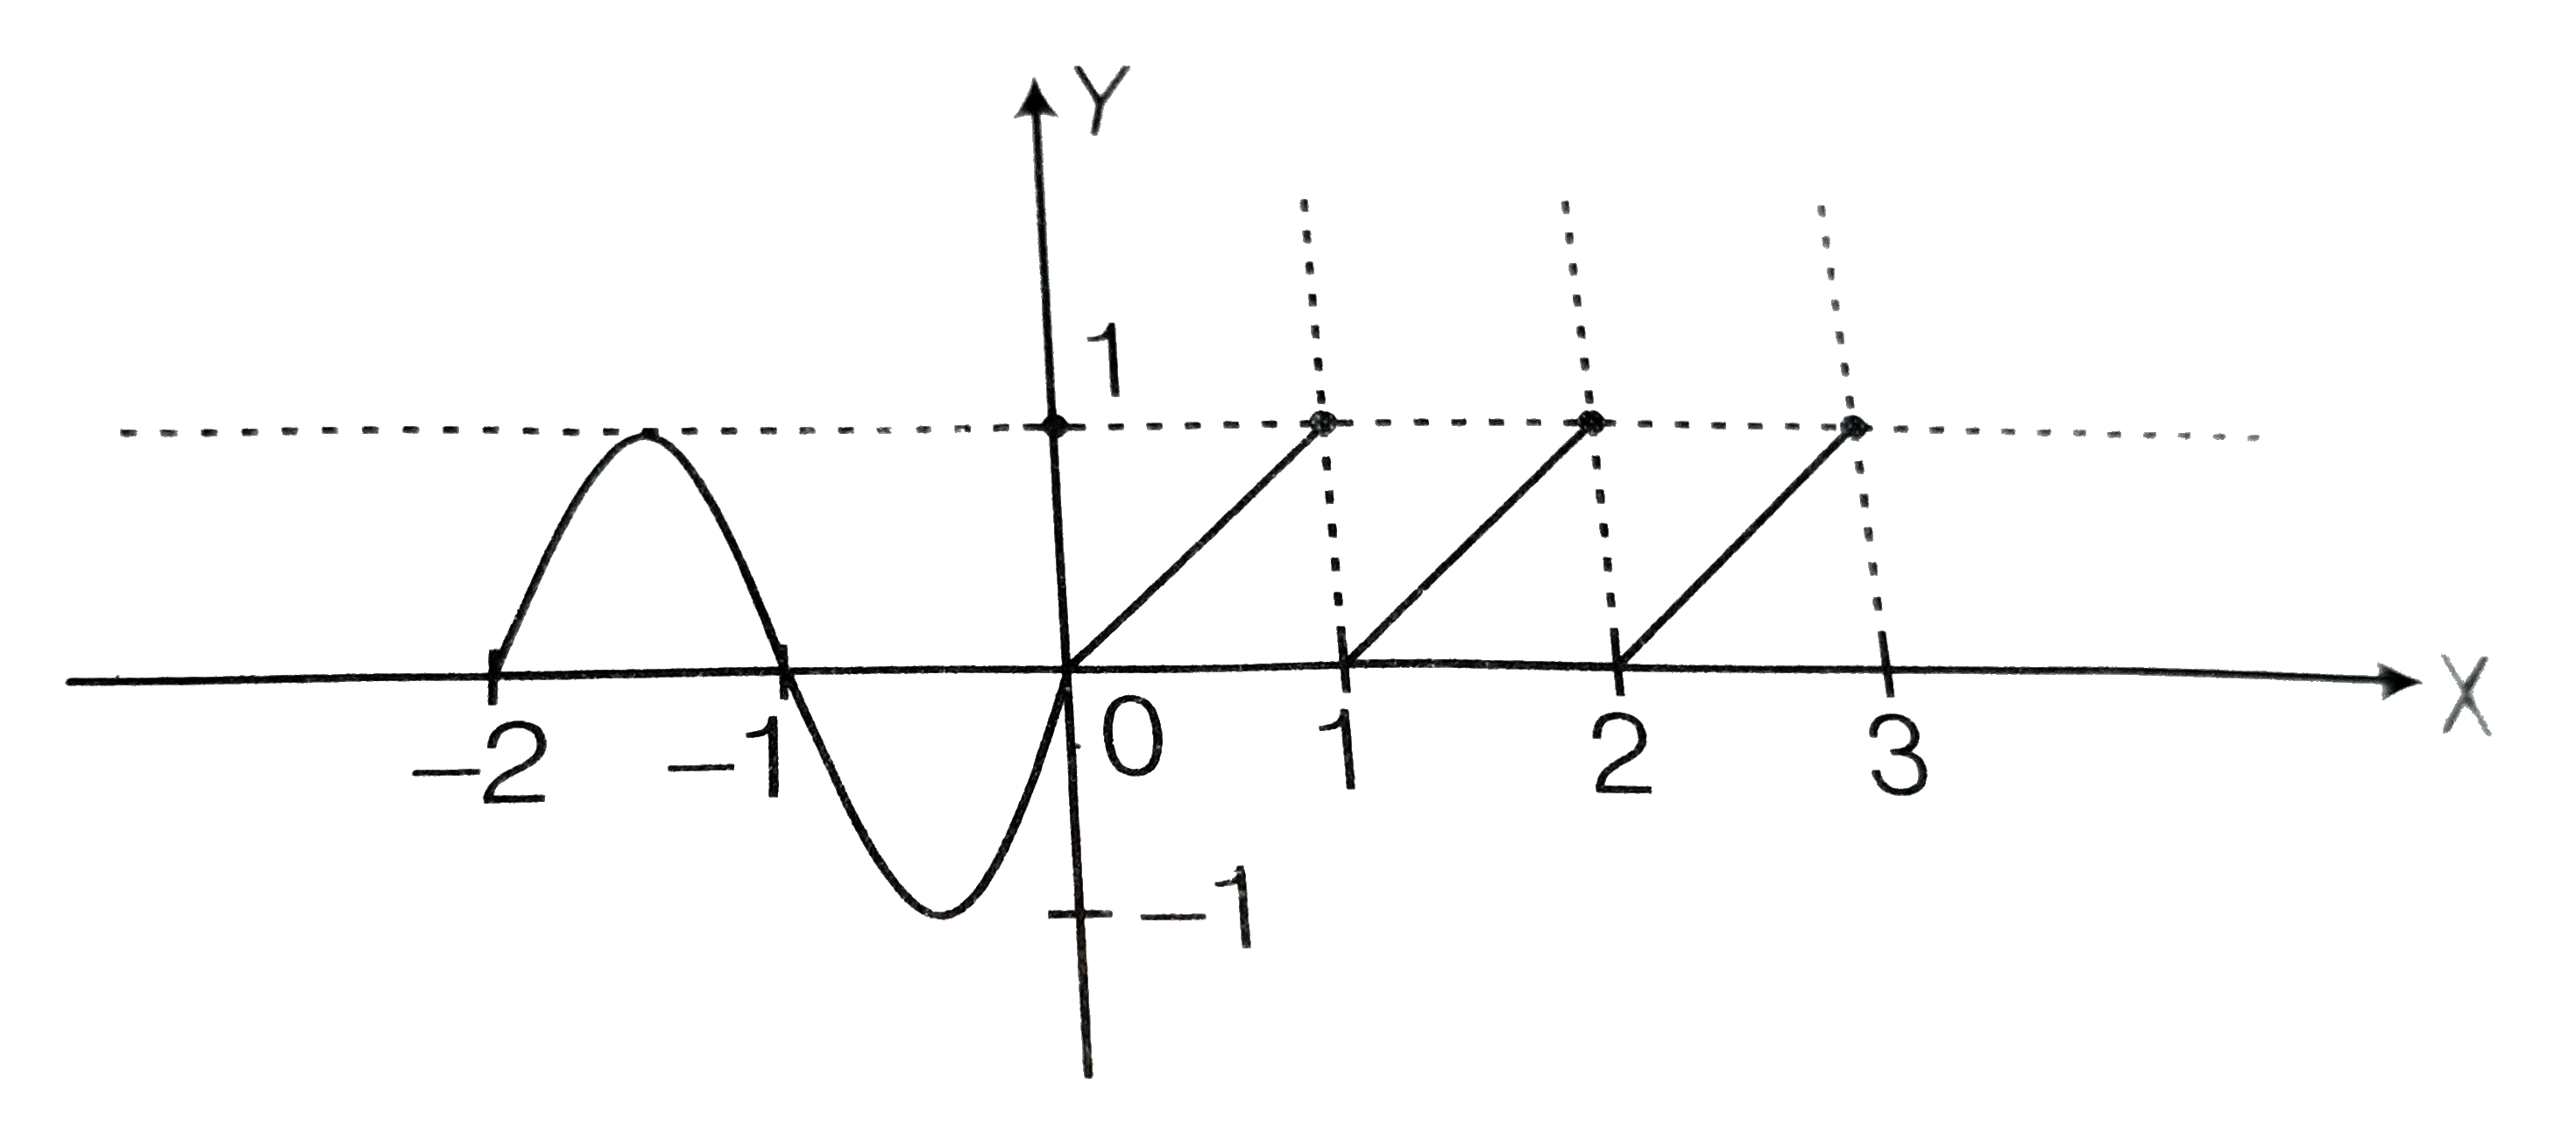
Draw the graph of following functions.
(a) f(x)+1View SolutionConsider the following function f whose graph is given below.
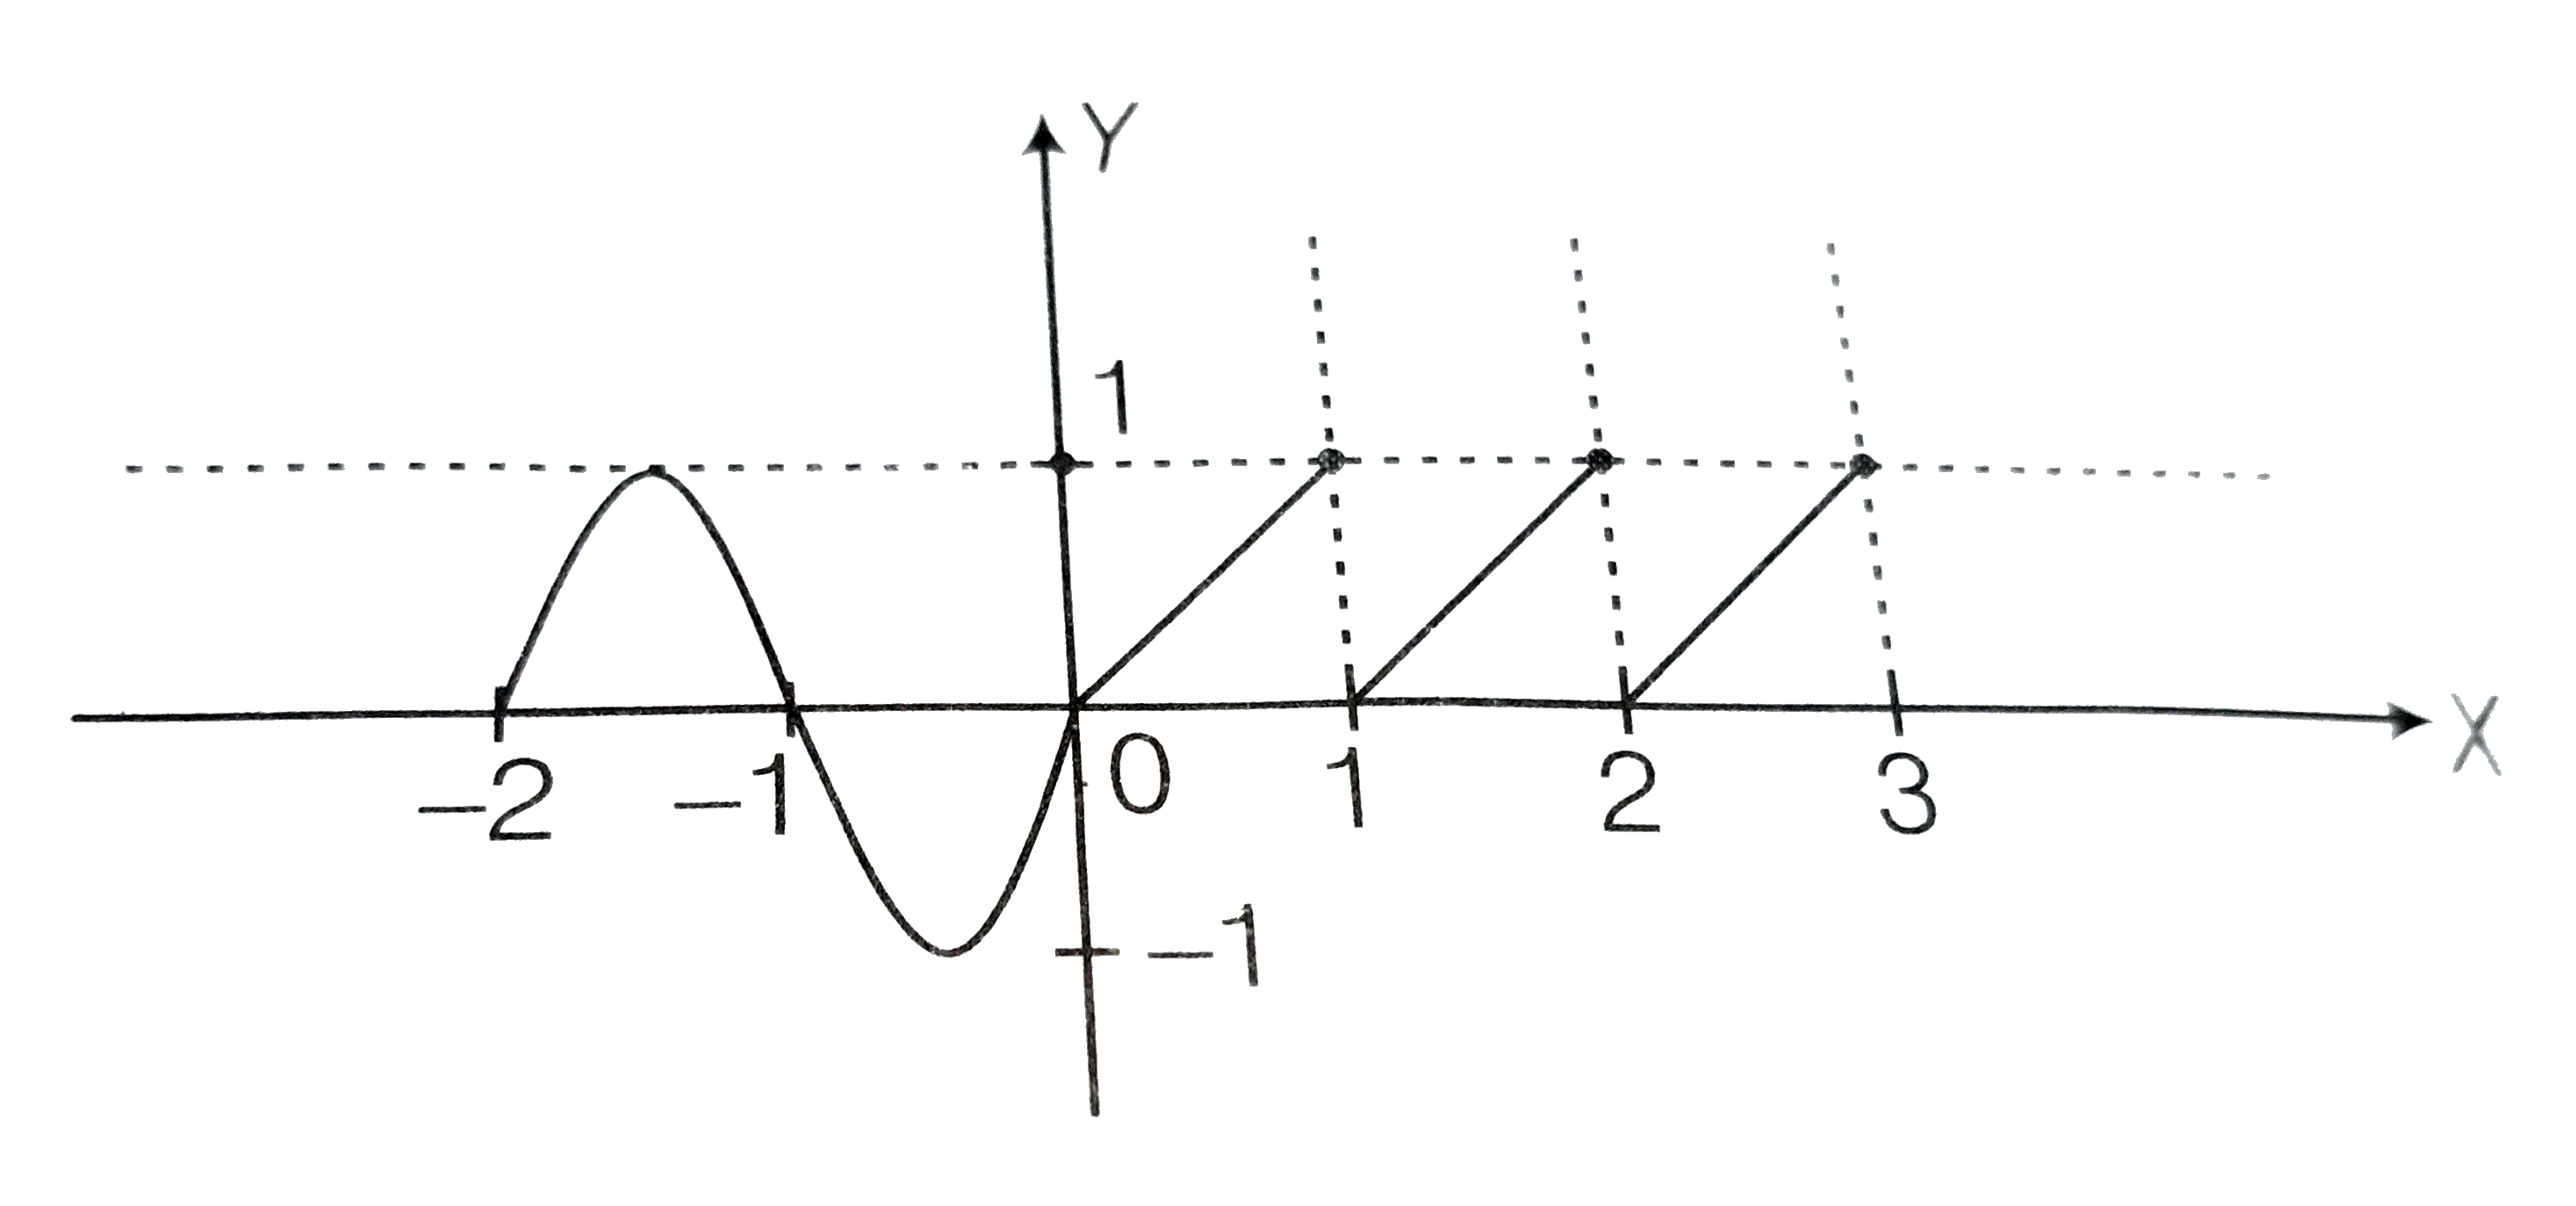
Draw the graph of following functions.
(b) f(x)−1View SolutionDraw the graph of the following function: h(x)=∣∣tan−1(3x)∣∣
View SolutionConsider the following function f whose graph is given below.
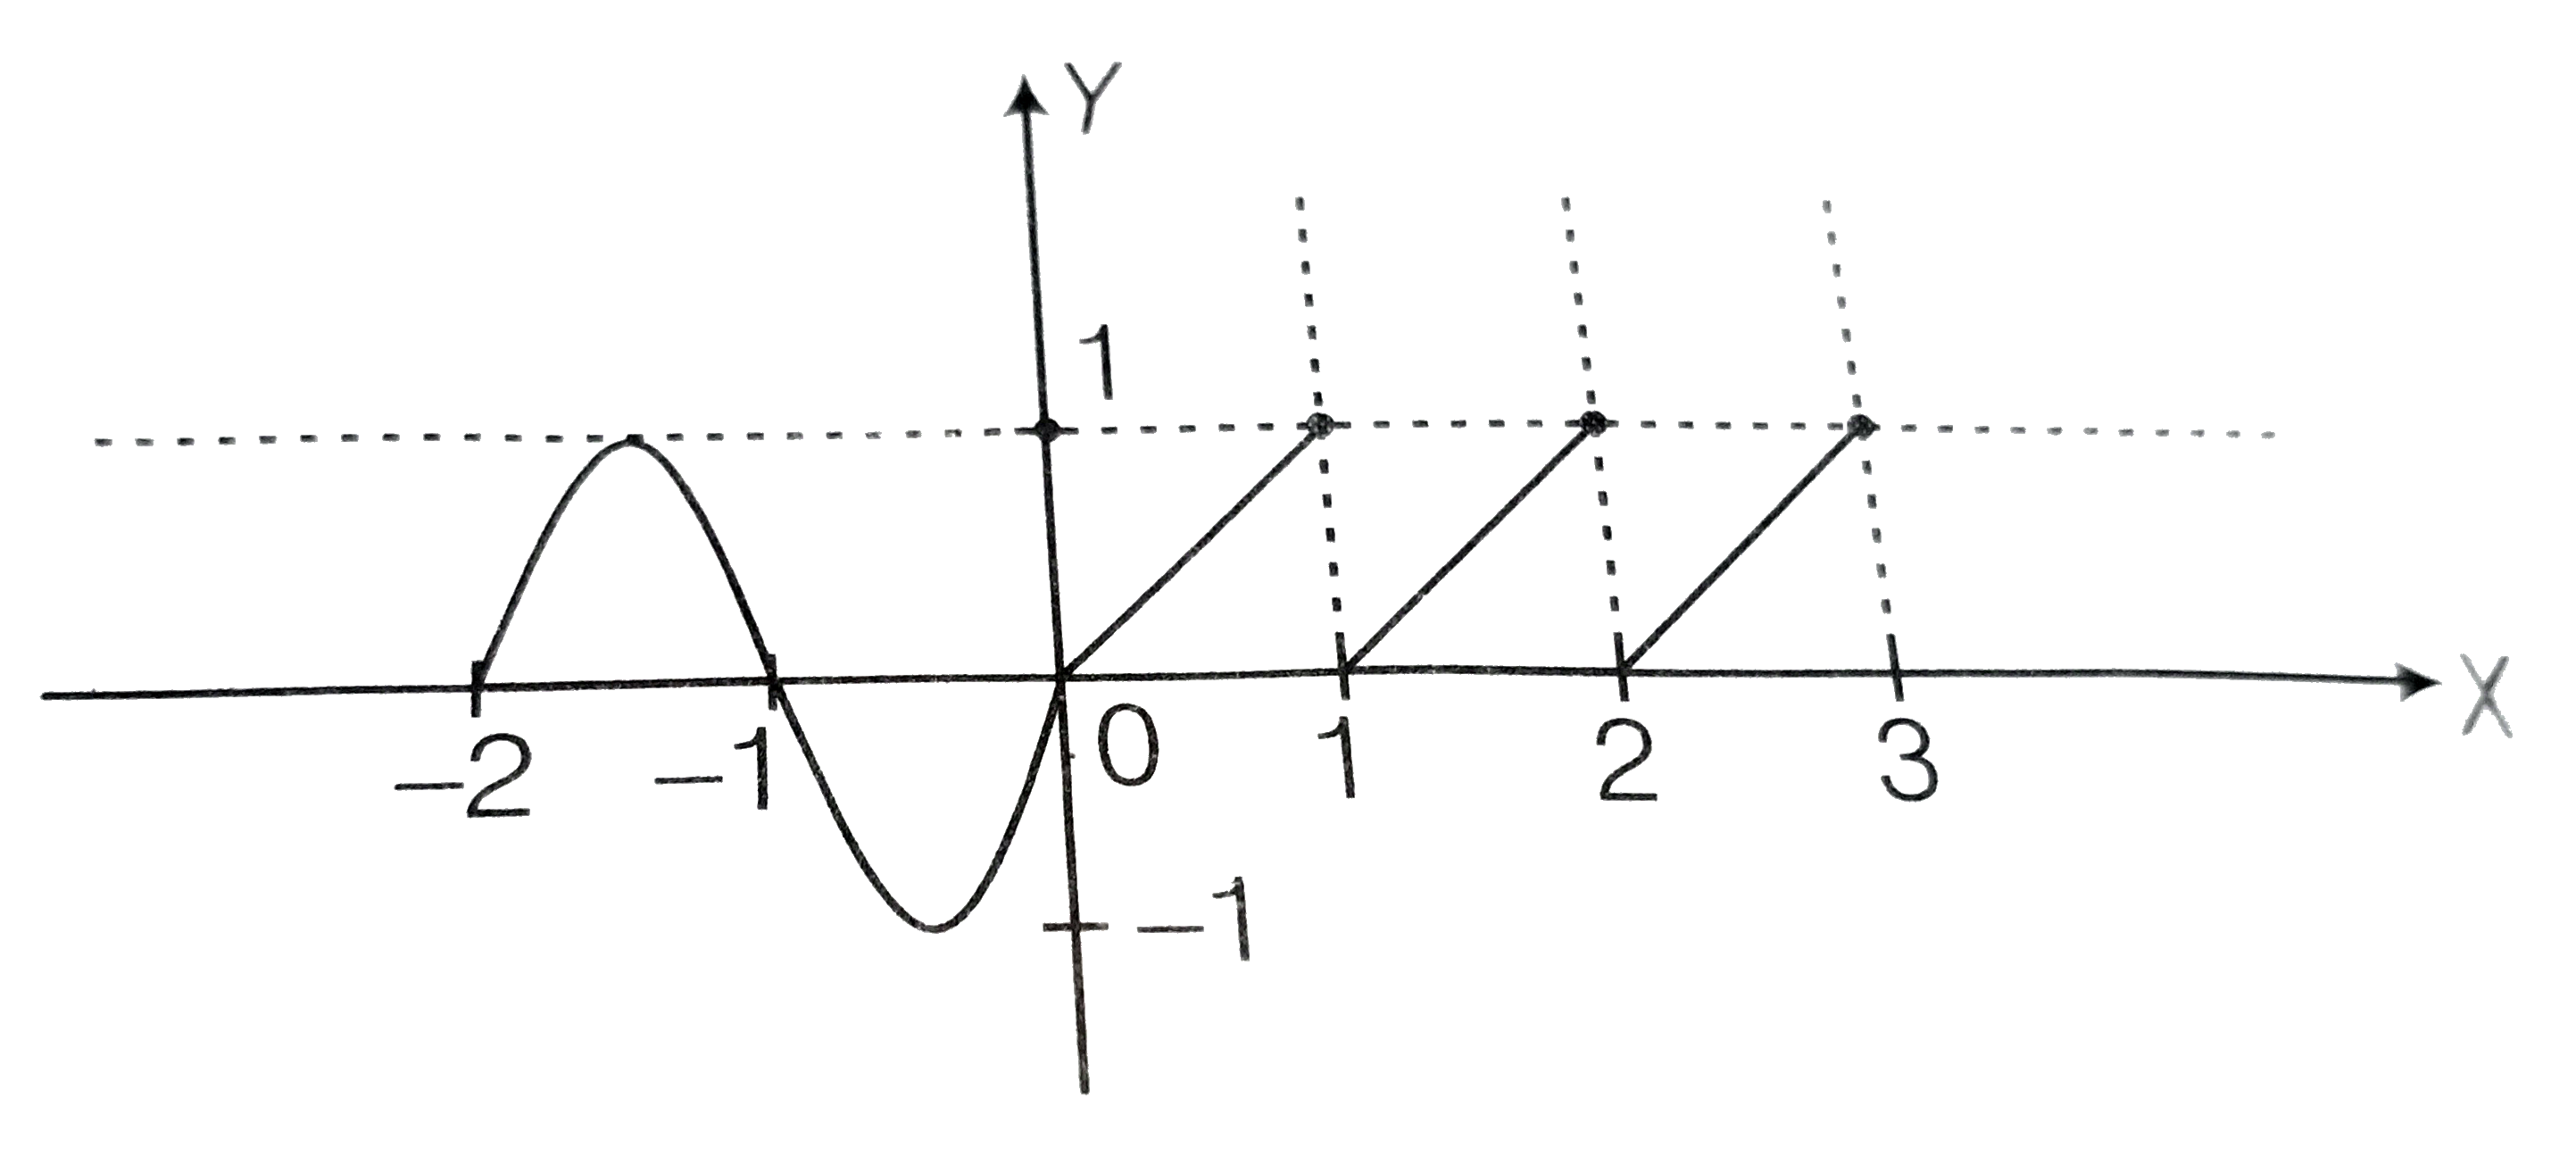
Draw the graph of following functions.
(g) 2f(x)View SolutionConsider the following function f whose graph is given below.
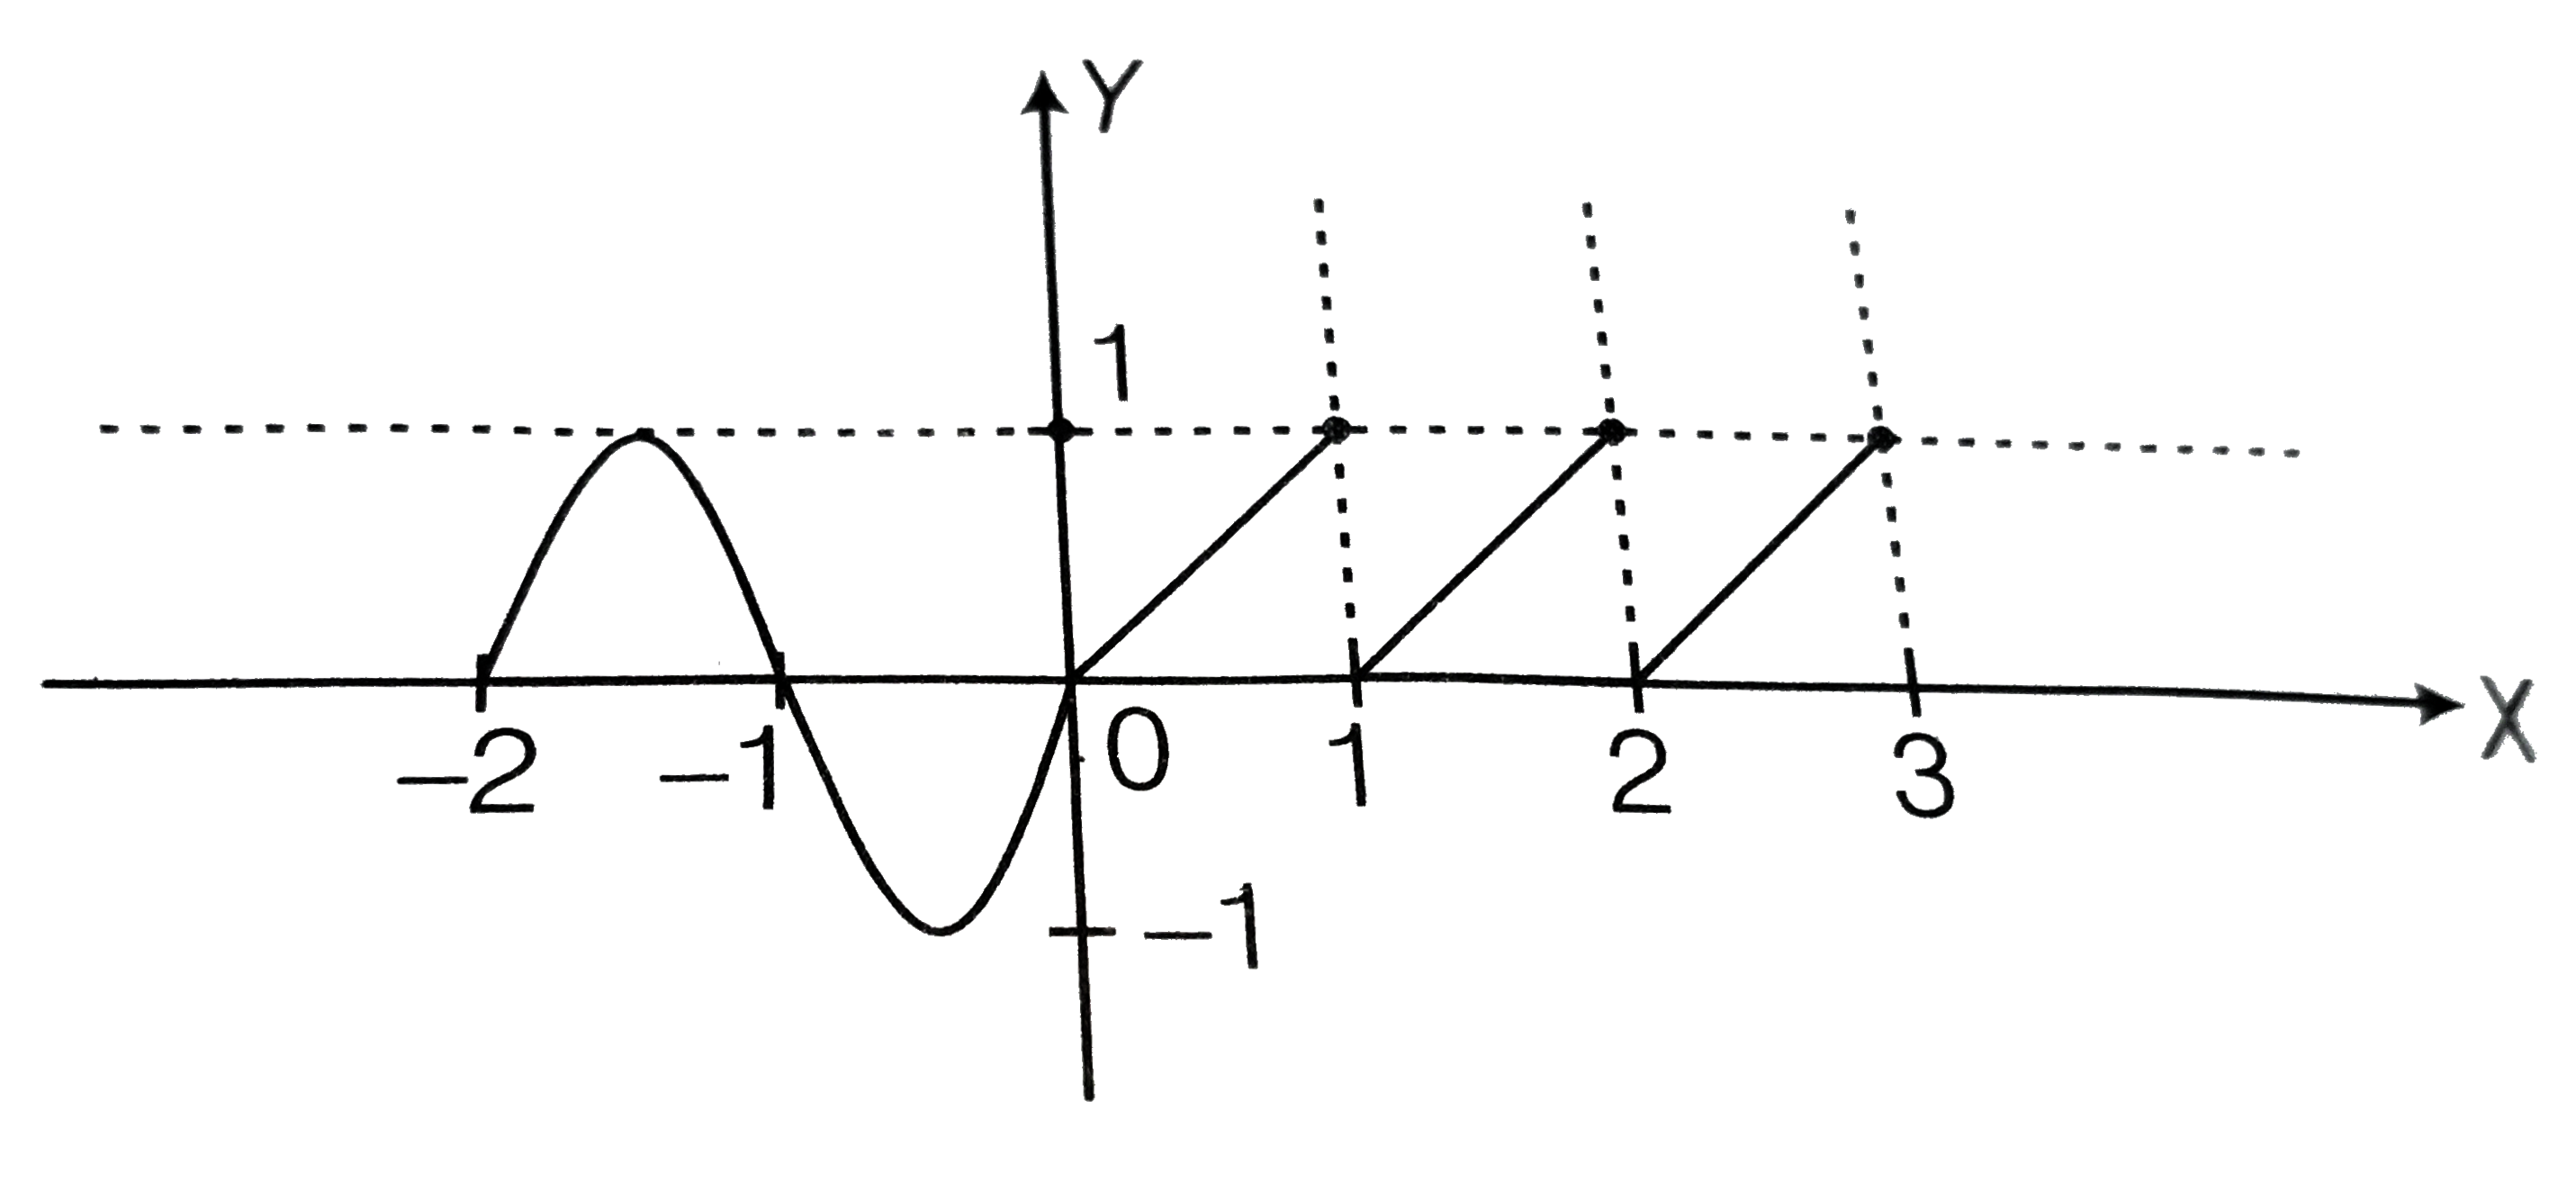
Draw the graph of following functions.
(h) f(2x)View SolutionDraw the graph of the following function: f(x)=sin−1(x+2)
View Solution

