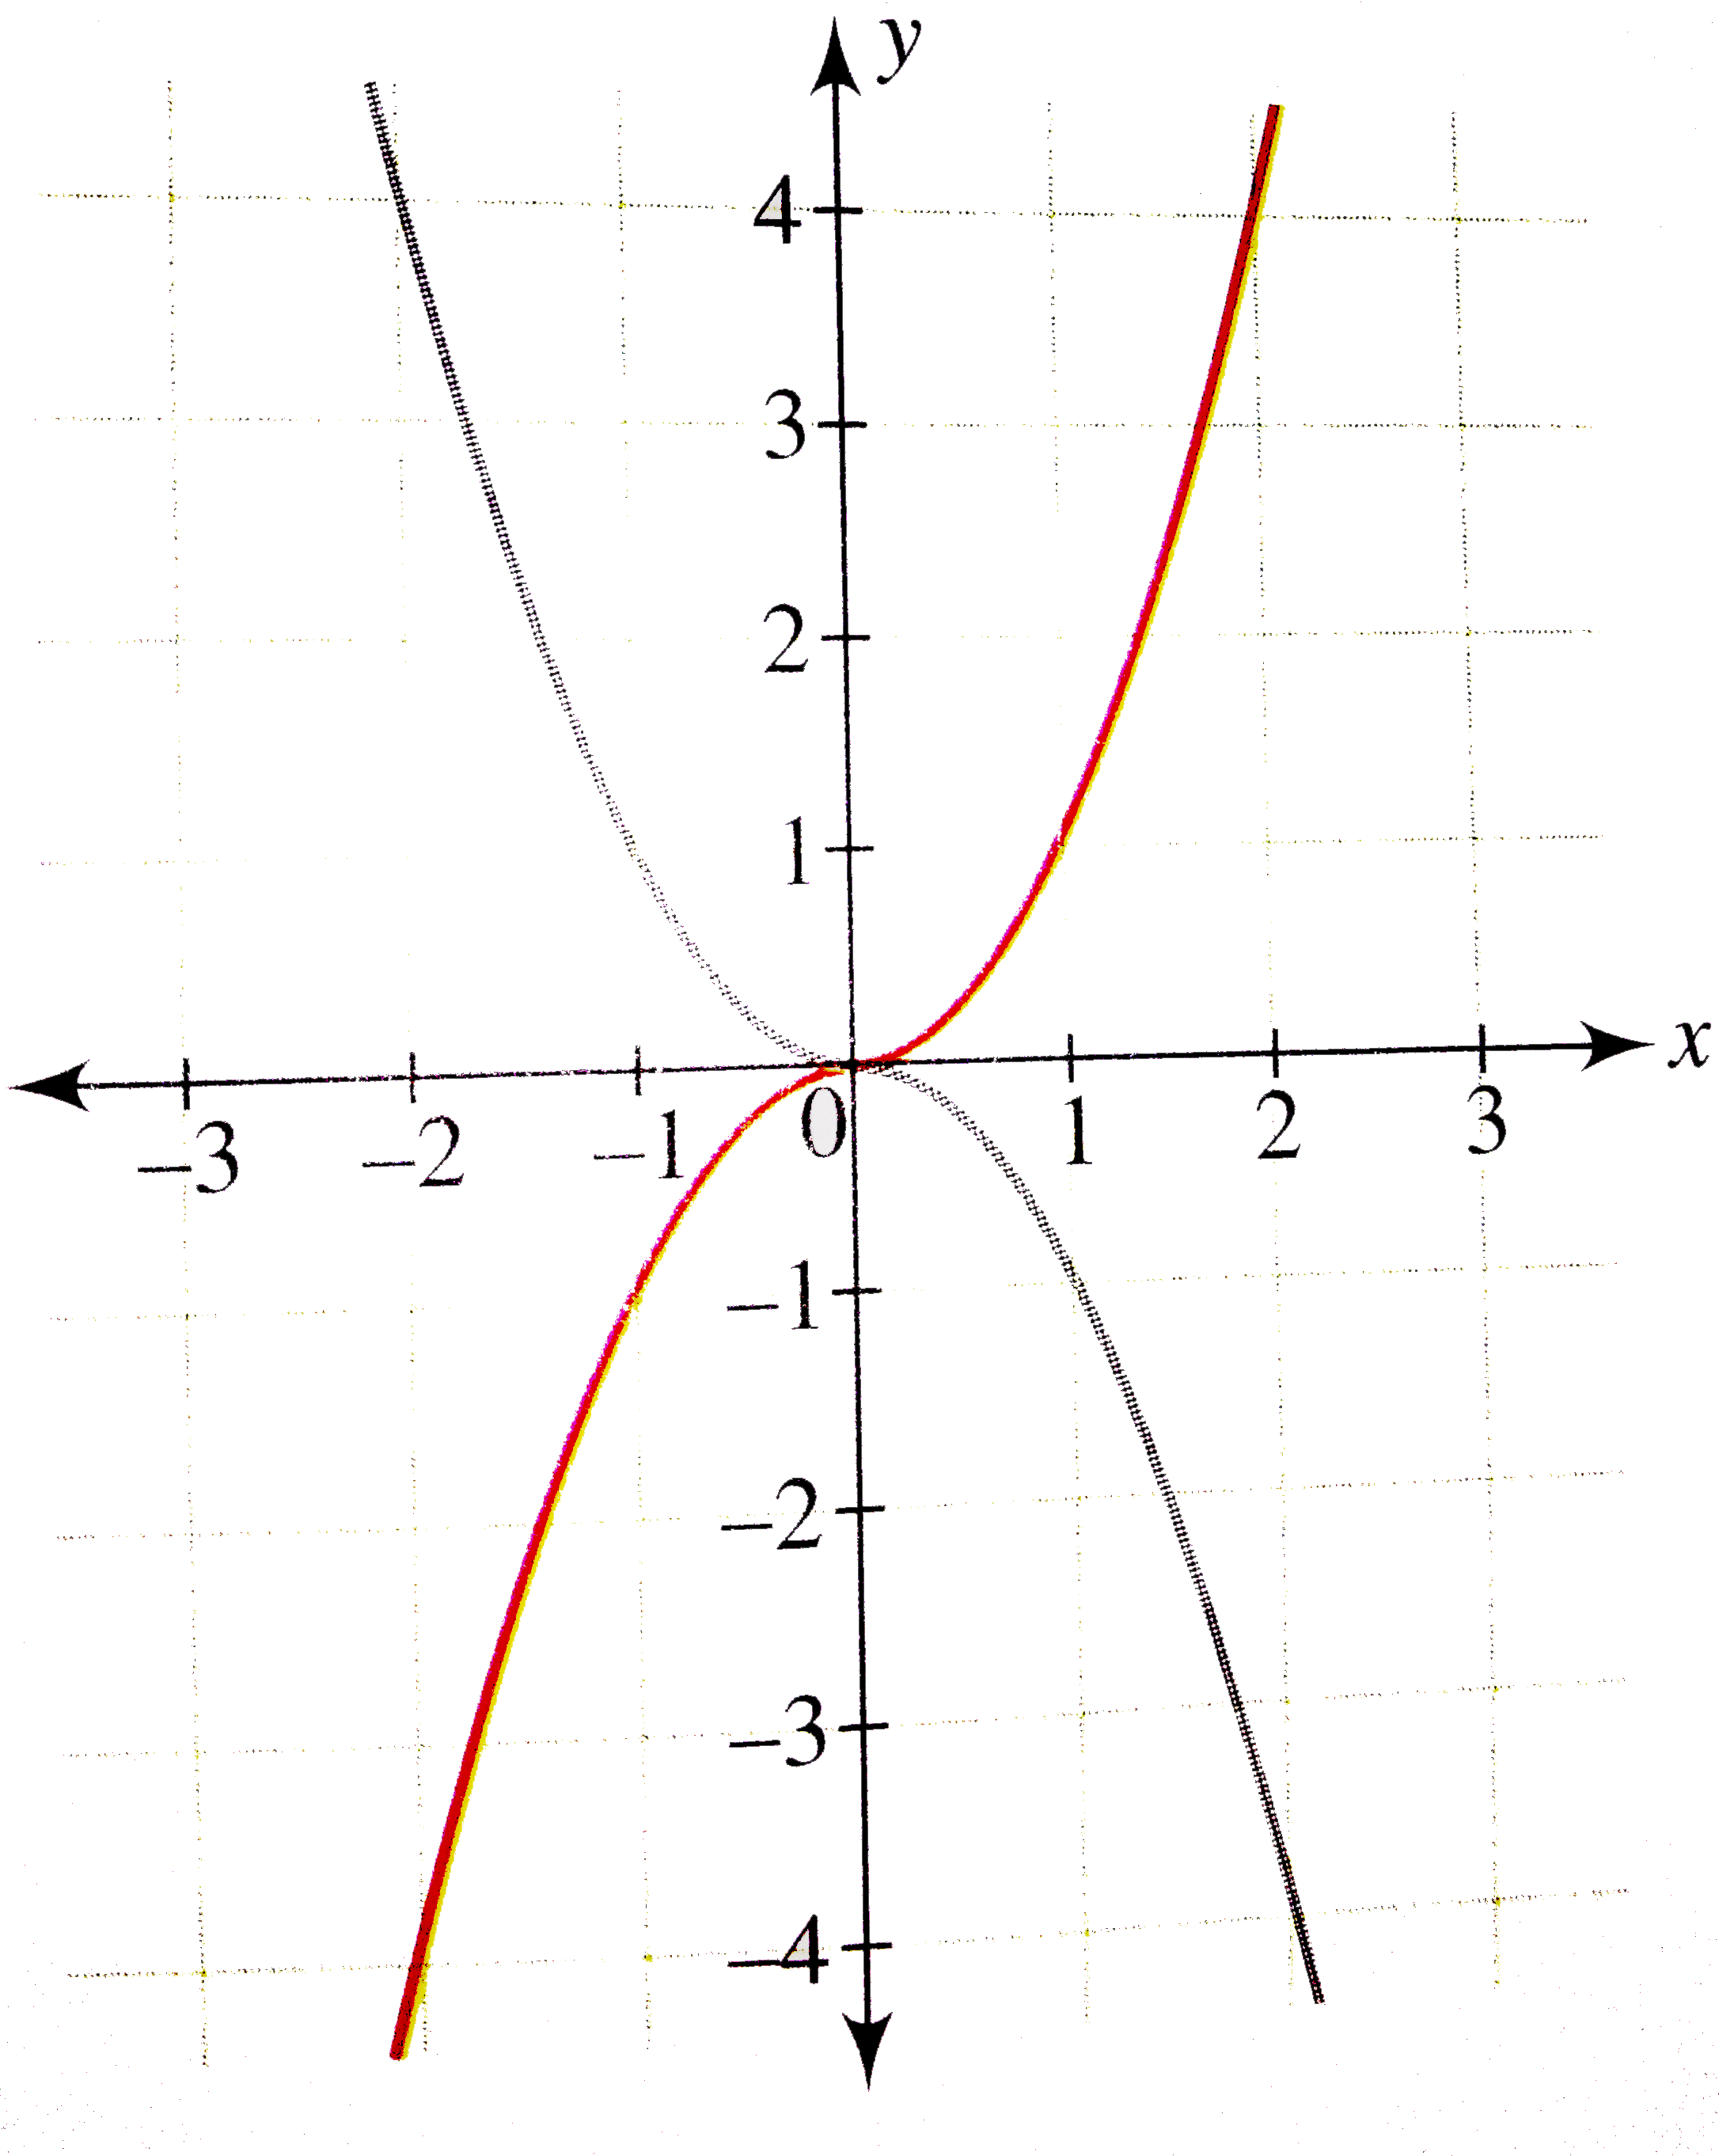
Draw the graph of f(x)=x|x|.
Video Solution
Text Solution
y=f(x)=x|x|={x⋅x=x2,x≥0x⋅(−x)=−x2,x<0
Thus, for x≥0, we have, parabola y=x2, which is concave upward, and for x<0, we have the parabola y=−x2, which is concave downward.
Hence the graph of the function is as shown in the following figure.

|
Updated on:21/07/2023
Topper's Solved these Questions
- BOOK - CENGAGE ENGLISHCHAPTER - GRAPHS OF ELEMENTARY FUNCTIONS EXERCISE - EXERCISES34videos
GRAPHS OF ELEMENTARY FUNCTIONS
- BOOK - CENGAGE ENGLISHCHAPTER - GRAPHS OF POLYNOMIAL AND RATIONAL FUNCTIONSEXERCISE - Exercises17videos
GRAPHS OF POLYNOMIAL AND RATIONAL FUNCTIONS
- BOOK - CENGAGE ENGLISHCHAPTER - GRAPHS OF TRIGONOMETRIC FUNCTIONSEXERCISE - Exercises22videos
GRAPHS OF TRIGONOMETRIC FUNCTIONS
Similar Questions
Draw the graph of f(x)=|sinx|+|cosx|,x∈R.
View SolutionDraw the graph of f(x)=|tanx|+|cotx|.
View SolutionDraw the graph of f(x)=|x−1|+|2x−3|. Find the range of the function.
View SolutionDraw the graph of f(x)=|2x−1|+|2x−3|. Find the range of the function.
View SolutionDraw the graph of f(x)=y=|x−1|+3|x−2|−5|x−4| and find the values of λ for which the equation f(x)=λ has roots of opposite sign.
View SolutionThe function f is defined by f(x)=⎧⎪⎨⎪⎩1−x x<01 x=0x+1 x>0⎫⎪⎬⎪⎭. Draw the graph of f(x).
View SolutionDraw the graph of f(x)=x3−xx2−1.
View SolutionDraw the graph of f(x)=|x−1|x−1.
View SolutionDraw the graph of f(x)=(x+2)|x−1|.
View SolutionDraw the graph of f(x)=|x|−|2x−3|. Find the range of the function.
View Solution

