Draw the graph of y=loge(sinx).Solution in Tamil
We have y=f(x)=loge(sinx)
Clearly, y = f(x) is defined when sinx>0, i.e. x lies in the 1st and 2nd quadrants only expect the quadrant angle.
Also we have 0<sinx≤1
∴ −∞<loge(sinx)≤0
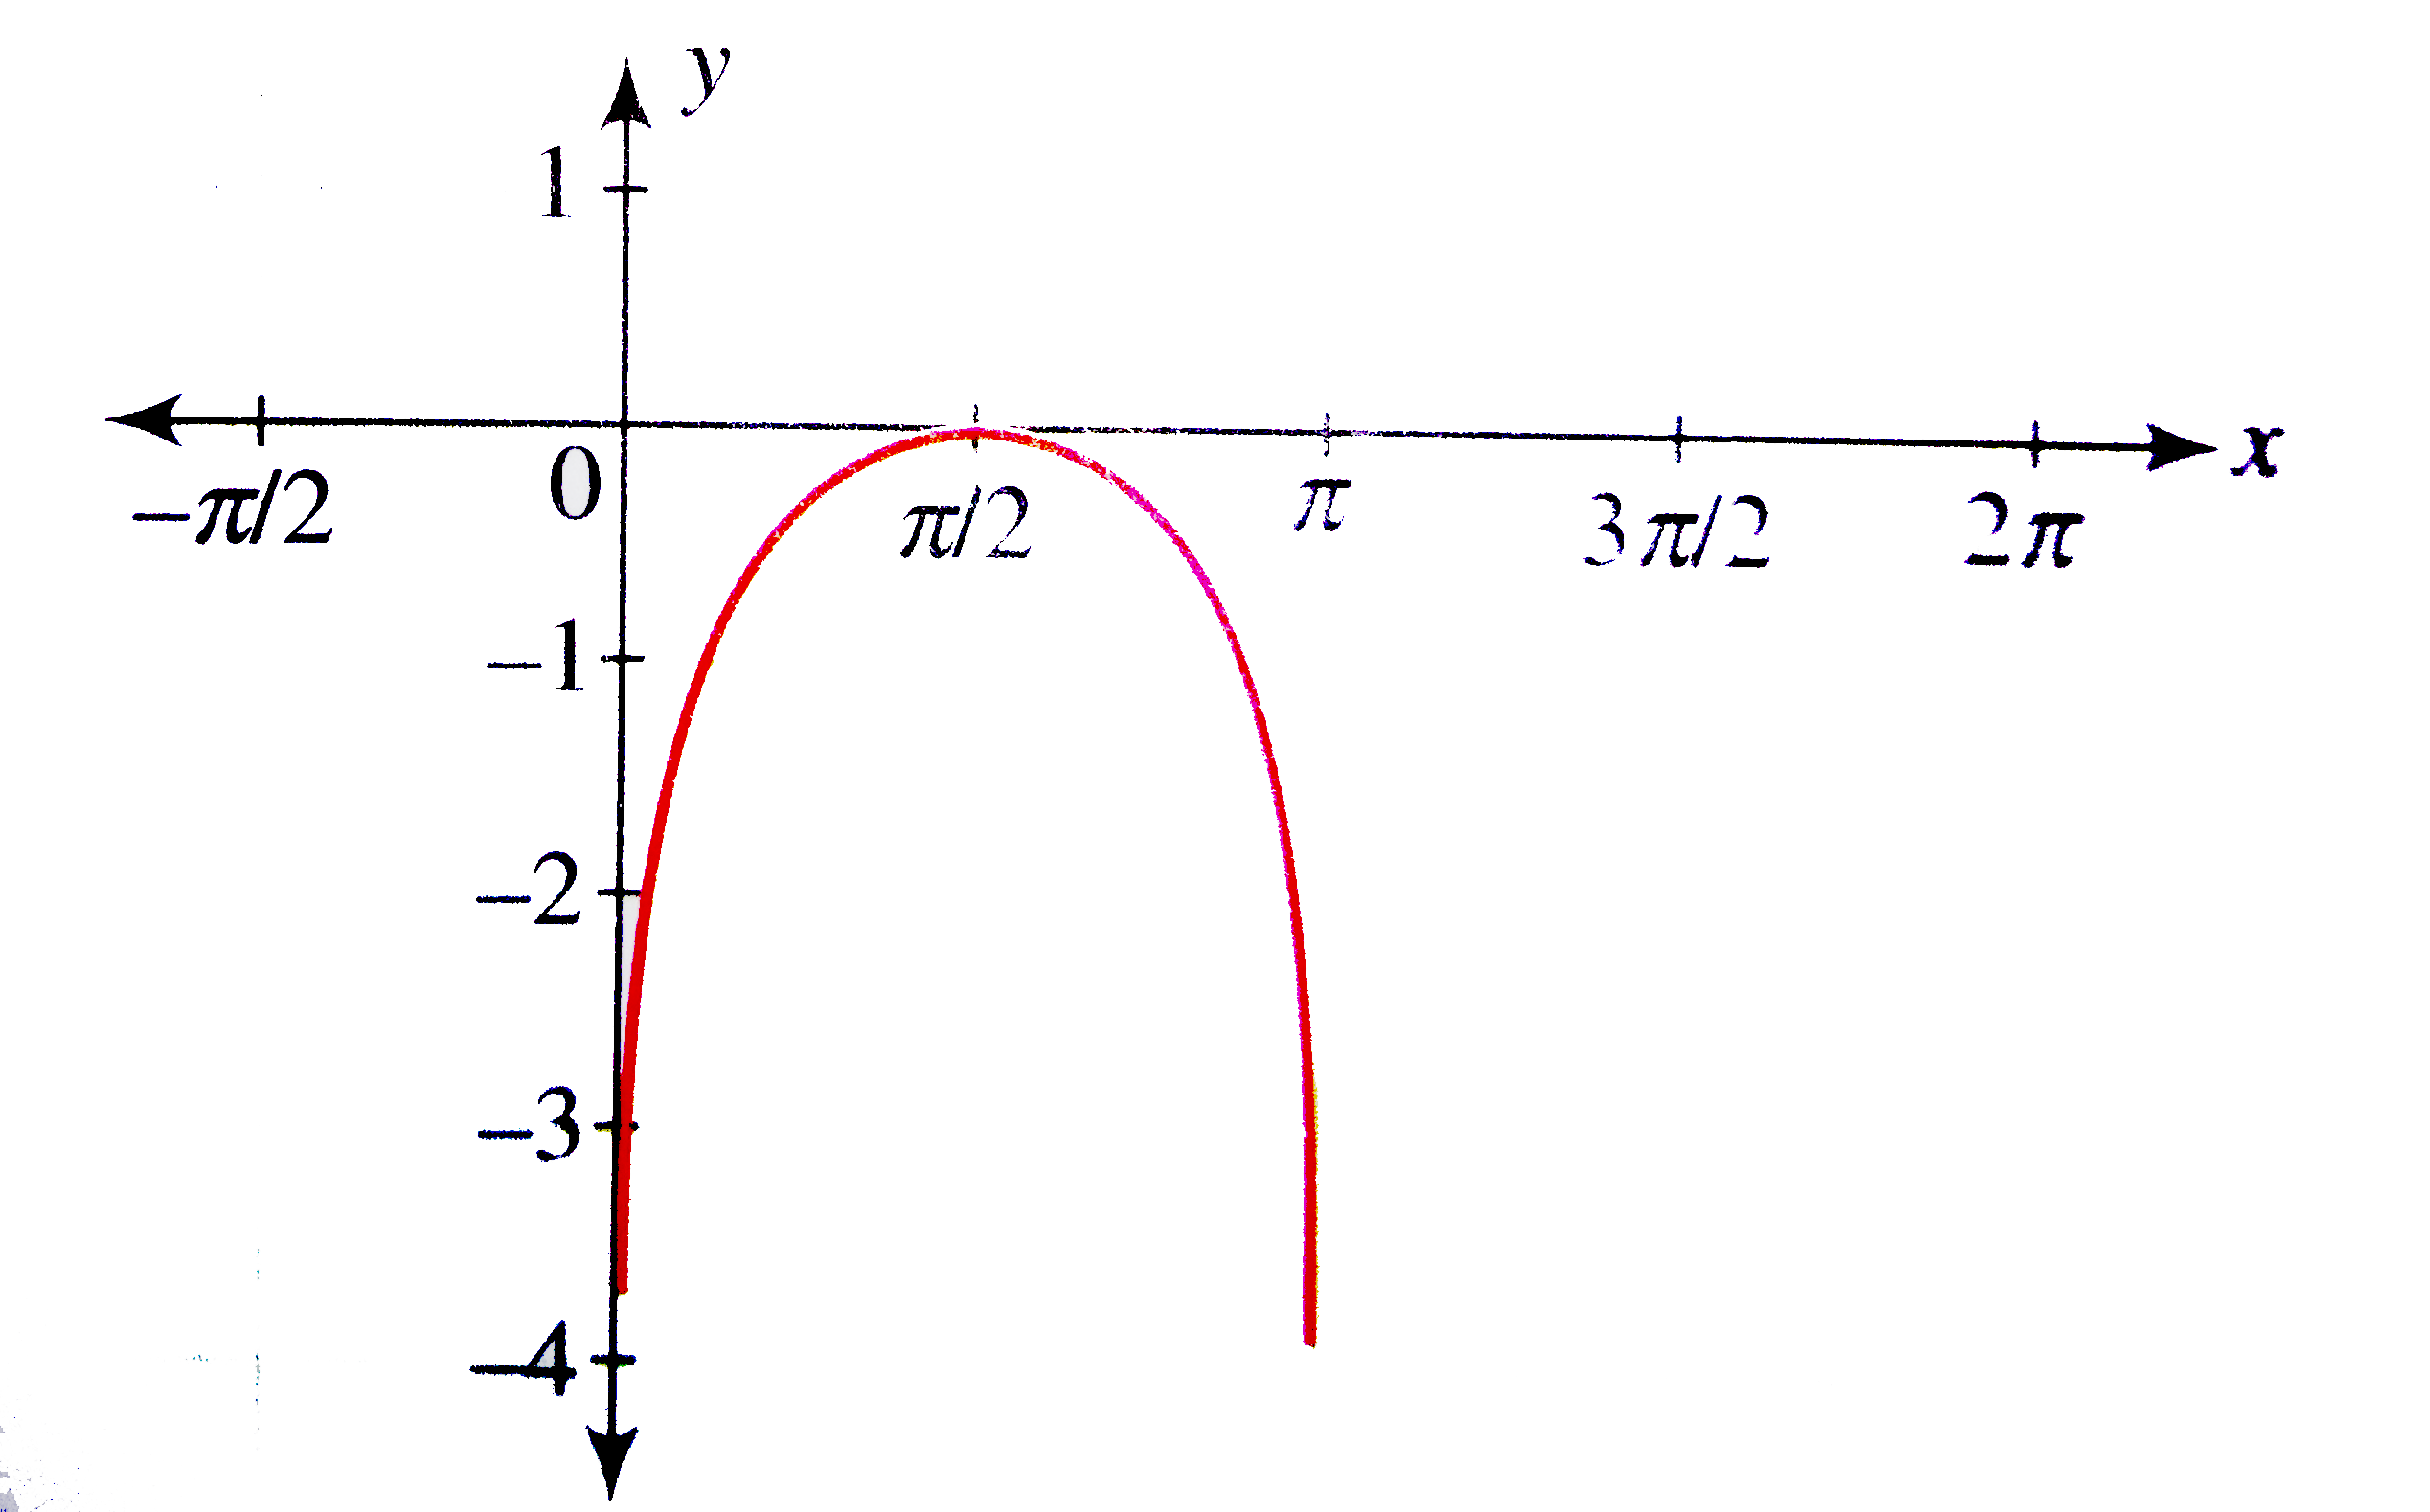
Period of y = f(x) is 2π. However, the function is not defined in (π,2π). The graph is for (0,π) only.
Now when x→0+orx→π−,sinx→0+, for which loge(sinx)→−∞
Also f(π/2)=loge(1)=0
f'(x)=cotx,
f''(x)−cosec2x<0
Hence the graph is concave downwards.
The graph of the function for x∈(0,π) is as shown in the following figure.

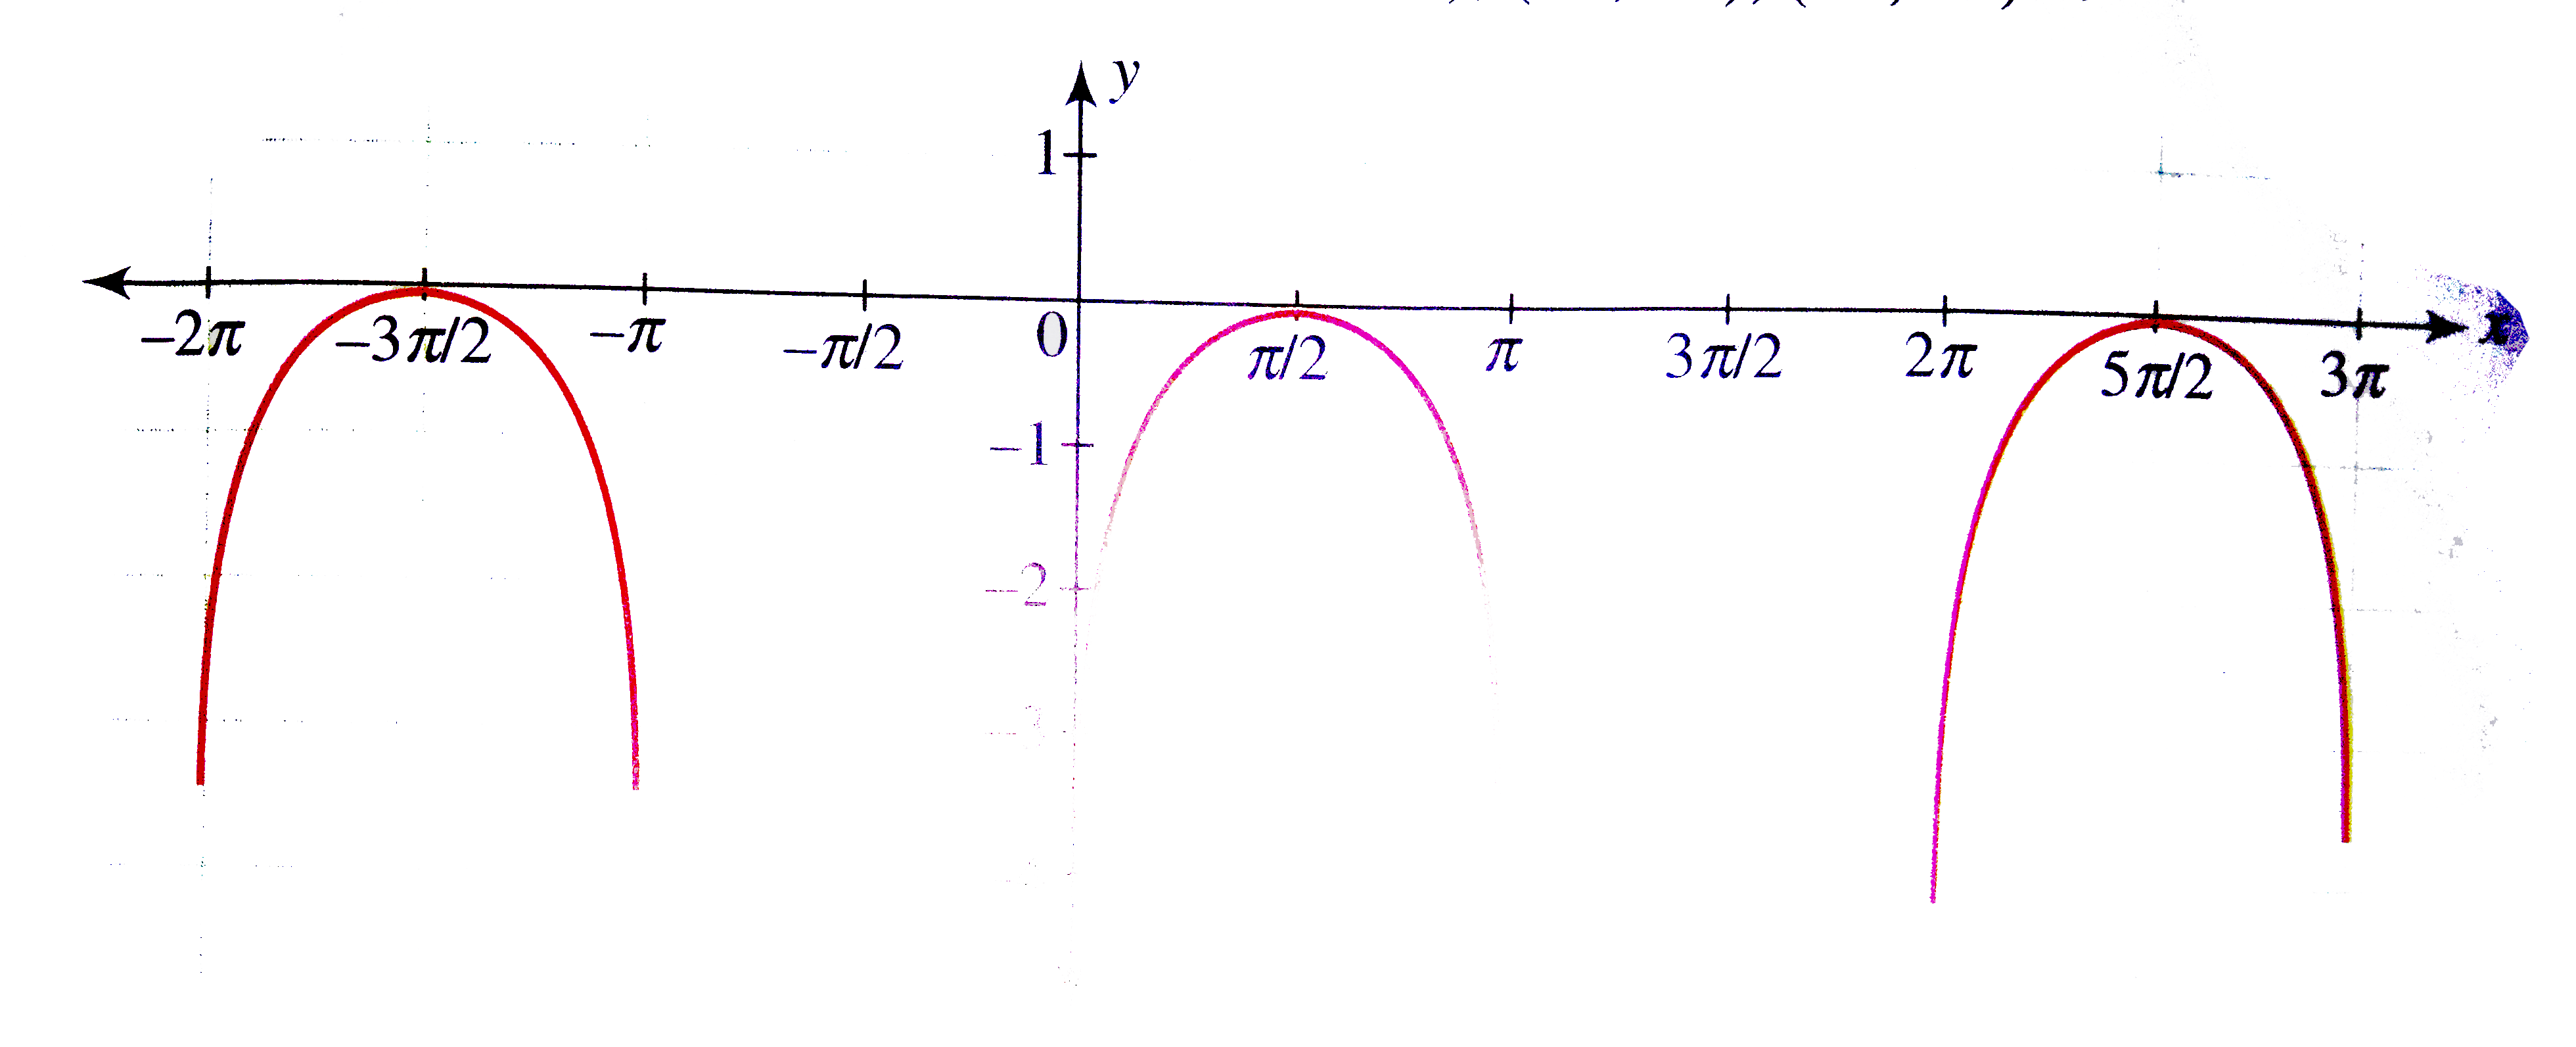
We have same graphs of intervals ...(−2π,−π),(2π,3π),(4π,5π)...

Topper's Solved these Questions
- GRAPHS OF TRIGONOMETRIC FUNCTIONSBOOK - CENGAGECHAPTER - GRAPHS OF TRIGONOMETRIC FUNCTIONSEXERCISE - Exercise
22 Videos
- GRAPHS OF ELEMENTARY FUNCTIONS BOOK - CENGAGECHAPTER - GRAPHS OF ELEMENTARY FUNCTIONS EXERCISE - Exercise
34 Videos
- HIGHT AND DISTANCE BOOK - CENGAGECHAPTER - HIGHT AND DISTANCE EXERCISE - JEE Previous Year
3 Videos
Similar Questions
Draw the graph of y= cosec 2x−cot2x. Is f(x) periodic ? If yes, what is its fundamental period ?
View SolutionDraw the graph of y=1(1/x).
View SolutionA bird is sitting on the top of a vertical pole 20 m high and its elevation from a point O on the ground is 45o . It flies off horizontally straight away from the point O. After one second, the elevation of the bird from O is reduced to 30o . Then the speed (in m/s) of the bird is (1) 40(√2−1) (2) 40(√3−2) (3) 20√2 (4) 20(√3−1)
View SolutionDraw the graph of y=−logex.
View SolutionDraw the graph of y=|loge(x+3)|.
View SolutionDraw the graph of y=|loge|x||.
View SolutionDraw the graph of y=loge(sinx).
View SolutionDraw the graph of y=loge(−x),−logex,y=|logex|,y=loge|x| and y=|loge|x|| transforming the graph of y=logex.
View SolutionDraw the graph of y=1logex
View SolutionDraw the graph of y=(logex)2
View SolutionDraw the graph of y=|loge(x+3)|.
View SolutionDraw the graph of y=loge(sinx).
View SolutionDraw the graph of y=loge(−x),−logex,y=|logex|,y=loge|x| and y=|loge|x|| transforming the graph of y=logex.
View SolutionDraw the graph of y=(logex)2
View SolutionDraw the graph of y=-log_(e)x .
View Solution
