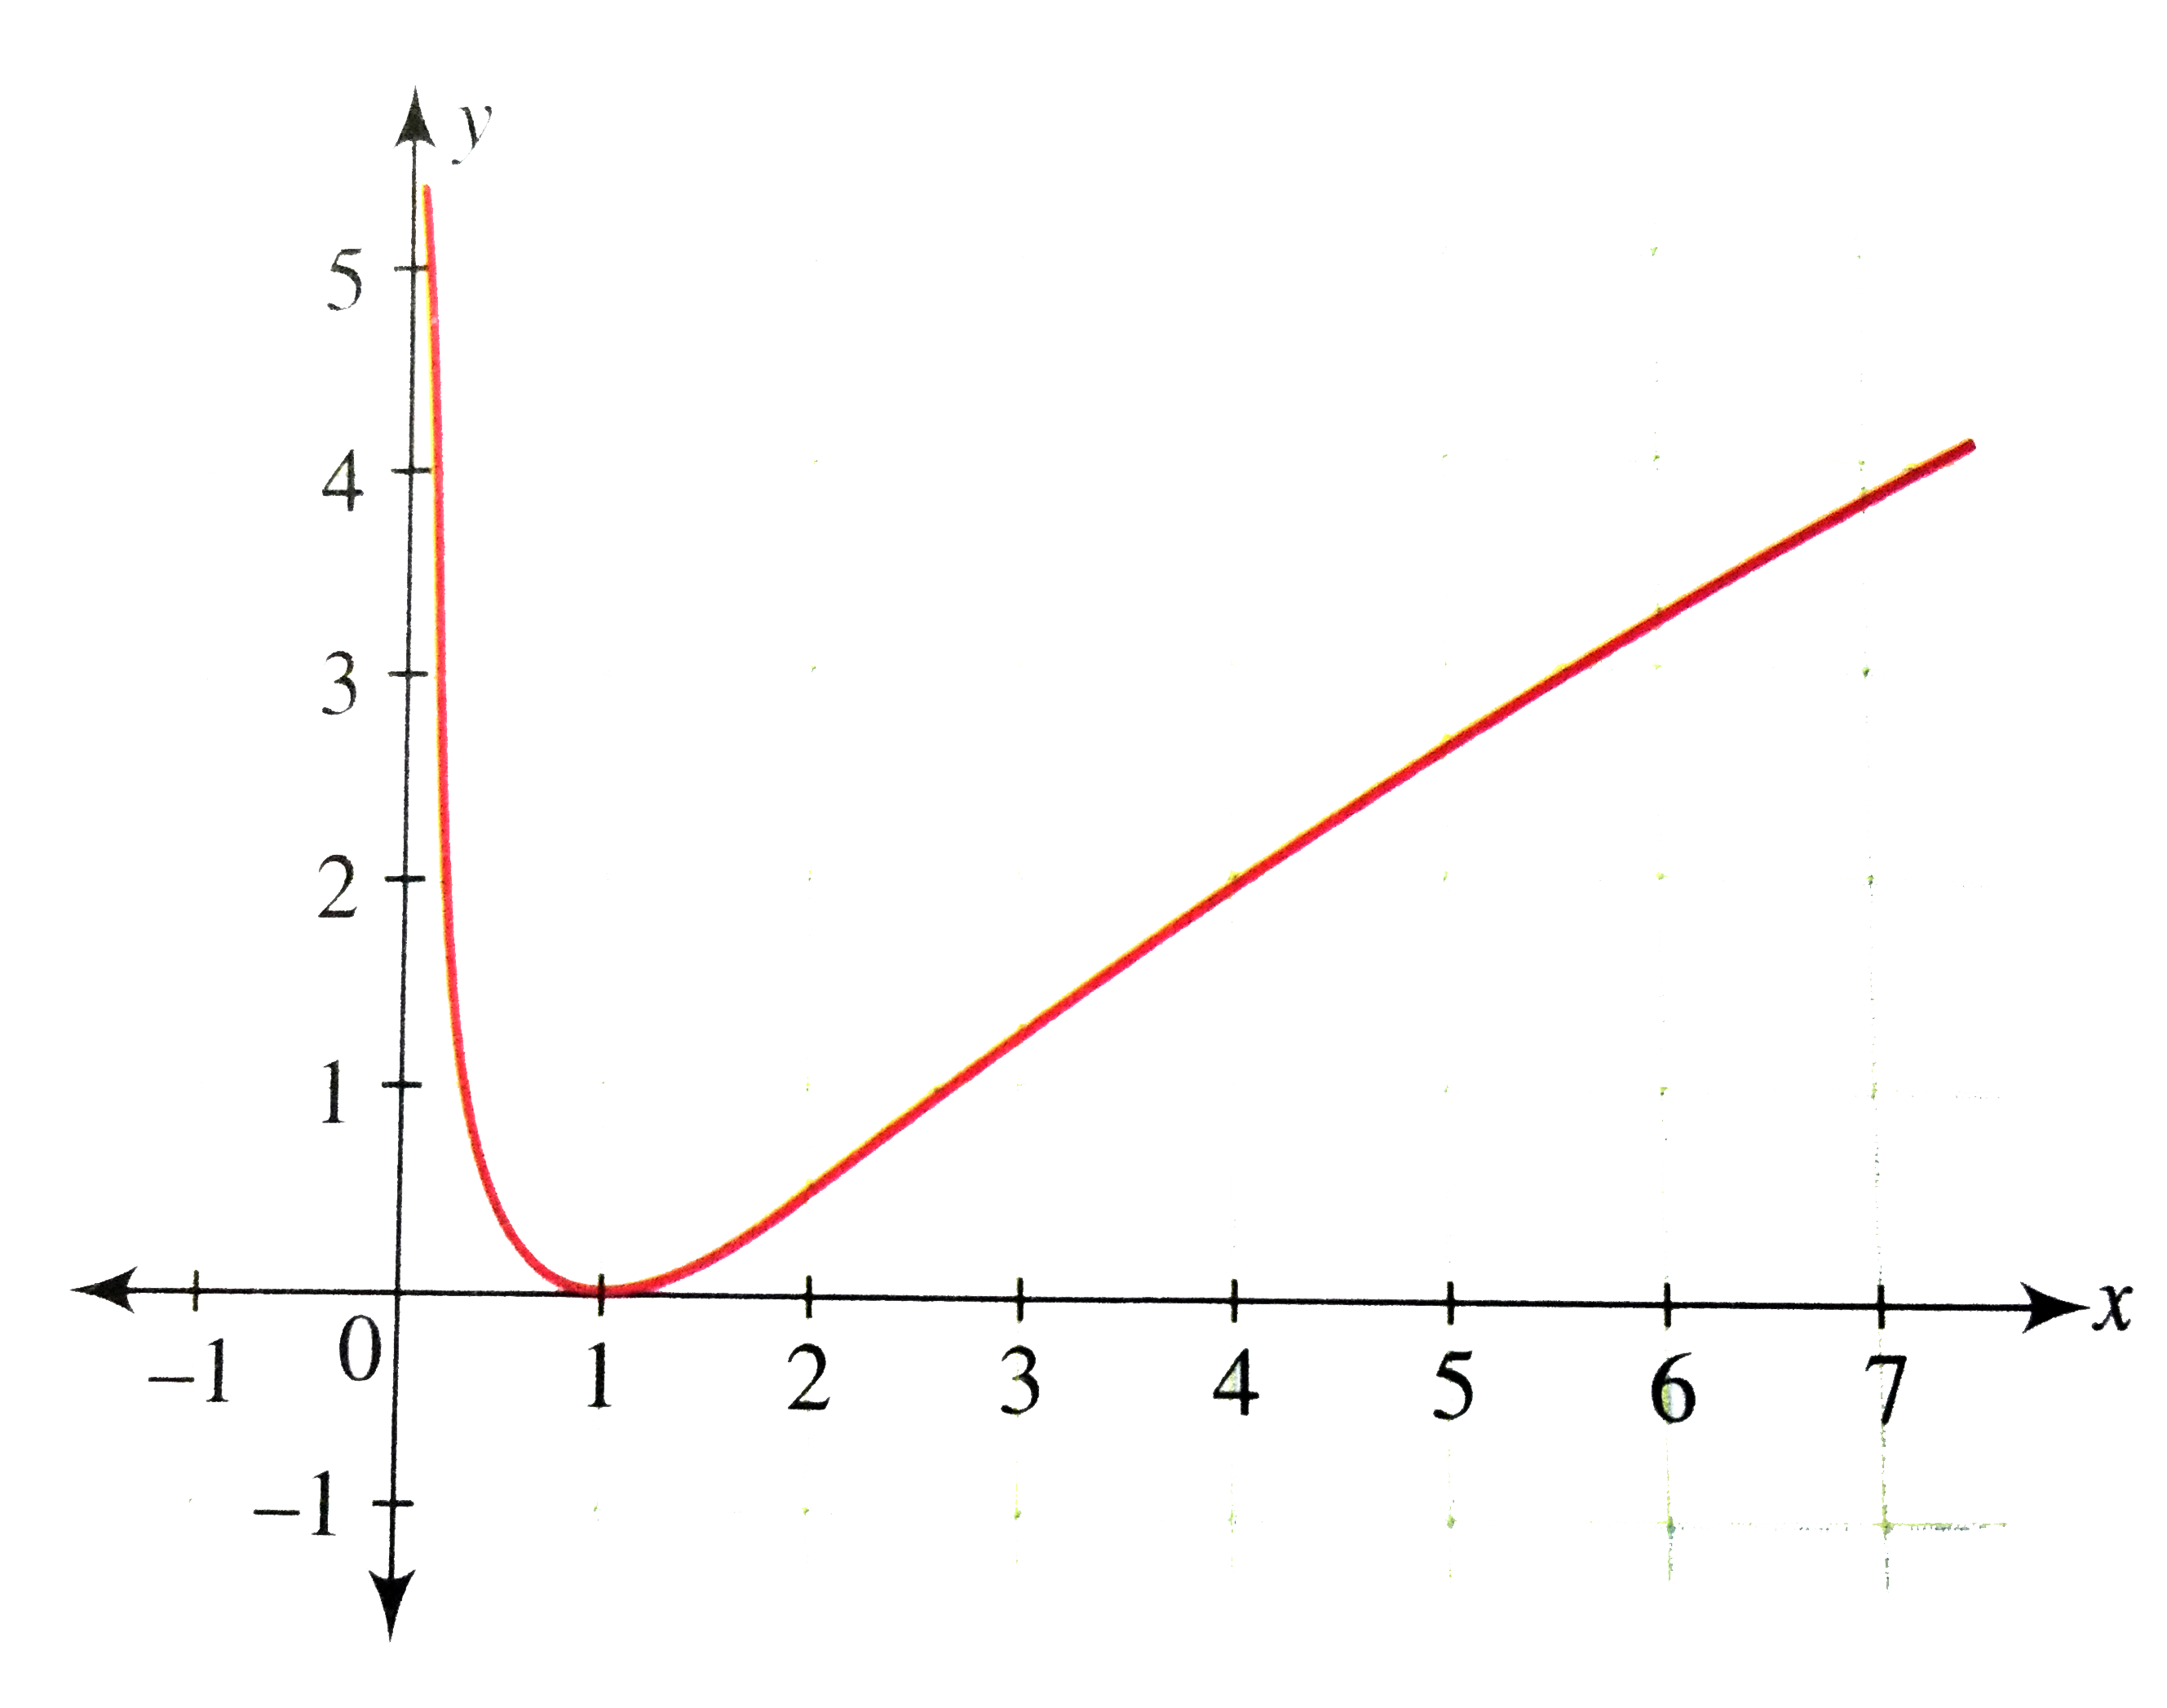
Draw the graph of Solution in Tamil
Video Solution
Text Solution
for all
and when
When
Also for , which is clearly the point of minima
From these information, we can plot the graph of the function as shown in the following figure.

for
for
|
Topper's Solved these Questions
Similar Questions
Draw the graph of y=sin2x−cosx
View SolutionLet →a and →b be two vectors of equal magnitude 5 units. Let →p,→q be vectors such that →p=→a−→b and →q=→a+→b. If |→p×→q|=2{λ−(→a.→b)2}12, then value of λ is
View SolutionSolve: (x+2)3=2x(x2−1)
View SolutionDraw the graph of y=−logex.
View SolutionDraw the graph of y=|loge(x+3)|.
View SolutionDraw the graph of y=|loge|x||.
View SolutionDraw the graph of y=loge(sinx).
View SolutionDraw the graph of y=loge(−x),−logex,y=|logex|,y=loge|x| and y=|loge|x|| transforming the graph of y=logex.
View SolutionDraw the graph of y=(logex)2
View SolutionDraw the graph of y=|loge(x+3)|.
View SolutionDraw the graph of y=loge(sinx).
View SolutionDraw the graph of y=loge(−x),−logex,y=|logex|,y=loge|x| and y=|loge|x|| transforming the graph of y=logex.
View SolutionDraw the graph of y=(logex)2
View SolutionDraw the graph of y=-log_(e)x .
View SolutionDraw the graph of y=|log_(e)(x+3)| .
View Solution
