Draw the graph of y=tan−1|x|.Solution in Tamil
Video Solution
Text Solution
We have y=f(x)=tan−1(3x−x31−3x2)
Domain of f(x) is R={−1√3,1√3}
Let x =tanθ,θ∈(−π/2,π/2)
⇒ θ=tan−1x
Now tan−1(3x−x31−3x2)=tan−1(3tanθ−tan3θ1−3tan2θ)
=tan−1(tan3θ)
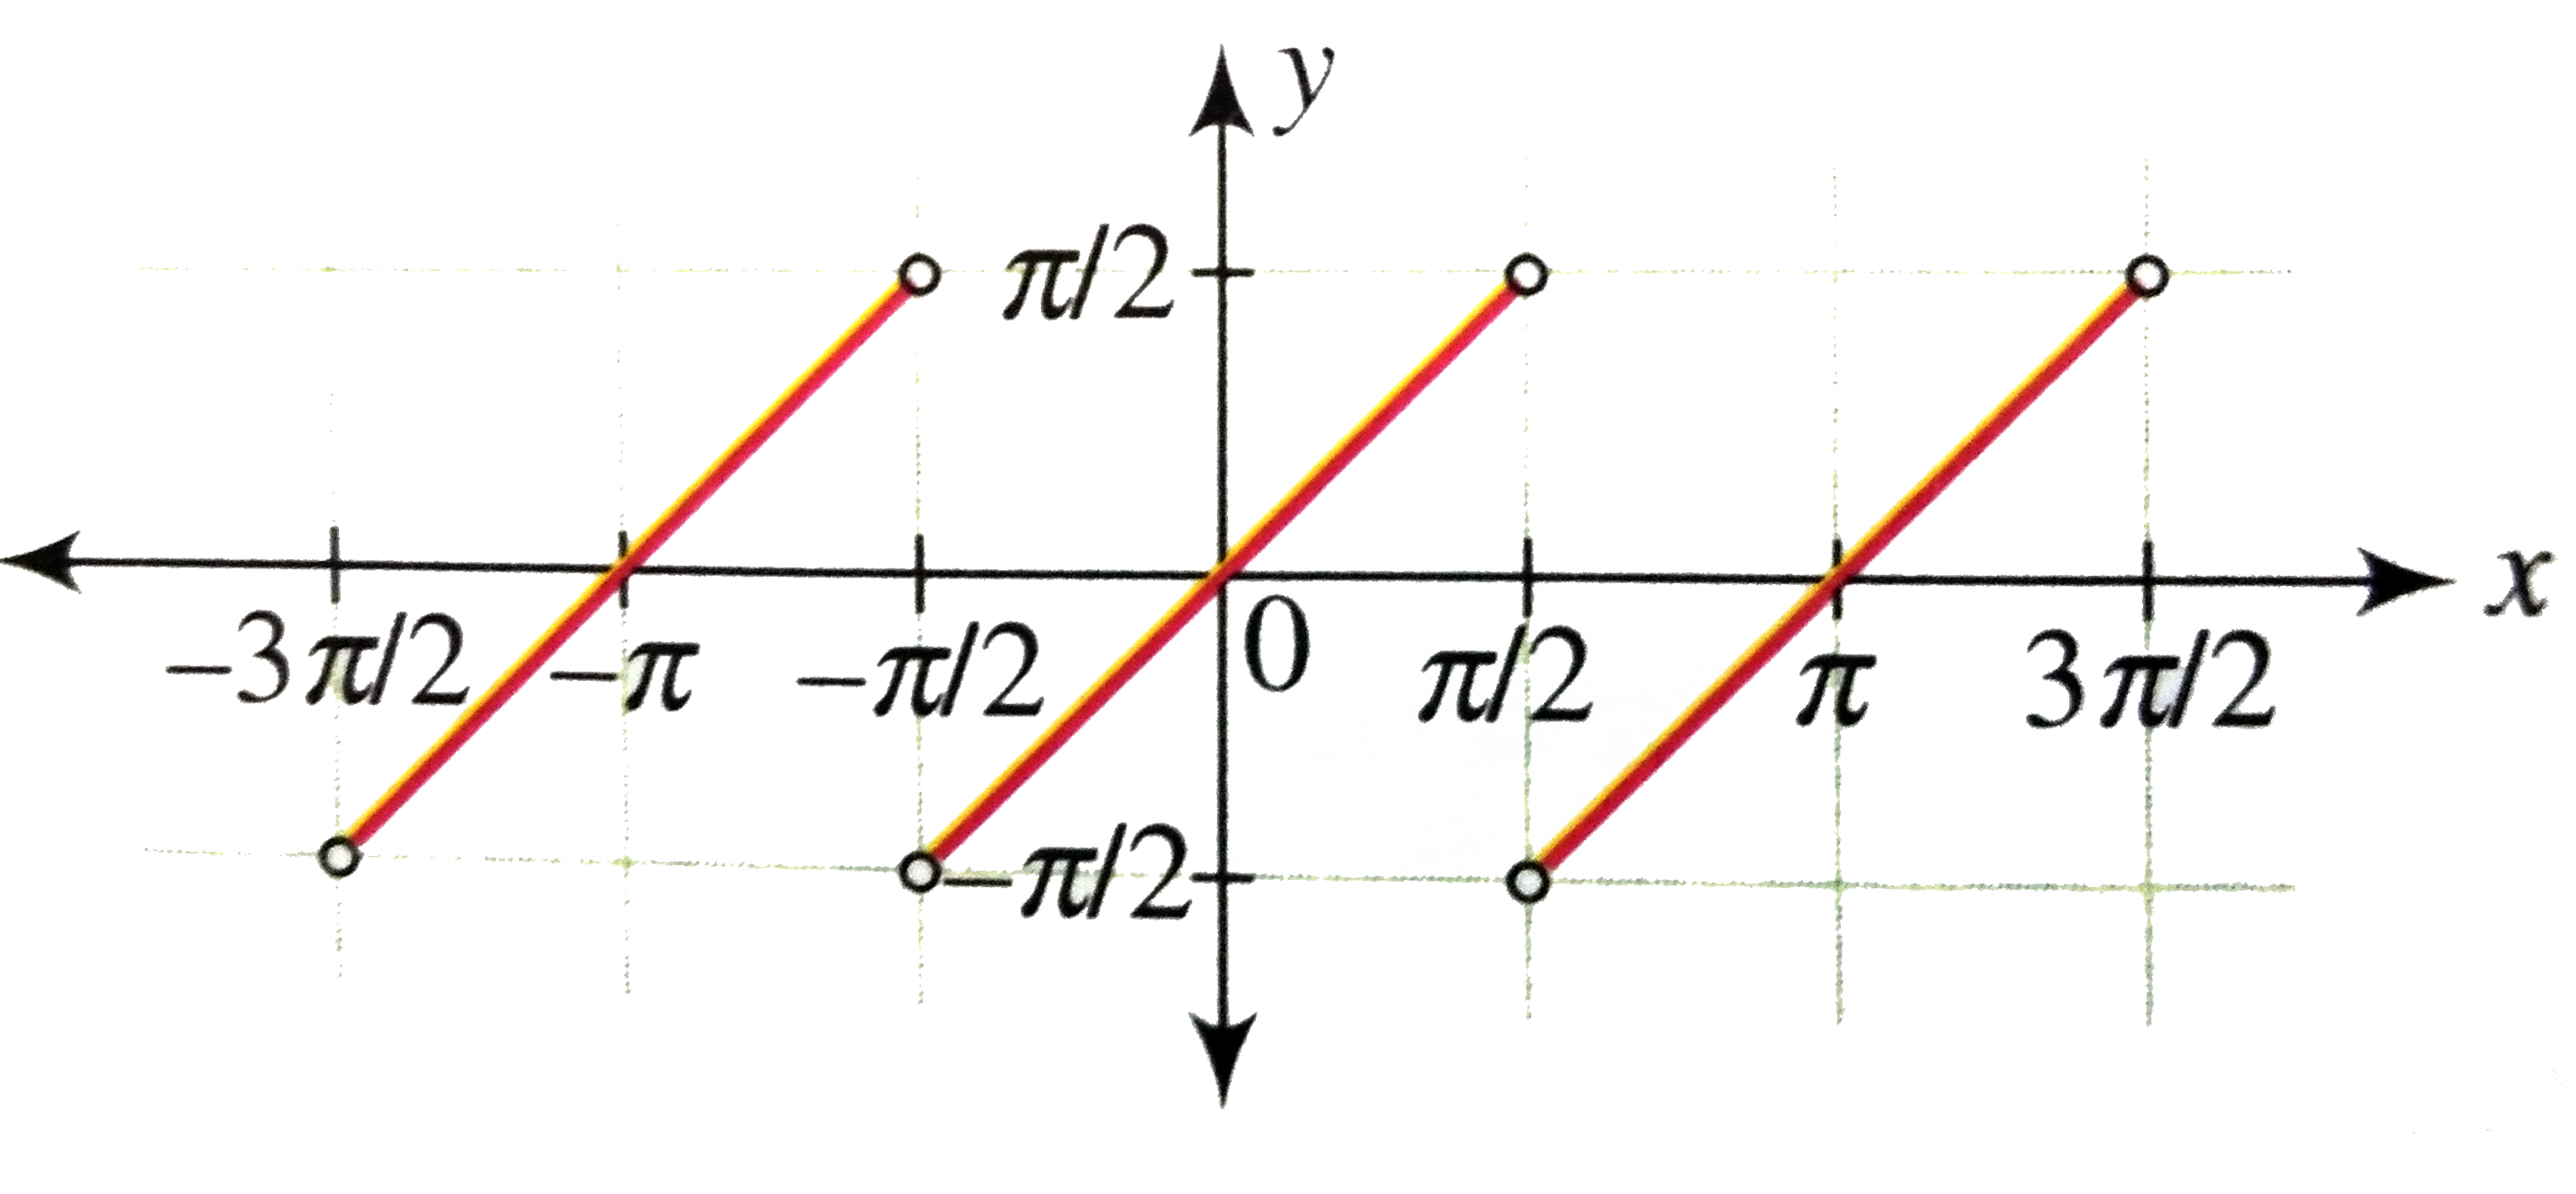
tan−1(tanα),where α∈(−3π/2,3π/2)
Now consider the graph of y=tan−1(tanα), where α∈(−3π/2,3π/2).

From the graph,
tan−1(3x−x31−3x2)=tan−1(tanα)
=⎧⎪⎨⎪⎩α+π−3π/2<α−π/2α−π/2<α<π/2α−ππ/2<α<3π/2
=⎧⎪
⎪⎨⎪
⎪⎩3tan−1x+π−3π/2<tan−1x<−π/23tan−1x−π/2<3tan−1x<π/23tan−1x−ππ/2<3tan−1x<3π/2
=⎧⎪
⎪⎨⎪
⎪⎩3tan−1x+π−π/2<tan−1x<−π/63tan−1x−π/6<tan−1x<π/63tan−1x−ππ/6<tan−1x<π/2
=⎧⎪
⎪⎨⎪
⎪⎩3tan−1x+π−∞<x<−1/23tan−1x−1/√3<x<1/√33tan−1x−π1/√3<x<∞
tan−1 is an invreasing function for x∈R.
So all brance functions in (i) are increasing functions
limx→−∞(3tan−1x+π)=−π2,limx→−1√3(3tan−1x+π)=π2
3tan−1x+π=0∴x=−√3
Thus, tan−1(3x−x31−3x2) increases from −π2toπ2when x increases from −∞toπ2intersecting the x-axis at x =−√3
limx→∞(3tan−1x−π)=π2,limx→1√3(3tan−1x−π)=−π2
3tan−1x−π=0∴x=−√3
Thus tan−1(3x−x21−3x2) increases form −π2toπ2 when x increases form 1√3 to ∞intersecting the x-axis at x=√3
From this information, we can draw the graph of y=tan−1(3x−x21−3x2) can be drawn as follows.

|
Topper's Solved these Questions
- GRAPH OF INVERSE TRIGONOMETRIC FUNCTIONSBOOK - CENGAGECHAPTER - GRAPH OF INVERSE TRIGONOMETRIC FUNCTIONSEXERCISE - Exercise
18 Videos
- GETTING STARTED WITH GRAPHSBOOK - CENGAGECHAPTER - GETTING STARTED WITH GRAPHSEXERCISE - Exercise
18 Videos
- GRAPHICAL TRANSFORMATIONSBOOK - CENGAGECHAPTER - GRAPHICAL TRANSFORMATIONSEXERCISE - Exercise
14 Videos
Similar Questions
Draw the graph of y=tan−1x+cot−1x
View SolutionDoes the following graph pass the vertical or horizontal line test ?

View SolutionDraw the graph of y=tan−1x−cot−1x.
View SolutionDraw the graph of y=tan−1|x|.
View SolutionDraw the graph of y=tan−1x−cot−1x.
View SolutionDraw the graph of y=tan−1(tanx)
View SolutionDraw the graph of y=tan−1(2x1−x2)
View SolutionDraw the graph of y=tan−1x+cot−1x
View SolutionDraw the graph of the following
y=tan−1.2x1−x2
View Solutiony=tanx का ग्राफ खींचिए|
View SolutionDraw the graph of y=tan−1|x|.
View SolutionDraw the graph of y=tan−1(tanx)
View SolutionDraw the graph of y=tan−1(2x1−x2)
View SolutionDraw the graph of y=tan−1x+cot−1x
View SolutionDraw the graph of y=tan^(-1)|x| .
View SolutionDraw the graph of y=tan^(-1)x-cot^(-1)x .
View Solution
