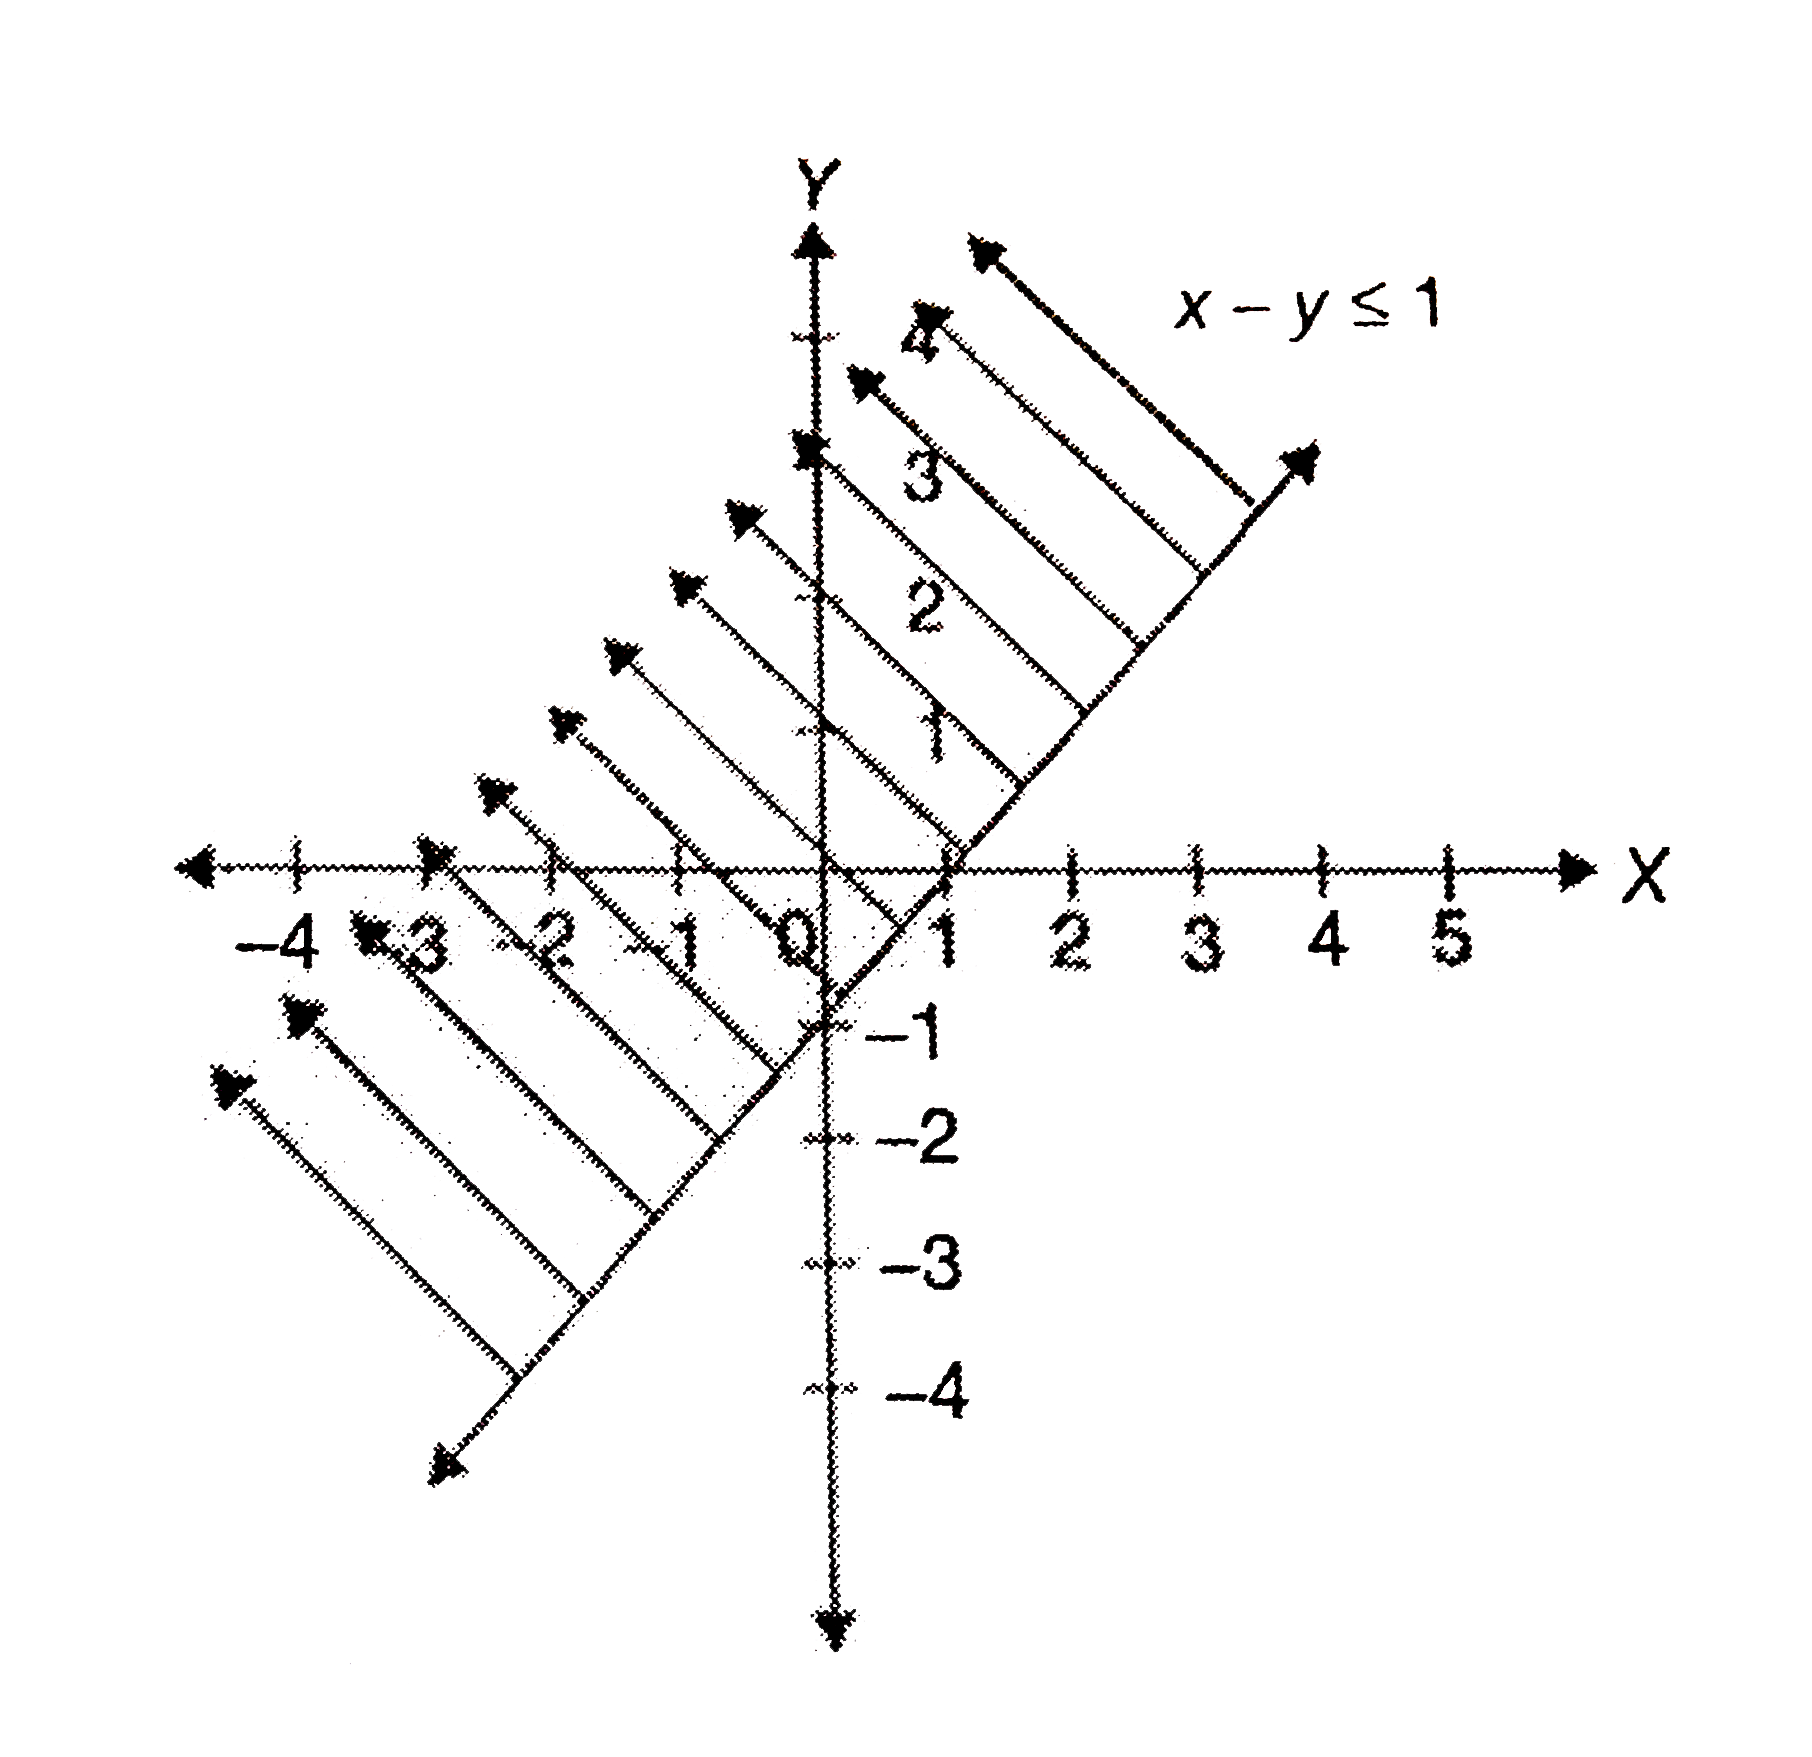
Draw the graph x−y≤1 in the cartesian plane
Video Solution
Text Solution
(a) First draw the line x−y=1 i.e., y=x−1
x10−1y0−1−2
As a first step, plot the ordered pairs (1,0), (0,−1),(−1,−2) and then join them with a line

(b) For shading the region we consider any point in one of the half planes.
Let us consider the point (0,0). Here, boundary line x−y=1 is included
|
Topper's Solved these Questions
- LINEAR EQUATIONS AND INEQUATIONSBOOK - PEARSON IIT JEE FOUNDATIONCHAPTER - LINEAR EQUATIONS AND INEQUATIONSEXERCISE - Very short Answer Type Questions
30 Videos
- LINEAR EQUATIONS AND INEQUATIONSBOOK - PEARSON IIT JEE FOUNDATIONCHAPTER - LINEAR EQUATIONS AND INEQUATIONSEXERCISE - Short Answer Type Questions
14 Videos
- GEOMETRYBOOK - PEARSON IIT JEE FOUNDATIONCHAPTER - GEOMETRYEXERCISE - CONCEPT APPLICATION
61 Videos
- LOCUSBOOK - PEARSON IIT JEE FOUNDATIONCHAPTER - LOCUSEXERCISE - Level 3
15 Videos
Similar Questions
Draw the graph x−y≥0 in the Cartesian plane.
View SolutionDraw the graph x≥1 in the cartesian plane
View SolutionDraw the graph of y<2 in the Cartesian plane
View SolutionDraw the graph of x>−2 in the Cartesian plane.
View SolutionDraw the graph of y=−x
View SolutionDraw the graph of y≤x+2.
View SolutionDraw the graph x≥2 in the Cartesian plane.
View SolutionDraw the graph of y=|x|
View SolutionDraw the graph of y = 3x +1.
View SolutionDraw the graphs y≤−1andy≤2.5 in the Cartesian plane.sateu
View Solution
